 Fourplex
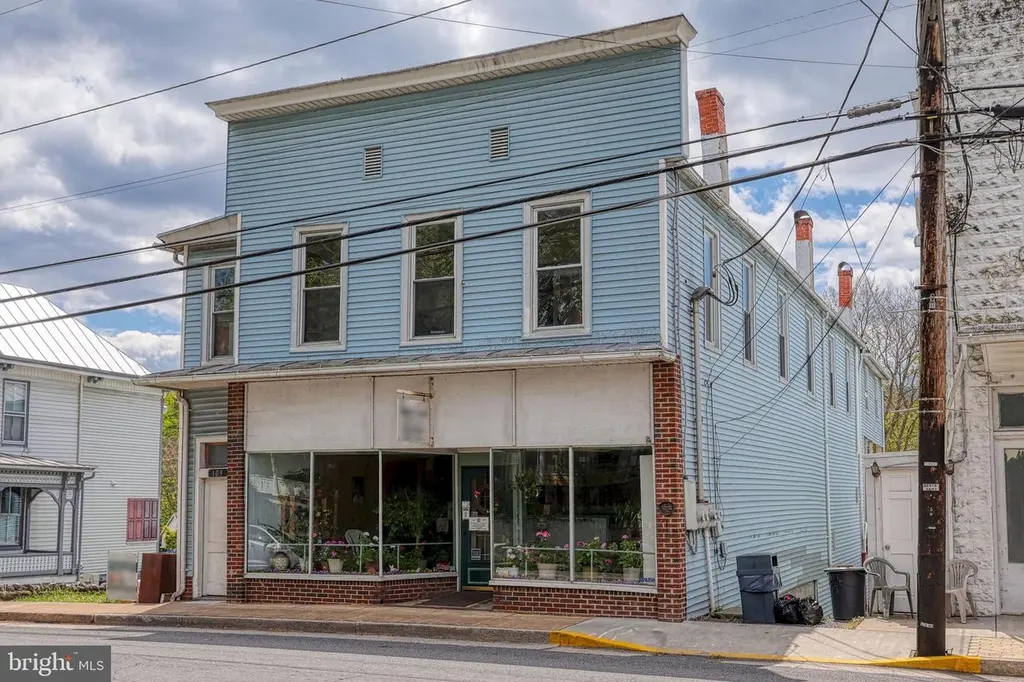
109 N Main St · Edinburg, VA
Flood risk No data
- FEMA flood zone
- —
- Chance of flooding over 30 yrs
- —
- Est. flood insurance / yr
- —
Fire risk No data
- Est. fire insurance / yr
- —
Heat risk No data
- Hot days now (above threshold)
- —
- Hot days in 30 yrs
- —
Wind risk No data
- Chance of severe wind over 30 yrs
- —
Air-quality risk No data
- Unhealthy air days now
- —
- Unhealthy air days in 30 yrs
- —
Risk factors via First Street. Map © Google.
Why this score? — see what drove the A- grade
The composite is a weighted blend of 9 inputs, each scored 0–100. Each bar is that input's sub-score; the figure is the points it added to the 100-point composite (weight × sub-score).
- Cash flow +30.0/30.0
- 1% rule +10.0/10.0
- DSCR +10.0/10.0
- Appreciation +10.0/10.0
- ARV discount +7.5/15.0
- Schools +4.4/10.0
- Livability +3.4/5.0
- Condition / age +2.8/5.0
- Rent growth +2.5/5.0
$325,000
🖨 Deal sheet 📄 Offer letter ✓ Due diligence
Multi-family units
County records classify this as Multi-Family (2-4 Unit). Listing-text estimate: 4 units. confirmed
Listing remarks
Spacious four-Unit multifamily property located in the heart of town, offering over 4,000 square feet of living space. This well-positioned investment opportunity features four separate units, providing strong income potential and flexibility for a variety of rental strategies. Conveniently situated near local shops, dining, and amenities, the property appeals to both tenants and investors alike. With its generous size and prime in town location, this is an excellent opportunity to expand your portfolio or generate consistent rental income.
Key facts
- 5,358 sq ft lot
- Built 1922
- Listed 30 days
Property features AI
Finance
- Other: Fee simple ownership
- Financial info: Four total units; Three units currently leased; One unit vacant; All existing leases are month-to-month
Exterior
- Parking: On-street parking; Alley access
- Utilities: Public water; Private sewer; Electric service
- Home design: Detached multi-unit building; Above-grade finished living space
- Construction: Vinyl siding exterior; Stone foundation; Above-grade and below-grade structures; Year built per assessor
- Exterior features: Located within city limits; No tidal water
Interior
- Bedrooms: Four-unit building with one 1-bedroom unit and two 2-bedroom units
- Heating & cooling: Electric baseboard heating; Electric hot water
- Interior features: Estimated living area
Neighborhood map
What this means for you Summary
Snapshot
- This is a 4 × 2-bed/1-bath units multifamily listed at $325k. Condition is rated average.
Deal economics
- At list price, monthly cash flow is $2k ($22k/yr) — positive. Per door: $450/mo.
- The deal already cash-flows at list — no discount required.
- Meets the 1% rule at list price ($5k rent vs $325k).
- Recommended offer: $320k (1.5% below list) — sets the bar for market timing.
Location & tenants
- Location reads 67/100 on livability (#294 in VA) — a middle-class / working-renter tenant base. Strengths: crime A+, housing A+, cost of living A; Watch: amenities F, commute F, health & safety D-.
- Shenandoah County Public School District (town): math 46% / reading 58% proficiency, ranked #91 of 131 in VA (top 70%) — acceptable for families but not a draw, mixed tenant base, ~2y average lease.
- Zoned schools: W.W. Robinson Elementary (math 53% / reading 49%, grade C-, #733 of 1,108 statewide, top 66%, 1,061 students, 74% FRL); Peter Muhlenberg Middle (math 33% / reading 57%, grade D, #274 of 342 statewide, top 81%, 451 students, 73% FRL); Central High (math 46% / reading 66%, grade C, #275 of 319 statewide, top 87%, 749 students, 73% FRL) — zoned schools average 73% FRL vs 37% district-wide (36 pts higher); higher-poverty schools than district average — tighter screening recommended.
- Market conditions: 44 active listings in the ZIP; 224 units permitted in Shenandoah County in 2024 (0 in 5+ unit buildings).
Forward outlook
- In year one you build about $35k of equity ($2k loan paydown + $32k appreciation (10.0% local appreciation)).
- Shenandoah County population projected at +5% by 2050 — modest demand growth; plan on rents tracking national, not racing it.
- At projected returns (10.0% appreciation + 3.0% rent growth), your $91k cash investment doubles in ~2 years — after that, you're playing with house money.
- By year 2, paydown + projected appreciation supports a ~$56k cash-out refi (75% LTV) — recoverable capital for the next deal without selling this one.
Negotiation context
- It's been on market 30 days — a 2% lower offer ($320k) is reasonable based on typical stale-listing flexibility.
Risks & watch-outs
- Watch-outs: built in 1922 — expect roof / HVAC / electrical / plumbing capex.
Questions for the listing agent
- Can we see the unit-by-unit rent roll, current vacancy, and any below-market leases? What's the average tenancy length?
- What capital expenditures (roof, boiler, parking lot, exteriors) have been made in the last 5 years, and what's planned in the next 2?
- Built in 1922 — when were the roof, HVAC, electrical panel, plumbing, and water heater last replaced?
- Is there a deadline driving the sale (1031 exchange, divorce, estate, relocation)? That informs how much negotiation room exists.
- Schools are D-rated, which usually means shorter tenancies and higher turnover. Who's the typical renter profile here, and what's been the actual vacancy rate?
- What's the average days-on-market for RENTAL listings here right now (not sales)? A rising rental-DOM trend means longer vacancies and softer asking-rent achievability than the comps imply.
- What's the recent tenant-quality profile in this submarket — average credit score on applications, eviction rate, late-payment / NSF rate, and stable-employment percentage? A property-management company in the area should have these aggregated.
- How much new apartment / multifamily construction is in the pipeline within 1–3 miles? Heavy new supply (>2% of stock underway) typically softens rents 12–24 months out; light construction supports rent growth.
Investment metrics
- 1% rule
- 1.58% ✓
- Cap rate
- 12.94%
- Cash-on-cash
- 23.73%
- DSCR
- 2.06
- GRM
- 5.3
CMA / ARV
No comps found within radius.
Projected returns pro-forma
10.0% appreciation · 3.0% rent growth · sell at horizon
- IRR
- 42.1%
- Equity multiple
- 4.21×
- Total profit
- $291,698
- Equity at exit
- $292,786
- IRR
- 36.4%
- Equity multiple
- 9.45×
- Total profit
- $769,021
- Equity at exit
- $631,404
Cash invested: $91,000 (down + closing). Projections, not guarantees.
Landlord ↔ Tenant lean methodology
- Overall (STATE)
- 55 Moderately Landlord-Leaning
- State Virginia
- 55 Moderately Landlord-Leaning · D+2
- County
- — inherits STATE
- City
- — inherits STATE
ZIP-level market 22824
- Home prices YoY
- 8.9%
- Active inventory
- 44
- Price-to-rent
- 21.2×
Monthly cashflow live
- Estimated rent
- $5,121 medium interval (Pro) →
- Mortgage (P&I)
- −$1,704
- Tax est. 1.5%
- −$406 /mo · $4,875/yr
- Insurance
- −$135
- HOA
- −$0
- Vacancy / Maint / Mgmt
- −$1,075
- Net cashflow
- $1,800
Break-even live
4-unit breakdown (identical units grouped — click to expand)
| Units | Beds | Baths | Est. rent |
|---|---|---|---|
| 4× units | 2 | 1 | $5,120 |
| #1 | 2 | 1 | $1,280 |
| #2 | 2 | 1 | $1,280 |
| #3 | 2 | 1 | $1,280 |
| #4 | 2 | 1 | $1,280 |
| Total (4 units) | $5,121 | ||
UW: 25.0% down · 7.5% · 30yr · 1.5% tax · 5.0% vac · 8.0% maint · 8.0% mgmt
Financing live
Cash to close
- Down payment
- $81,250
- Closing costs
- $9,750
- Reserves months
- —
- Total cash needed
- —
Loan-product check · same deal, 3 products live
Conventional
25% down · 7.5% · 30yr
- Down + closing
- —
- Monthly P&I
- —
- Monthly cashflow
- —
- DSCR
- —
- Eligible?
- —
Personal DTI + credit; lowest rate.
DSCR
20% down · 8.5% · 30yr
- Down + closing
- —
- Monthly P&I
- —
- Monthly cashflow
- —
- DSCR
- —
- Eligible?
- —
No personal income docs; deal must DSCR.
Hard money
10% down · 12.0% · 12mo
- Down + closing
- —
- Monthly P&I
- —
- Monthly cashflow
- —
- DSCR
- —
- Eligible?
- —
Short-term bridge; refi at stabilization.
Listing history 3 events
-
2026-05-31status $325,000 Pending 30 DOM
-
2026-05-01$325,000 Active 546-char remark
-
2026-04-24historical $325,000 546-char remark
ⓘ Source: listings_history table (triggers on properties + properties_extension) + one-shot
backfill from property_details.listing_events for pre-trigger history.
Nearby sold comps map
Loading sold comps map…
Walkable amenities ~0.75 mi
Loading nearby amenities…
Taxation est. · year 1
- Rental income
- $61,452
- − Mortgage interest
- −$18,205
- − Property taxes
- −$4,875
- − Insurance
- −$1,625
- − Repairs & maintenance
- −$4,916
- − Management
- −$4,916
- − Depreciation
- −$9,455
- Taxable income
- $17,460
- Est. tax owed @ 24.0%
- −$4,190
- After-tax cash flow
- $17,405/yr
For passive investors: Depreciation is non-cash, so a rental often shows a tax loss while cash-flowing — sheltering income. Rental losses are passive: they offset passive income freely, and up to $25,000/yr can offset ordinary (W-2) income if you actively participate and your MAGI is under $100k (phasing out to $0 by $150k); unused losses carry forward. On sale, claimed depreciation is recaptured at up to 25%, and gains may owe capital-gains tax (a 1031 exchange can defer both). Figures are a year-1 estimate at your 24.0% rate — not tax advice; consult a CPA.
Condition & rehab AI · 3 photos
A moderate rehab project is needed to improve the exterior and landscaping, which would significantly enhance the property's resale and rental value.
Repairs flagged
- Minor Exterior paint — Light blue siding shows some discoloration
- Minor Landscaping — Some overgrown vegetation
Value-add opportunities
- Both Paint exterior — Enhances curb appeal and property value
- Both Landscaping — Improves curb appeal and property value
Renovation cost estimate screening
| Repair item | Severity | Est. cost |
|---|---|---|
| Exterior paint · Light blue siding shows some discoloration | Minor | $500–3,000 |
| Landscaping · Some overgrown vegetation | Minor | $500–3,000 |
| Total estimated repair cost · 2 items | $1,000–6,000 |
Value-add ROI direction
- Both Paint exterior — Enhances curb appeal and property value ↑
- Both Landscaping — Improves curb appeal and property value ↑
ⓘ Cost ranges are severity-bucket heuristics (US national rule-of-thumb). Get contractor quotes + a written scope before underwriting a rehab budget.
Schools (NCES district)
- District
- Shenandoah County Public School District
- NCES district ID
- 5103510
- Math proficiency
- 46% ▼ -30.00%
- Reading proficiency
- 58% ▼ -9.00%
- Median HH income
- $50,207
- Composite
- 44.42/100
- National rank
- #2811
- State rank
- #91 of 131 in VA
Livability — Edinburg
- Score
- 67/100
- State rank
- #294
- US rank
- #10446
Category grades
Schools grade is shown separately in the Schools card above.
Census & demographics
- Census place
- Edinburg, VA
- Population (ZIP)
- 6,061
Population outlook (Shenandoah County) Hauer SSP2
- Today (2025)
- 44,891 people
- By 2030
- 45,630 · +1.6%
- By 2040
- 46,708 · +4.0%
- By 2050
- 47,072 · +4.9%
- By 2075
- 47,418 · +5.6%
- By 2100
- 43,707 · -2.6%
Race, ethnicity, and origin ACS 2023
- Neighborhood character
- Predominantly White (85%)
- Race & ethnicity
- White 85% Hispanic / Latino 9% Two or more races 6% Black 3%
- Hispanic origin (detail)
- Mexican 6% Puerto Rican 2%
- Common ancestry
- Italian 9% Slovak 4% Iranian 2%
- Foreign-born
- 6% · Canada
- Languages at home
- 90% English-only · Spanish 8% French/Haitian/Cajun 1%
Political lean MEDSL · Shenandoah
- 2024 margin
- Solid R (+42.2) · D 28.4% · R 70.6% · Other 1.0%
- 2008→2024 swing
- -15.8pp toward R · 2008: -26.5pp · 2024: -42.2pp
- All cycles
- 2024: R+42.2 2020: R+40.6 2016: R+43.3 2012: R+31.4 2008: R+26.5
Not yet ingested
- Civics
- —
Market trends
- HPI YoY
- ▲ 27.98%
- Current HPI
- 342.2967
- Rent YoY
- —
- Metro
- —
- State GDP YoY
- ▲ 2.40%
- F500 in state
- 50
Industry mix (Fortune 500 HQ in VA)
| Industry | F500 HQs | Revenue |
|---|---|---|
| Aerospace / Defense | 4 | $236B |
|
||
| Technology / Defense | 3 | $32B |
|
||
| Financial Services | 2 | $176B |
|
||
| Utilities | 2 | $27B |
|
||
| Insurance | 2 | $25B |
|
||
| Technology | 2 | $15B |
|
||
Price history
+0.0% since first listed3 events — show timeline
- 2026-05-30 Pending — BRIGHT MLS
- 2026-05-01 Listed $325,000 BRIGHT MLS
- 2026-04-24 Coming Soon $325,000 BRIGHT MLS
Cash-flow waterfall
monthlySold comps — $/sqft
last 12 mo · ≤1 miLoading sold comps…