 14-Plex
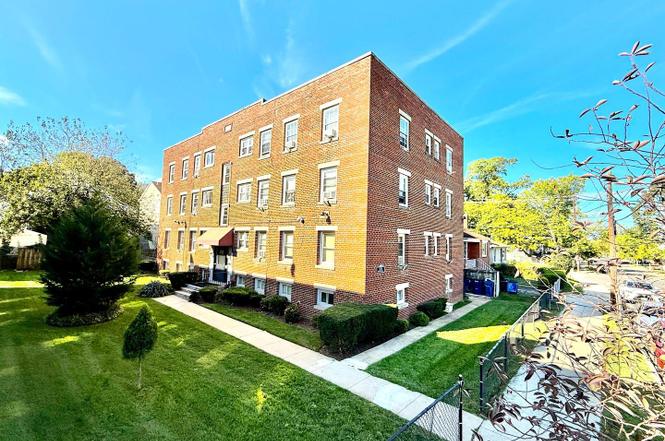
5111 Ayers Pl SE · Washington, DC
Flood risk 8/10 · Major
- FEMA flood zone
- X (unshaded)
- Chance of flooding over 30 yrs
- 0.99%
- Est. flood insurance / yr
- $473 – $860
Fire risk 1/10 · Minimal
- Est. fire insurance / yr
- $631 – $1,173
Heat risk 8/10 · Major
- Hot days now (above 103°F)
- 7 days/yr
- Hot days in 30 yrs
- 15 days/yr
Wind risk 4/10 · Minor
- Chance of severe wind over 30 yrs
- 20.0%
Air-quality risk 4/10 · Minor
- Unhealthy air days now
- 4 days/yr
- Unhealthy air days in 30 yrs
- 5 days/yr
Risk factors via First Street. Map © Google.
Why this score? — see what drove the B grade
The composite is a weighted blend of 9 inputs, each scored 0–100. Each bar is that input's sub-score; the figure is the points it added to the 100-point composite (weight × sub-score).
- Cash flow +30.0/30.0
- 1% rule +10.0/10.0
- DSCR +10.0/10.0
- ARV discount +7.5/15.0
- Rent growth +4.0/5.0
- Livability +3.7/5.0
- Schools +3.6/10.0
- Condition / age +2.5/5.0
- Appreciation +0.0/10.0
$1,295,000
🖨 Deal sheet (PDF) 📄 Offer letter ✓ Due diligence
Multi-family units
County records classify this as Multi-Family (5+ Unit). Listing-text estimate: 14 units. confirmed
5+ unit building — per-unit beds/baths from public records are typically unavailable; the breakdown below (if shown) is an estimate from the listing text.
Listing remarks MLS
* * * Great solid brick building few blocks from Ft Benning Metro and Maryland Line. * * * . Seller has the right to accept or reject all offers. * * * PRICE JUST REDUCED!!!!!!!!!Multiple offers. Please submit Best and final offer by this coming Sunday !!!!!!
Key facts
- 8,000 sq ft lot
- Built 1947
- Listed 154 days
Property features AI
Finance
- Other: Estimated above-grade finished area
- Financial info: Fee simple ownership; Ground rent paid annually; Land assessed value reported; Improvement assessed value reported
Exterior
- Parking: On-street parking
- Utilities: Public water; Public sewer; Natural gas hot water
- Home design: Detached property; 4 stories
- Construction: Brick construction; Block foundation; Estimated year built
- Exterior features: Above-grade additional structures
Interior
- Bedrooms: 13 one-bedroom units; 1 single-room unit
- Heating & cooling: Hot water and radiant heat; Oil-fired heating; Window air conditioning units (electric)
- Interior features: Full basement with daylight and partial exposures; Estimated living area
Neighborhood map
What this means for you Summary
Snapshot
- This is a 14 × 1-bed/1.0-bath units multifamily listed at $1.29M.
Deal economics
- At list price, monthly cash flow is $9k ($107k/yr) — positive. Per door: $637/mo.
- The deal already cash-flows at list — no discount required.
- Meets the 1% rule at list price ($22k rent vs $1.29M).
- Recommended offer: $1.14M (12.0% below list) — sets the bar for market timing.
- Cap rate 14.6% vs local median 2.5% in Washington — top-decile yield for the area; either an underpriced asset or a hidden risk that comps aren't pricing in. Stress-test before assuming the spread holds.
Location & tenants
- Location reads 73/100 on livability (#1 in DC) — a middle-class / working-renter tenant base. Strengths: amenities A+, commute A+, employment A+; Watch: crime F, cost of living F.
- District Of Columbia Public Schools (urban): math 33% / reading 40% proficiency, ranked #8 of 32 in DC (top 25%) — families likely to look elsewhere, expect single-tenant / working-renter base with shorter leases; 65% free/reduced lunch — lower-income household profile, screen leases tightly.
- Zoned schools: Capitol Hill Montessori School At Logan (424 students, 0% FRL); Kelly Miller Ms (351 students, 0% FRL); H.D. Woodson Hs (543 students, 0% FRL) — zoned schools average 0% FRL vs 65% district-wide (65 pts lower); this property's tenant base skews higher-income than the district average.
- Market conditions: Rents rising fast (+6.1%/yr); 281 active listings in the ZIP; 1,737 units permitted in District of Columbia in 2024 (1,506 in 5+ unit buildings).
Forward outlook
- Local home prices are declining (-3.0%/yr); year-one equity from $9k of loan paydown is wiped out by about $39k of value loss. Plan a longer hold.
- District of Columbia County population projected at +50% by 2050 — long-run rental-demand tailwind backs the buy-and-hold thesis.
- At projected returns (-3.0% appreciation + 6.1% rent growth), your $363k cash investment doubles in ~4 years — after that, you're playing with house money.
Negotiation context
- It's been on market 154 days — a 12% lower offer ($1.14M) is reasonable based on typical stale-listing flexibility.
- 8 sale attempts since 21y ago with the ask held roughly flat each time — persistent listings suggest the price (not the market) is what's stuck; bring a comps-based counter.
- Current owner paid $730k; list at $1.29M implies a 77% gain — meaningful room to come down on a strong offer.
Risks & watch-outs
- Watch-outs: flood insurance adds $56/mo; built in 1947 — expect roof / HVAC / electrical / plumbing capex.
- Climate carrying-cost: severe flood risk; extreme-heat days projected 7→15/yr by 2055 (HVAC capex compounding) — expect insurance premiums to compound above CPI over the hold.
Questions for the listing agent
- It's been on market 154 days. Have you received any prior offers? Is the seller open to a 12% concession, seller financing, or rate buy-down credit?
- Can we see the unit-by-unit rent roll, current vacancy, and any below-market leases? What's the average tenancy length?
- What capital expenditures (roof, boiler, parking lot, exteriors) have been made in the last 5 years, and what's planned in the next 2?
- Built in 1947 — when were the roof, HVAC, electrical panel, plumbing, and water heater last replaced?
- What's the actual annual flood-insurance premium (NFIP or private), and is the property in a SFHA with mandatory coverage?
- Why hasn't it sold? Are there any deal-killer items the seller is aware of (foundation, flood, title, zoning, code violations)?
- Is there a deadline driving the sale (1031 exchange, divorce, estate, relocation)? That informs how much negotiation room exists.
- Crime grade is F in this area — have there been break-ins, vandalism, or insurance claims at this property in the last 3 years? What carrier currently insures it and at what premium?
- What's the average days-on-market for RENTAL listings here right now (not sales)? A rising rental-DOM trend means longer vacancies and softer asking-rent achievability than the comps imply.
- What's the recent tenant-quality profile in this submarket — average credit score on applications, eviction rate, late-payment / NSF rate, and stable-employment percentage? A property-management company in the area should have these aggregated.
- How much new apartment / multifamily construction is in the pipeline within 1–3 miles? Heavy new supply (>2% of stock underway) typically softens rents 12–24 months out; light construction supports rent growth.
Investment metrics
- 1% rule
- 1.67% ✓
- Cap rate
- 14.61%
- Cash-on-cash
- 29.71%
- DSCR
- 2.32
- GRM
- 5.0
CMA / ARV
No comps found within radius.
Projected returns pro-forma
-3.0% appreciation · 6.06% rent growth · sell at horizon
- IRR
- 27.3%
- Equity multiple
- 2.18×
- Total profit
- $427,017
- Equity at exit
- $193,089
- IRR
- 36.5%
- Equity multiple
- 4.87×
- Total profit
- $1,403,653
- Equity at exit
- $111,968
Cash invested: $362,600 (down + closing). Projections, not guarantees.
Landlord ↔ Tenant lean methodology
- Overall (CITY)
- 0 Strongly Tenant-Friendly
- State District of Columbia
- 12 Strongly Tenant-Friendly · D+43
- County
- — inherits STATE
- City Washington
- 0 Strongly Tenant-Friendly · D+43
ZIP-level market 20019
- Rents YoY
- 6.1%
- Active inventory
- 281
- Price-to-rent
- 69.7×
Monthly cashflow live
- Estimated rent
- $21,687 high interval (Pro) →
- Mortgage (P&I)
- −$6,791
- Tax from tax record
- −$826 /mo · $9,908/yr
- Insurance
- −$540
- Flood insurance flood zone
- −$56 /mo · $666/yr
- HOA
- −$0
- Vacancy / Maint / Mgmt
- −$4,554
- Net cashflow
- $8,921
Break-even live
Sensitivity live
| Price | -10% $9,654 | -5% $9,287 | +0% $8,921 | +5% $8,554 | +10% $8,188 |
|---|---|---|---|---|---|
| Rent | -10% $7,208 | -5% $8,064 | +0% $8,921 | +5% $9,777 | +10% $10,634 |
| Rate | -1.0pp $9,573 | -0.5pp $9,250 | base $8,921 | +0.5pp $8,585 | +1.0pp $8,244 |
14-unit breakdown (identical units grouped — click to expand)
| Units | Beds | Baths | Est. rent |
|---|---|---|---|
| 14× units | 1 | 1 | $21,686 |
| #1 | 1 | 1 | $1,549 |
| #2 | 1 | 1 | $1,549 |
| #3 | 1 | 1 | $1,549 |
| #4 | 1 | 1 | $1,549 |
| #5 | 1 | 1 | $1,549 |
| #6 | 1 | 1 | $1,549 |
| #7 | 1 | 1 | $1,549 |
| #8 | 1 | 1 | $1,549 |
| #9 | 1 | 1 | $1,549 |
| #10 | 1 | 1 | $1,549 |
| #11 | 1 | 1 | $1,549 |
| #12 | 1 | 1 | $1,549 |
| #13 | 1 | 1 | $1,549 |
| #14 | 1 | 1 | $1,549 |
| Total (14 units) | $21,687 | ||
UW: 25.0% down · 7.5% · 30yr · 1.5% tax · 5.0% vac · 8.0% maint · 8.0% mgmt
Financing live
Cash to close
- Down payment
- $323,750
- Closing costs
- $38,850
- Reserves months
- —
- Total cash needed
- —
Loan-product check · same deal, 3 products live
Conventional
25% down · 7.5% · 30yr
- Down + closing
- —
- Monthly P&I
- —
- Monthly cashflow
- —
- DSCR
- —
- Eligible?
- —
Personal DTI + credit; lowest rate.
DSCR
20% down · 8.5% · 30yr
- Down + closing
- —
- Monthly P&I
- —
- Monthly cashflow
- —
- DSCR
- —
- Eligible?
- —
No personal income docs; deal must DSCR.
Hard money
10% down · 12.0% · 12mo
- Down + closing
- —
- Monthly P&I
- —
- Monthly cashflow
- —
- DSCR
- —
- Eligible?
- —
Short-term bridge; refi at stabilization.
Listing history 37 events
-
2026-06-21days on market $1,295,000 Active 154 DOM
-
2026-06-18days on market $1,295,000 Active 151 DOM
-
2026-06-17days on market $1,295,000 Active 150 DOM
-
2026-06-16days on market $1,295,000 Active 149 DOM
-
2026-06-15days on market $1,295,000 Active 148 DOM
-
2026-06-13days on market $1,295,000 Active 146 DOM
-
2026-06-09days on market $1,295,000 Active 142 DOM
-
2026-06-08days on market $1,295,000 Active 141 DOM
-
2026-06-07days on market $1,295,000 Active 140 DOM
-
2026-06-04days on market $1,295,000 Active 137 DOM
-
2026-06-03days on market $1,295,000 Active 136 DOM
-
2026-06-02days on market $1,295,000 Active 135 DOM
-
2026-06-01days on market $1,295,000 Active 134 DOM
-
2026-05-31days on market $1,295,000 Active 133 DOM
-
2026-01-18$1,295,000 Active
-
2012-05-09soldstatus $730,000
-
2012-04-30soldstatus $730,000 267-char remark
Show marketing remark (267 chars)
* * * Great solid brick building few blocks from Ft Benning Metro and Maryland Line. * * * . Seller has the right to accept or reject all offers. * * * PRICE JUST REDUCED!!!!!!!!!Multiple offers. Please submit Best and final offer by this coming Sunday !!!!!!
-
2012-04-30soldstatus $730,000 Sold 267-char remark
Show marketing remark (267 chars)
* * * Great solid brick building few blocks from Ft Benning Metro and Maryland Line. * * * . Seller has the right to accept or reject all offers. * * * PRICE JUST REDUCED!!!!!!!!!Multiple offers. Please submit Best and final offer by this coming Sunday !!!!!!
-
2012-03-07status Contract 267-char remark
Show marketing remark (267 chars)
* * * Great solid brick building few blocks from Ft Benning Metro and Maryland Line. * * * . Seller has the right to accept or reject all offers. * * * PRICE JUST REDUCED!!!!!!!!!Multiple offers. Please submit Best and final offer by this coming Sunday !!!!!!
-
2012-03-05historical 267-char remark
Show marketing remark (267 chars)
* * * Great solid brick building few blocks from Ft Benning Metro and Maryland Line. * * * . Seller has the right to accept or reject all offers. * * * PRICE JUST REDUCED!!!!!!!!!Multiple offers. Please submit Best and final offer by this coming Sunday !!!!!!
-
2012-02-24status Active 267-char remark
Show marketing remark (267 chars)
* * * Great solid brick building few blocks from Ft Benning Metro and Maryland Line. * * * . Seller has the right to accept or reject all offers. * * * PRICE JUST REDUCED!!!!!!!!!Multiple offers. Please submit Best and final offer by this coming Sunday !!!!!!
-
2012-02-08historical Contingent (Kick Out) 267-char remark
Show marketing remark (267 chars)
* * * Great solid brick building few blocks from Ft Benning Metro and Maryland Line. * * * . Seller has the right to accept or reject all offers. * * * PRICE JUST REDUCED!!!!!!!!!Multiple offers. Please submit Best and final offer by this coming Sunday !!!!!!
-
2012-01-27status Active 267-char remark
Show marketing remark (267 chars)
* * * Great solid brick building few blocks from Ft Benning Metro and Maryland Line. * * * . Seller has the right to accept or reject all offers. * * * PRICE JUST REDUCED!!!!!!!!!Multiple offers. Please submit Best and final offer by this coming Sunday !!!!!!
-
2012-01-26historical Temporarily Off-Market 267-char remark
Show marketing remark (267 chars)
* * * Great solid brick building few blocks from Ft Benning Metro and Maryland Line. * * * . Seller has the right to accept or reject all offers. * * * PRICE JUST REDUCED!!!!!!!!!Multiple offers. Please submit Best and final offer by this coming Sunday !!!!!!
-
2011-11-23price $749,000 267-char remark
Show marketing remark (267 chars)
* * * Great solid brick building few blocks from Ft Benning Metro and Maryland Line. * * * . Seller has the right to accept or reject all offers. * * * PRICE JUST REDUCED!!!!!!!!!Multiple offers. Please submit Best and final offer by this coming Sunday !!!!!!
-
2011-10-27$799,000 Active 267-char remark
Show marketing remark (267 chars)
* * * Great solid brick building few blocks from Ft Benning Metro and Maryland Line. * * * . Seller has the right to accept or reject all offers. * * * PRICE JUST REDUCED!!!!!!!!!Multiple offers. Please submit Best and final offer by this coming Sunday !!!!!!
-
2011-10-27$749,000 267-char remark
Show marketing remark (267 chars)
* * * Great solid brick building few blocks from Ft Benning Metro and Maryland Line. * * * . Seller has the right to accept or reject all offers. * * * PRICE JUST REDUCED!!!!!!!!!Multiple offers. Please submit Best and final offer by this coming Sunday !!!!!!
-
2009-04-20
-
2009-04-20historical
-
2007-08-24historical
-
2007-05-10
-
2005-10-12soldstatus $750,000
-
2005-09-15soldstatus $750,000
-
2005-04-03historical
-
2005-03-29$700,000
-
1989-10-27soldstatus $155,000
-
1986-12-24soldstatus $4,871,550
ⓘ Source: listings_history table (triggers on properties + properties_extension) + one-shot
backfill from property_details.listing_events for pre-trigger history.
Tax reassessment forecast DC · Partial reset (capped growth)
- Current annual tax
- $9,908 · $826/mo
- Projected year-2 tax
- $9,908 · $826/mo
- Expected delta
- $0/yr ($0/mo · 0.0%)
ⓘ Screening estimate from a state-policy table — verify with the county assessor before closing.
Climate risk First Street
- Flood 8/10 Severe FEMA zone X (unshaded) · 99% chance over 30 yrs
- Wildfire 1/10 Low
- Heat 8/10 Severe 7 d/yr ≥103°F today · 15 d/yr by 30 yrs out
- Wind 4/10 Moderate 20% chance of damaging wind over 30 yrs
- Air quality 4/10 Moderate 4 unhealthy d/yr today · 5 by 30 yrs out
Nearby sold comps map
Loading sold comps map…
Walkable amenities ~0.75 mi
Loading nearby amenities…
Taxation est. · year 1
- Rental income
- $260,244
- − Mortgage interest
- −$72,540
- − Property taxes
- −$9,908
- − Insurance
- −$7,142
- − Repairs & maintenance
- −$20,820
- − Management
- −$20,820
- − Depreciation
- −$37,673
- Taxable income
- $91,343
- Est. tax owed @ 24.0%
- −$21,922
- After-tax cash flow
- $85,128/yr
For passive investors: Depreciation is non-cash, so a rental often shows a tax loss while cash-flowing — sheltering income. Rental losses are passive: they offset passive income freely, and up to $25,000/yr can offset ordinary (W-2) income if you actively participate and your MAGI is under $100k (phasing out to $0 by $150k); unused losses carry forward. On sale, claimed depreciation is recaptured at up to 25%, and gains may owe capital-gains tax (a 1031 exchange can defer both). Figures are a year-1 estimate at your 24.0% rate — not tax advice; consult a CPA.
Schools (NCES district)
- District
- District Of Columbia Public Schools
- NCES district ID
- 1100030
- Math proficiency
- 33% ▲ 3.00%
- Reading proficiency
- 40% ▲ 5.00%
- Median HH income
- $67,671
- Composite
- 35.84/100
- National rank
- #9606
- State rank
- #8 of 32 in DC
Livability — Washington
- Score
- 73/100
- State rank
- #1
- US rank
- #5327
Category grades
Schools grade is shown separately in the Schools card above.
Census & demographics
- Census place
- Washington, DC
- County
- District of Columbia · 671,873 people
- City population
- 671,873
- Metro
- Washington-Arlington-Alexandria, DC-VA-MD-WV
- Population (ZIP)
- 63,380
- Household income
- $58,296
- Rent vs Own
- Severe rent burden
- 5115.0
Population outlook (District of Columbia County) Hauer SSP2
- Today (2025)
- 821,926 people
- By 2030
- 899,517 · +9.4%
- By 2040
- 1,061,162 · +29.1%
- By 2050
- 1,231,493 · +49.8%
- By 2075
- 1,603,312 · +95.1%
- By 2100
- 1,847,141 · +124.7%
Race, ethnicity, and origin ACS 2023
- Neighborhood character
- Predominantly Black (87%)
- Race & ethnicity
- Black 87% Hispanic / Latino 7% Two or more races 4% White 2%
- Hispanic origin (detail)
- Mexican 1% Dominican 1%
- Foreign-born
- 6% · Canada
- Languages at home
- 91% English-only · Spanish 6% French/Haitian/Cajun 1%
Political lean MEDSL · District of Columbia
- 2024 margin
- Solid D (+86.1) · D 91.2% · R 5.1% · Other 3.8%
- 2008→2024 swing
- +0.1pp no change · 2008: 85.9pp · 2024: 86.1pp
- All cycles
- 2024: D+86.1 2020: D+86.8 2016: D+88.7 2012: D+84.2 2008: D+85.9
Not yet ingested
- Civics
- —
Market trends
- HPI YoY
- ▼ -416.91%
- Current HPI
- 326.4481
- Rent YoY
- ▲ 6.06%
- Metro
- Washington-Arlington-Alexandria, DC-VA-MD-WV
- State GDP YoY
- ▲ 1.33%
- F500 in state
- 6
Industry mix (Fortune 500 HQ in DC)
| Industry | F500 HQs | Revenue |
|---|---|---|
| Financial Services | 1 | $153B |
|
||
| Life Sciences / Industrials | 1 | $25B |
|
||
| Industrial Machinery | 1 | $8B |
|
||
Price history
-73.4% since first listed23 events — show timeline
- 2026-01-18 Listed $1,295,000 BRIGHT MLS
- 2012-05-09 Sold (Public Records) $730,000 Public Records
- 2012-04-30 Sold (MLS) $730,000 MRIS
- 2012-04-30 Sold (MLS) $730,000 BRIGHT MLS
- 2012-03-07 Pending — MRIS
- 2012-03-05 Listing Removed — BRIGHT MLS
- 2012-02-24 Relisted — MRIS
- 2012-02-08 Contingent — MRIS
- 2012-01-27 Relisted — MRIS
- 2012-01-26 Delisted — MRIS
- 2011-11-23 Price Changed $749,000 MRIS
- 2011-10-27 Listed $799,000 MRIS
- 2011-10-27 Listed $749,000 BRIGHT MLS
- 2009-04-20 Delisted — MRIS
- 2009-04-20 Listed — MRIS
- 2007-08-24 Delisted — MRIS
- 2007-05-10 Listed — MRIS
- 2005-10-12 Sold (Public Records) $750,000 Public Records
- 2005-09-15 Sold (MLS) $750,000 MRIS
- 2005-04-03 Delisted — MRIS
- 2005-03-29 Listed $700,000 MRIS
- 1989-10-27 Sold (Public Records) $155,000 Public Records
- 1986-12-24 Sold (Public Records) $4,871,550 Public Records
Property tax history
+1.3%/yrLatest (2025): $9,908 · -12.0% YoY. Source: county tax records.
Cash-flow waterfall
monthlySold comps — $/sqft
last 12 mo · ≤1 miLoading sold comps…