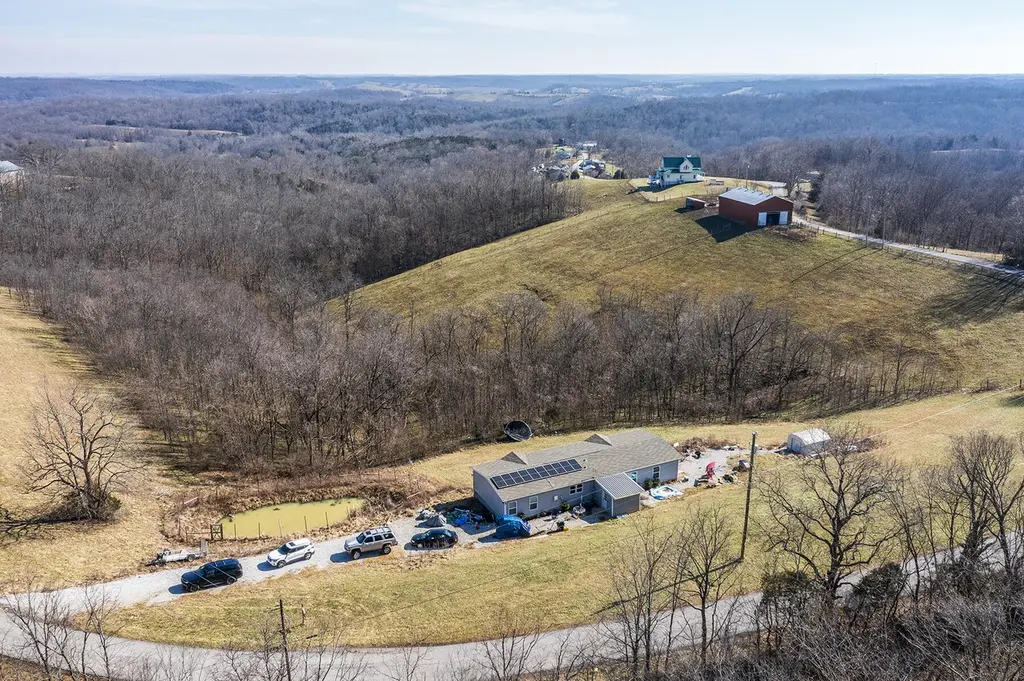
3820 Stoney Creek Rd · Carlisle, KY
Flood risk 1/10 · Minimal
- FEMA flood zone
- X (unshaded)
- Chance of flooding over 30 yrs
- 0.0%
- Est. flood insurance / yr
- $507 – $1,088
Fire risk 4/10 · Minor
- Est. fire insurance / yr
- $839 – $1,559
Heat risk 4/10 · Minor
- Hot days now (above 102°F)
- 7 days/yr
- Hot days in 30 yrs
- 18 days/yr
Wind risk 2/10 · Minimal
- Chance of severe wind over 30 yrs
- 2.0%
Air-quality risk 2/10 · Minimal
- Unhealthy air days now
- 0 days/yr
- Unhealthy air days in 30 yrs
- 1 days/yr
Risk factors via First Street. Map © Google.
Why this score? — see what drove the D- grade
The composite is a weighted blend of 9 inputs, each scored 0–100. Each bar is that input's sub-score; the figure is the points it added to the 100-point composite (weight × sub-score).
- ARV discount +13.9/15.0
- Appreciation +10.0/10.0
- Cash flow +4.3/30.0
- Livability +3.1/5.0
- Rent growth +2.5/5.0
- Condition / age +2.5/5.0
- Schools +2.3/10.0
- 1% rule +0.0/10.0
- DSCR +0.0/10.0
$299,900
🖨 Deal sheet 📄 Offer letter ✓ Due diligence
Key facts
- 6.41 acre lot
- Built 2021
- Listed 42 days
Property features AI
Finance
- Other: Lot size about 6.409 acres (assessor)
Exterior
- Parking: Driveway
- Utilities: Sewer: Lagoon system
- Home design: Manufactured home; One story
- Construction: Vinyl siding exterior; Shingle roof; Block foundation; Total building area approximately 2,016
- Exterior features: Public water; Not waterfront
Interior
- Kitchen: Dishwasher; Refrigerator; Range
- Bedrooms: 2 total rooms (includes bedrooms and living areas)
- Flooring: Laminate flooring
- Bathrooms: 2 full bathrooms
- Heating & cooling: Heat pump for heating and cooling
- Interior features: Breakfast bar; Primary bedroom on the first floor; Fireplace
- Laundry & utility: Laundry on the main level
Neighborhood map
What this means for you Summary
Snapshot
- This is a 4-bed/2.0-bath other listed at $300k.
Deal economics
- At list price, monthly cash flow is $-793 ($-10k/yr) — negative.
- To cash-flow at today's rent, offer at most $160k (46.7% below list).
- To meet the 1% rule (rent ≥ 1% of price), the offer needs to be $135k (54.9% below list).
- Recommended offer: $135k (54.9% below list) — sets the bar for 1% rule.
Location & tenants
- Location reads 62/100 on livability (#349 in KY) — a middle-class / working-renter tenant base. Strengths: crime A+, cost of living A+, housing A+; Watch: amenities F, commute F, employment F.
- Nicholas County (rural): math 22% / reading 32% proficiency, ranked #132 of 165 in KY (top 80%) — low school quality limits family demand, transient renter base, plan for 1-2y turnover.
- Zoned schools: Nicholas County Elementary School (math 22% / reading 29%, grade F, #477 of 676 statewide, top 71%, 664 students, 71% FRL); Nicholas County High School (math 22% / reading 37%, grade F, #127 of 254 statewide, top 58%, 455 students, 63% FRL) — zoned schools average 67% FRL vs 50% district-wide (17 pts higher); higher-poverty schools than district average — tighter screening recommended.
- Market conditions: 51 active listings in the ZIP; 2 units permitted in Nicholas County in 2024 (0 in 5+ unit buildings).
Forward outlook
- In year one you build about $32k of equity ($2k loan paydown + $30k appreciation (10.0% local appreciation)).
- Nicholas County population projected at -12% by 2050 — secular population decline; favor cash flow + early exit over multi-decade hold.
- By year 2, paydown + projected appreciation supports a ~$52k cash-out refi (75% LTV) — recoverable capital for the next deal without selling this one.
Negotiation context
- It's been on market 42 days — a 3% lower offer ($291k) is reasonable based on typical stale-listing flexibility.
- Current owner paid $21k; list at $300k implies a 1342% gain — meaningful room to come down on a strong offer.
Questions for the listing agent
- What do current leases actually rent for vs. the listed asking? Can we see a recent rent roll and the last 12 months of T-12 income?
- It's been on market 42 days. Have you received any prior offers? Is the seller open to a 55% concession, seller financing, or rate buy-down credit?
- Is there a deadline driving the sale (1031 exchange, divorce, estate, relocation)? That informs how much negotiation room exists.
- Schools are D-rated, which usually means shorter tenancies and higher turnover. Who's the typical renter profile here, and what's been the actual vacancy rate?
- The area grade is low — what's the realistic commute time and amenity access for the typical tenant pool here? Any planned neighborhood developments (good or bad) we should know about?
- What's the average days-on-market for RENTAL listings here right now (not sales)? A rising rental-DOM trend means longer vacancies and softer asking-rent achievability than the comps imply.
- What's the recent tenant-quality profile in this submarket — average credit score on applications, eviction rate, late-payment / NSF rate, and stable-employment percentage? A property-management company in the area should have these aggregated.
- How much new for-sale + rental construction is in the pipeline within 1–3 miles? Heavy new supply typically softens prices + rents 12–24 months out; constrained supply supports both.
Investment metrics
- 1% rule
- 0.45% ✗
- Cap rate
- 3.12%
- Cash-on-cash
- -11.34%
- DSCR
- 0.50
- GRM
- 18.5
CMA / ARV
- ARV (median comp)
- $349,441
- List price
- $299,900
- Delta
- -14.18%
- Verdict
- UNDERPRICED
- Comps
- 2 within 2.0 mi
Projected returns pro-forma
10.0% appreciation · 3.0% rent growth · sell at horizon
- IRR
- 16.3%
- Equity multiple
- 2.34×
- Total profit
- $112,687
- Equity at exit
- $270,174
- IRR
- 15.6%
- Equity multiple
- 5.42×
- Total profit
- $371,368
- Equity at exit
- $582,640
Cash invested: $83,972 (down + closing). Projections, not guarantees.
Landlord ↔ Tenant lean methodology
- Overall (STATE)
- 83 Strongly Landlord-Friendly
- State Kentucky
- 83 Strongly Landlord-Friendly · R+16
- County
- — inherits STATE
- City
- — inherits STATE
ZIP-level market 40311
- Home prices YoY
- 6.3%
- Active inventory
- 51
- Price-to-rent
- 18.5×
Monthly cashflow live
- Estimated rent
- $1,351 medium interval (Pro) →
- Mortgage (P&I)
- −$1,573
- Tax from tax record
- −$163 /mo · $1,962/yr
- Insurance
- −$125
- HOA
- −$0
- Vacancy / Maint / Mgmt
- −$284
- Net cashflow
- $-793
Break-even live
UW: 25.0% down · 7.5% · 30yr · 1.5% tax · 5.0% vac · 8.0% maint · 8.0% mgmt
Financing live
Cash to close
- Down payment
- $74,975
- Closing costs
- $8,997
- Reserves months
- —
- Total cash needed
- —
Loan-product check · same deal, 3 products live
Conventional
25% down · 7.5% · 30yr
- Down + closing
- —
- Monthly P&I
- —
- Monthly cashflow
- —
- DSCR
- —
- Eligible?
- —
Personal DTI + credit; lowest rate.
DSCR
20% down · 8.5% · 30yr
- Down + closing
- —
- Monthly P&I
- —
- Monthly cashflow
- —
- DSCR
- —
- Eligible?
- —
No personal income docs; deal must DSCR.
Hard money
10% down · 12.0% · 12mo
- Down + closing
- —
- Monthly P&I
- —
- Monthly cashflow
- —
- DSCR
- —
- Eligible?
- —
Short-term bridge; refi at stabilization.
Listing history 18 events
-
2026-06-18days on market $299,900 Active 42 DOM
-
2026-06-17days on market $299,900 Active 41 DOM
-
2026-06-16days on market $299,900 Active 40 DOM
-
2026-06-15days on market $299,900 Active 39 DOM
-
2026-06-14days on market $299,900 Active 37 DOM
-
2026-06-10days on market $299,900 Active 34 DOM
-
2026-06-09days on market $299,900 Active 33 DOM
-
2026-06-08days on market $299,900 Active 32 DOM
-
2026-06-07days on market $299,900 Active 31 DOM
-
2026-06-05days on market $299,900 Active 28 DOM
-
2026-06-03pricedays on market $299,900 Active 27 DOM
-
2026-06-02days on market $325,000 Active 26 DOM
-
2026-06-01days on market $325,000 Active 25 DOM
-
2026-05-31days on market $325,000 Active 24 DOM
-
2026-05-31days on market $325,000 Active 23 DOM
-
2026-05-07$325,000 Active
-
2021-06-25soldstatus $20,800
-
2006-01-18soldstatus $11,900
ⓘ Source: listings_history table (triggers on properties + properties_extension) + one-shot
backfill from property_details.listing_events for pre-trigger history.
Tax reassessment forecast KY · Resets to sale price
- Current annual tax
- $1,962 · $163/mo
- Projected year-2 tax
- $2,579 · $215/mo
- Expected delta
- +$617/yr (+$51/mo · 31.5%)
ⓘ Screening estimate from a state-policy table — verify with the county assessor before closing.
Climate risk First Street
- Flood 1/10 Low FEMA zone X (unshaded) · 0% chance over 30 yrs
- Wildfire 4/10 Moderate
- Heat 4/10 Moderate 7 d/yr ≥102°F today · 18 d/yr by 30 yrs out
- Wind 2/10 Low 2% chance of damaging wind over 30 yrs
- Air quality 2/10 Low 0 unhealthy d/yr today · 1 by 30 yrs out
Nearby sold comps map
Loading sold comps map…
Walkable amenities ~0.75 mi
Loading nearby amenities…
Taxation est. · year 1
- Rental income
- $16,218
- − Mortgage interest
- −$16,799
- − Property taxes
- −$1,962
- − Insurance
- −$1,500
- − Repairs & maintenance
- −$1,297
- − Management
- −$1,297
- − Depreciation
- −$8,724
- Taxable loss
- −$15,362
- Est. tax savings @ 24.0%
- +$3,687
- After-tax cash flow
- $-5,835/yr
For passive investors: Depreciation is non-cash, so a rental often shows a tax loss while cash-flowing — sheltering income. Rental losses are passive: they offset passive income freely, and up to $25,000/yr can offset ordinary (W-2) income if you actively participate and your MAGI is under $100k (phasing out to $0 by $150k); unused losses carry forward. On sale, claimed depreciation is recaptured at up to 25%, and gains may owe capital-gains tax (a 1031 exchange can defer both). Figures are a year-1 estimate at your 24.0% rate — not tax advice; consult a CPA.
Schools (NCES district)
- District
- Nicholas County
- NCES district ID
- 2104470
- Math proficiency
- 22% ▼ -22.00%
- Reading proficiency
- 32% ▼ -17.00%
- Median HH income
- $39,178
- Composite
- 22.65/100
- National rank
- #8056
- State rank
- #132 of 165 in KY
Livability — Carlisle
- Score
- 62/100
- State rank
- #349
- US rank
- #16526
Category grades
Schools grade is shown separately in the Schools card above.
Census & demographics
- Population (ZIP)
- 7,676
Population outlook (Nicholas County) Hauer SSP2
- Today (2025)
- 6,953 people
- By 2030
- 6,815 · -2.0%
- By 2040
- 6,489 · -6.7%
- By 2050
- 6,119 · -12.0%
- By 2075
- 5,449 · -21.6%
- By 2100
- 4,901 · -29.5%
Race, ethnicity, and origin ACS 2023
- Neighborhood character
- Predominantly White (96%)
- Race & ethnicity
- White 96% Two or more races 2% Hispanic / Latino 1%
- Common ancestry
- Iranian 2% Lithuanian 2% Slovak 1%
- Foreign-born
- 0% · Canada
- Languages at home
- 99% English-only · Spanish 1% German/W. Germanic 1%
Political lean MEDSL · Nicholas
- 2024 margin
- Solid R (+49.0) · D 24.8% · R 73.8% · Other 1.3%
- 2008→2024 swing
- -36.8pp toward R · 2008: -12.2pp · 2024: -49.0pp
- All cycles
- 2024: R+49.0 2020: R+42.8 2016: R+41.2 2012: R+24.6 2008: R+12.2
Not yet ingested
- Civics
- —
Market trends
- HPI YoY
- ▲ 16.72%
- Current HPI
- 282.0093
- Rent YoY
- —
- Metro
- —
- State GDP YoY
- ▲ 1.81%
- F500 in state
- 4
Industry mix (Fortune 500 HQ in KY)
| Industry | F500 HQs | Revenue |
|---|---|---|
| Healthcare | 1 | $118B |
|
||
| Food / Beverage | 1 | $7B |
|
||
Price history
+2420.2% since first listed4 events — show timeline
- 2026-06-03 Price Changed $299,900 ImagineMLS
- 2026-05-07 Listed $325,000 ImagineMLS
- 2021-06-25 Sold (Public Records) $20,800 Public Records
- 2006-01-18 Sold (Public Records) $11,900 Public Records
Property tax history
+22.4%/yrLatest (2025): $1,962 · -0.9% YoY. Source: county tax records.
Cash-flow waterfall
monthlySold comps — $/sqft
last 12 mo · ≤1 miLoading sold comps…