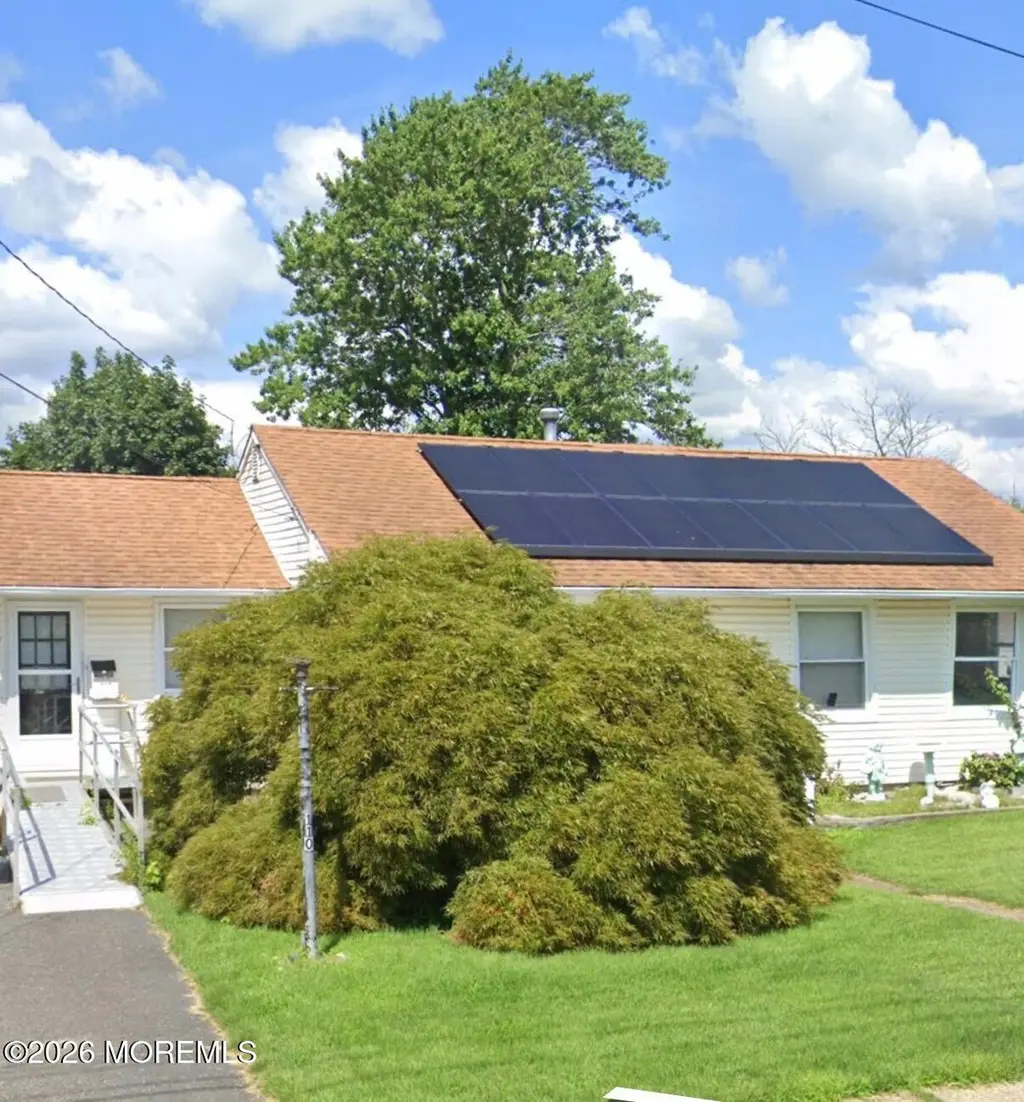
110 Dewey St · Toms River, NJ
Flood risk 1/10 · Minimal
- FEMA flood zone
- X (unshaded)
- Chance of flooding over 30 yrs
- 0.0%
- Est. flood insurance / yr
- $507 – $1,088
Fire risk 1/10 · Minimal
- Est. fire insurance / yr
- $526 – $976
Heat risk 7/10 · Major
- Hot days now (above 100°F)
- 7 days/yr
- Hot days in 30 yrs
- 15 days/yr
Wind risk 6/10 · Moderate
- Chance of severe wind over 30 yrs
- 72.0%
Air-quality risk 3/10 · Minor
- Unhealthy air days now
- 3 days/yr
- Unhealthy air days in 30 yrs
- 4 days/yr
Risk factors via First Street. Map © Google.
Why this score? — see what drove the C- grade
The composite is a weighted blend of 9 inputs, each scored 0–100. Each bar is that input's sub-score; the figure is the points it added to the 100-point composite (weight × sub-score).
- ARV discount +15.0/15.0
- Cash flow +14.9/30.0
- DSCR +4.6/10.0
- 1% rule +4.2/10.0
- Livability +4.0/5.0
- Rent growth +2.9/5.0
- Schools +2.9/10.0
- Condition / age +2.5/5.0
- Appreciation +0.0/10.0
$349,900
🖨 Deal sheet (PDF) 📄 Offer letter ✓ Due diligence
Listing remarks
CALLING ALL INVESTORS! Amazing opportunity in highly sought after neighborhood in Toms River! Transform this property into your next profitable project or enjoy your life there! This one has serious paradise potential. 2 bedrooms with a bonus room, large living room, den & huge kitchen. Just bring your vision and make it shine! Backyard photos are from last year.
Key facts
- Bonus room
- Large living room
- Huge kitchen
Tags
Neighborhood map
What this means for you Summary
Snapshot
- This is a 3-bed/1.0-bath single-family listed at $350k.
Deal economics
- At list price, monthly cash flow is $106 ($1k/yr) — positive.
- The deal already cash-flows at list — no discount required.
- To meet the 1% rule (rent ≥ 1% of price), the offer needs to be $322k (8.0% below list).
- Recommended offer: $322k (8.0% below list) — sets the bar for 1% rule.
- Cap rate 6.7% vs local median 3.8% in Toms River — top-decile yield for the area; either an underpriced asset or a hidden risk that comps aren't pricing in. Stress-test before assuming the spread holds.
Location & tenants
- Location reads 81/100 on livability (#61 in NJ, #1,538 nationally) — a professional / high-income tenant draw. Strengths: employment A+, housing A+, health & safety A+; Watch: commute D, cost of living F.
- Toms River Regional School District (suburban): math 18% / reading 44% proficiency, ranked #316 of 472 in NJ (top 67%) — families likely to look elsewhere, expect single-tenant / working-renter base with shorter leases.
- Zoned schools: Washington Street Elementary School (math 17% / reading 52%, grade F, #582 of 1,303 statewide, top 49%, 314 students, 33% FRL); Toms River Intermediate School South (math 15% / reading 43%, grade F, #321 of 431 statewide, top 77%, 1,048 students, 36% FRL); Toms River High School South (math 18% / reading 43%, grade F, #279 of 399 statewide, top 71%, 1,359 students, 27% FRL).
- Market conditions: Rents rising (+1.5%/yr); 435 active listings in the ZIP; 7 comparable units currently listed for rent nearby; rentals leasing fast (median 5d on market — plan ~1-2 weeks tenant-placement turnaround); solid renter incomes; 4,434 units permitted in Ocean County in 2024 (868 in 5+ unit buildings).
- This rent runs 37% of the median local income ($105k/yr) — at the standard rent-burdened threshold; future hikes will face affordability resistance.
Forward outlook
- Local home prices are declining (-3.0%/yr); year-one equity from $2k of loan paydown is wiped out by about $10k of value loss. Plan a longer hold.
- Ocean County population projected to shrink 8% by 2050 — rents likely to lag national; underwrite the cash flow, not the appreciation.
Negotiation context
- Only 9 days on market — expect competitive offers; lowballing is unlikely to land.
Risks & watch-outs
- Watch-outs: built in 1953 — expect roof / HVAC / electrical / plumbing capex.
- Climate carrying-cost: major wind risk, 72% chance of damaging wind over 30y; extreme-heat days projected 7→15/yr by 2055 (HVAC capex compounding) — expect insurance premiums to compound above CPI over the hold.
Questions for the listing agent
- Built in 1953 — when were the roof, HVAC, electrical panel, plumbing, and water heater last replaced?
- Is there a deadline driving the sale (1031 exchange, divorce, estate, relocation)? That informs how much negotiation room exists.
- What's the average days-on-market for RENTAL listings here right now (not sales)? A rising rental-DOM trend means longer vacancies and softer asking-rent achievability than the comps imply.
- What's the recent tenant-quality profile in this submarket — average credit score on applications, eviction rate, late-payment / NSF rate, and stable-employment percentage? A property-management company in the area should have these aggregated.
- How much new for-sale + rental construction is in the pipeline within 1–3 miles? Heavy new supply typically softens prices + rents 12–24 months out; constrained supply supports both.
Investment metrics
- 1% rule
- 0.92% ✗
- Cap rate
- 6.65%
- Cash-on-cash
- 1.29%
- DSCR
- 1.06
- GRM
- 9.1
CMA / ARV
- ARV (on-the-fly)
- $516,168
- Comps found
- 12
Show comp detail 12 sales within ~0.75 mi
| Address | Dist | Beds/Ba | Sqft | Sold | Price | $/sf | Match |
|---|---|---|---|---|---|---|---|
| 110 Dewey St | 0.00mi | 2/2.0 (-1) | 1,608 (0%) | 0mo | $372,500 | $232 | 91 |
| 18 N Central Ave | 0.61mi | 3/1.0 | 1,604 (-0%) | 2mo | $450,000 | $281 | 70 |
| 543 Hollywood Ave | 0.48mi | 3/2.5 | 1,617 (+1%) | 3mo | $510,000 | $315 | 68 |
| 29 Terrace Ave | 0.47mi | 3/3.0 | 1,639 (+2%) | 2mo | $562,500 | $343 | 65 |
| 55 Grand Ave | 0.14mi | 3/2.5 | 1,784 (+11%) | 5mo | $610,000 | $342 | 65 |
| 31 East Dr | 0.56mi | 3/1.5 | 1,495 (-7%) | 1mo | $515,000 | $344 | 59 |
| 16 Field St | 0.47mi | 4/2.0 (+1) | 1,534 (-5%) | 7mo | $450,000 | $293 | 56 |
| 586 Peter Ave | 0.70mi | 3/1.5 | 1,500 (-7%) | 1mo | $500,000 | $333 | 54 |
| 636 Hill Rd | 0.57mi | 4/3.0 (+1) | 1,711 (+6%) | 3mo | $549,900 | $321 | 47 |
| 24 Melrose Dr | 0.56mi | 4/3.0 (+1) | 1,713 (+6%) | 4mo | $610,000 | $356 | 46 |
| 938 Wright Ave | 0.60mi | 4/2.0 (+1) | 1,404 (-13%) | 6mo | $450,000 | $321 | 37 |
| 219 Hyers St | 0.72mi | 4/2.0 (+1) | 1,368 (-15%) | 5mo | $422,000 | $308 | 28 |
Match score weights: distance 35% · size 25% · config 20% · recency 20%. Top-matched comps best support the ARV.
Projected returns pro-forma
-3.0% appreciation · 1.49% rent growth · sell at horizon
- IRR
- -15.9%
- Equity multiple
- 0.44×
- Total profit
- $-54,737
- Equity at exit
- $52,171
- IRR
- -10.4%
- Equity multiple
- 0.41×
- Total profit
- $-57,948
- Equity at exit
- $30,253
Cash invested: $97,972 (down + closing). Projections, not guarantees.
Landlord ↔ Tenant lean methodology
- Overall (STATE)
- 21 Tenant-Leaning
- State New Jersey
- 21 Tenant-Leaning · D+6
- County
- — inherits STATE
- City
- — inherits STATE
ZIP-level market 08753
- Rents YoY
- 1.5%
- Active inventory
- 435
- Price-to-rent
- 9.1×
Monthly cashflow live
- Estimated rent
- $3,220 high interval (Pro) →
- Mortgage (P&I)
- −$1,835
- Tax from tax record
- −$458 /mo · $5,491/yr
- Insurance
- −$146
- HOA
- −$0
- Vacancy / Maint / Mgmt
- −$676
- Net cashflow
- $106
Break-even live
Sensitivity live
| Price | -10% $304 | -5% $205 | +0% $106 | +5% $6 | +10% $-93 |
|---|---|---|---|---|---|
| Rent | -10% $-149 | -5% $-22 | +0% $106 | +5% $233 | +10% $360 |
| Rate | -1.0pp $282 | -0.5pp $195 | base $106 | +0.5pp $15 | +1.0pp $-77 |
UW: 25.0% down · 7.5% · 30yr · 1.5% tax · 5.0% vac · 8.0% maint · 8.0% mgmt
Financing live
Cash to close
- Down payment
- $87,475
- Closing costs
- $10,497
- Reserves months
- —
- Total cash needed
- —
Loan-product check · same deal, 3 products live
Conventional
25% down · 7.5% · 30yr
- Down + closing
- —
- Monthly P&I
- —
- Monthly cashflow
- —
- DSCR
- —
- Eligible?
- —
Personal DTI + credit; lowest rate.
DSCR
20% down · 8.5% · 30yr
- Down + closing
- —
- Monthly P&I
- —
- Monthly cashflow
- —
- DSCR
- —
- Eligible?
- —
No personal income docs; deal must DSCR.
Hard money
10% down · 12.0% · 12mo
- Down + closing
- —
- Monthly P&I
- —
- Monthly cashflow
- —
- DSCR
- —
- Eligible?
- —
Short-term bridge; refi at stabilization.
Rent comps 7 comps
| Address | Beds | Baths | Sqft | Rent | $/sqft | DOM | Units | Dist |
|---|---|---|---|---|---|---|---|---|
| 416 Hooper Ave Toms River, NJ | 3.0 | 1.5 | 1330 | $3,000 | $2.26 | 45d | 1 | 0.45mi |
| 18 Maiden Ln Toms River, NJ | 3.0 | 1.0 | 1218 | $2,750 | $2.26 | 8d | 1 | 0.58mi |
| 830 Brookside Dr Toms River, NJ | 4.0 | 3.5 | 1985 | $3,700 | $1.86 | 0d | 1 | 0.97mi |
| 100 Kaplan Ct Toms River, NJ | 1.0–2.0 | 1.0–2.0 | 1123 | $3,007 | $2.68 | 19d | 9 | 1.07mi |
| 408 Forepeak Ave Beachwood, NJ | 3.0 | 1.0 | 1138 | $3,500 | $3.08 | 4d | 1 | 1.28mi |
| 254 Admiral Ave Beachwood, NJ | 3.0 | 2.0 | 1400 | $3,250 | $2.32 | 0d | 1 | 1.43mi |
| 1560 Whittier Ave Toms River, NJ | 4.0 | 2.0 | 1500 | $3,300 | $2.20 | 5d | 1 | 1.47mi |
Listing history 2 events
-
2026-04-02status Pending
-
2026-03-24$349,900 Active
ⓘ Source: listings_history table (triggers on properties + properties_extension) + one-shot
backfill from property_details.listing_events for pre-trigger history.
Tax reassessment forecast NJ · Partial reset (capped growth)
- Current annual tax
- $5,491 · $458/mo
- Projected year-2 tax
- $7,102 · $592/mo
- Expected delta
- +$1,611/yr (+$134/mo · 29.3%)
ⓘ Screening estimate from a state-policy table — verify with the county assessor before closing.
Climate risk First Street
- Flood 1/10 Low FEMA zone X (unshaded) · 0% chance over 30 yrs
- Wildfire 1/10 Low
- Heat 7/10 Severe 7 d/yr ≥100°F today · 15 d/yr by 30 yrs out
- Wind 6/10 Major 72% chance of damaging wind over 30 yrs
- Air quality 3/10 Moderate 3 unhealthy d/yr today · 4 by 30 yrs out
Nearby sold comps map
Loading sold comps map…
Walkable amenities ~0.75 mi
Loading nearby amenities…
Taxation est. · year 1
- Rental income
- $38,640
- − Mortgage interest
- −$19,600
- − Property taxes
- −$5,491
- − Insurance
- −$1,750
- − Repairs & maintenance
- −$3,091
- − Management
- −$3,091
- − Depreciation
- −$10,179
- Taxable loss
- −$4,561
- Est. tax savings @ 24.0%
- +$1,095
- After-tax cash flow
- $2,361/yr
For passive investors: Depreciation is non-cash, so a rental often shows a tax loss while cash-flowing — sheltering income. Rental losses are passive: they offset passive income freely, and up to $25,000/yr can offset ordinary (W-2) income if you actively participate and your MAGI is under $100k (phasing out to $0 by $150k); unused losses carry forward. On sale, claimed depreciation is recaptured at up to 25%, and gains may owe capital-gains tax (a 1031 exchange can defer both). Figures are a year-1 estimate at your 24.0% rate — not tax advice; consult a CPA.
Schools (NCES district)
- District
- Toms River Regional School District
- NCES district ID
- 3416230
- Math proficiency
- 18% ▼ -19.00%
- Reading proficiency
- 44% ▼ -10.00%
- Median HH income
- $72,370
- Composite
- 29.07/100
- National rank
- #6602
- State rank
- #316 of 472 in NJ
Livability — Toms River
- Score
- 81/100
- State rank
- #61
- US rank
- #1538
Category grades
Schools grade is shown separately in the Schools card above.
Census & demographics
- Census place
- Toms River, NJ
- County
- Ocean County · 439,426 people
- City population
- 131,205
- Metro
- New York-Newark-Jersey City, NY-NJ-PA
- Population (ZIP)
- 65,448
- Household income
- $105,224
- Rent vs Own
- Severe rent burden
- 828.0
Population outlook (Ocean County) Hauer SSP2
- Today (2025)
- 586,991 people
- By 2030
- 581,403 · -1.0%
- By 2040
- 564,913 · -3.8%
- By 2050
- 538,149 · -8.3%
- By 2075
- 468,845 · -20.1%
- By 2100
- 350,297 · -40.3%
Race, ethnicity, and origin ACS 2023
- Neighborhood character
- Predominantly White (77%)
- Race & ethnicity
- White 77% Hispanic / Latino 12% Two or more races 7% Asian 4% Black 3%
- Hispanic origin (detail)
- Mexican 3% Puerto Rican 4%
- Common ancestry
- Romanian 9% Lithuanian 1% Slovak 1%
- Foreign-born
- 10% · Canada, Guatemala, Jamaica
- Languages at home
- 87% English-only · Spanish 7% Other Indo-European 3% Tagalog/Filipino 1%
Political lean MEDSL · Ocean
- 2024 margin
- Solid R (+36.0) · D 31.4% · R 67.4% · Other 1.2%
- 2008→2024 swing
- -17.6pp toward R · 2008: -18.4pp · 2024: -36.0pp
- All cycles
- 2024: R+36.0 2020: R+28.7 2016: R+34.0 2012: R+17.7 2008: R+18.4
Not yet ingested
- Civics
- —
Market trends
- HPI YoY
- ▼ -527.36%
- Current HPI
- 374.5075
- Rent YoY
- ▲ 1.49%
- Metro
- New York-Newark-Jersey City, NY-NJ-PA
- State GDP YoY
- ▲ 2.05%
- F500 in state
- 34
Industry mix (Fortune 500 HQ in NJ)
| Industry | F500 HQs | Revenue |
|---|---|---|
| Consumer Goods | 3 | $31B |
|
||
| Pharmaceuticals | 2 | $153B |
|
||
| Technology | 2 | $21B |
|
||
| Insurance | 2 | $20B |
|
||
| Healthcare | 2 | $19B |
|
||
| Financial Services | 1 | $70B |
|
||
Price history
2 events — show timeline
- 2026-04-02 Pending — MOMLS
- 2026-03-24 Listed $349,900 MOMLS
Property tax history
+2.8%/yrLatest (2025): $5,491 · +7.3% YoY. Source: county tax records.
Cash-flow waterfall
monthlySold comps — $/sqft
last 12 mo · ≤1 miLoading sold comps…