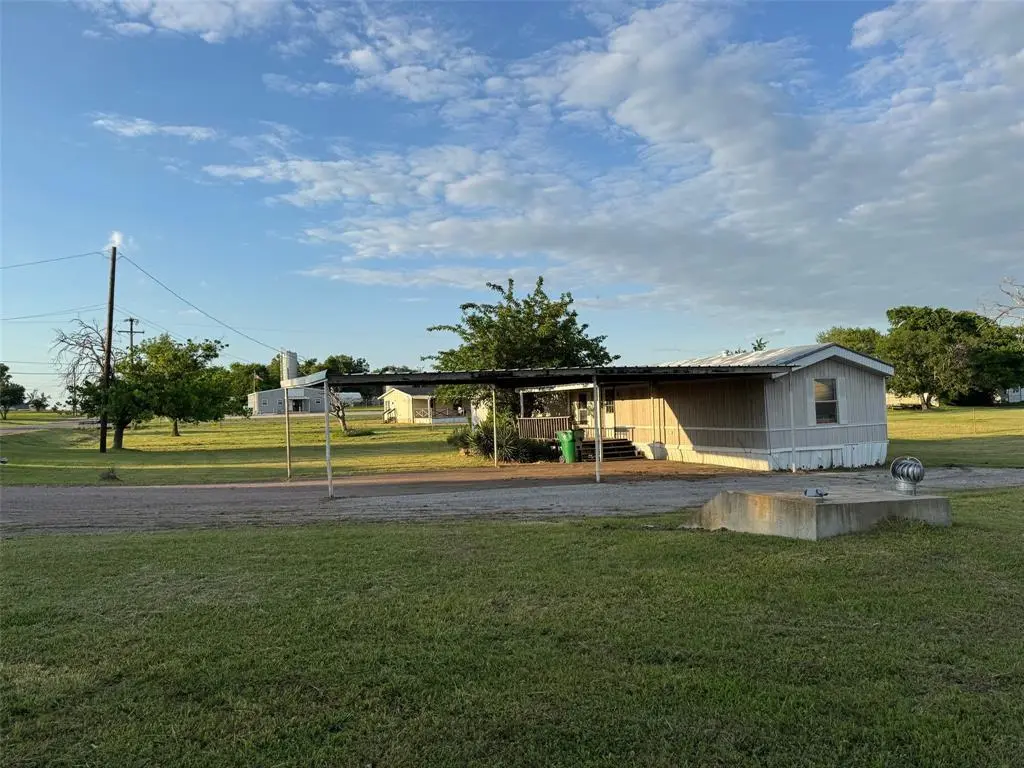
209 Mcelroy St · Southmayd, TX
Flood risk 4/10 · Minor
- FEMA flood zone
- X (unshaded)
- Chance of flooding over 30 yrs
- 0.22%
- Est. flood insurance / yr
- $507 – $1,088
Fire risk 8/10 · Major
- Est. fire insurance / yr
- $1,222 – $2,270
Heat risk 6/10 · Moderate
- Hot days now (above 109°F)
- 7 days/yr
- Hot days in 30 yrs
- 20 days/yr
Wind risk 5/10 · Moderate
- Chance of severe wind over 30 yrs
- 26.0%
Air-quality risk 3/10 · Minor
- Unhealthy air days now
- 3 days/yr
- Unhealthy air days in 30 yrs
- 3 days/yr
Risk factors via First Street. Map © Google.
Why this score? — see what drove the C+ grade
The composite is a weighted blend of 9 inputs, each scored 0–100. Each bar is that input's sub-score; the figure is the points it added to the 100-point composite (weight × sub-score).
- Cash flow +28.0/30.0
- DSCR +9.9/10.0
- ARV discount +7.5/15.0
- 1% rule +6.9/10.0
- Schools +3.5/10.0
- Livability +3.3/5.0
- Rent growth +2.5/5.0
- Condition / age +2.5/5.0
- Appreciation +0.0/10.0
$115,000
🖨 Deal sheet (PDF) 📄 Offer letter ✓ Due diligence
Listing remarks
209 McElroy in Southmayd offers a rare opportunity to create your own vision in the heart of small-town Texoma living. Nestled on approximately . 978 acres, this property is all about the land, location, and potential. With wide open space, mature surroundings, and peaceful country charm, the possibilities are endless for a future homesite, investment opportunity, or weekend retreat. A storm shelter is already in place, adding valuable functionality and peace of mind. The existing mobile home conveys with no assigned value and presents an opportunity for removal, renovation, or temporary use while you bring your dream to life. Conveniently located just minutes from Sherman, this property co
Key facts
- Weekend retreat
- 0.98 acre lot
- 2 parking spots
Tags
Property features AI
Finance
- Other: Listing terms and status: For Sale, Active; possession at closing/funding; Listing may require third-party approval
- Financial info: Acceptable financing: Cash, 1031 Exchange, or contact agent; No second mortgage recorded; Treat as clear loan type
- HOA & community: No association
Exterior
- Parking: Covered parking for 2 vehicles; 2 carport spaces; On-site parking
- Utilities: Utilities: see remarks / other; Not in a municipal utility district
- Home design: Single-family residence; Residential property; Not attached to another dwelling; Multi-parcel property; Subdivision: Guest
- Construction: Built in 2000
- Exterior features: Nearly 1-acre lot (about 0.98 acre); Easements present; Water access to Lake Texoma (Texoma)
Interior
- Kitchen: Other appliances
- Bedrooms: Primary bedroom on main level
- Bathrooms: One full bathroom
- Interior features: One-level layout; Three total rooms; One living area; Other interior features
Neighborhood map
What this means for you Summary
Snapshot
- This is a 1-bed/1.0-bath manufactured listed at $115k.
Deal economics
- At list price, monthly cash flow is $357 ($4k/yr) — positive.
- The deal already cash-flows at list — no discount required.
- Meets the 1% rule at list price ($1k rent vs $115k).
- Recommended offer: $112k (3.0% below list) — sets the bar for market timing.
Location & tenants
- Location reads 66/100 on livability (#610 in TX) — a middle-class / working-renter tenant base. Strengths: crime A+, cost of living A+, housing A+; Watch: amenities F, commute F, health & safety F.
- S And S CISD (rural): math 37% / reading 42% proficiency, ranked #381 of 826 in TX (top 46%) — families likely to look elsewhere, expect single-tenant / working-renter base with shorter leases.
- Zoned schools: S And S Cons El (math 27% / reading 32%, grade F, #2,525 of 4,322 statewide, top 62%, 331 students, 49% FRL).
- Market conditions: 283 active listings in the ZIP; 2,272 units permitted in Grayson County in 2024 (750 in 5+ unit buildings).
Forward outlook
- Local home prices are declining (-3.0%/yr); year-one equity from $795 of loan paydown is wiped out by about $3k of value loss. Plan a longer hold.
- Grayson County population projected at +12% by 2050 — modest demand growth; plan on rents tracking national, not racing it.
- At projected returns (-3.0% appreciation + 3.0% rent growth), your $32k cash investment doubles in ~9 years — after that, you're playing with house money.
Negotiation context
- It's been on market 31 days — a 3% lower offer ($112k) is reasonable based on typical stale-listing flexibility.
Risks & watch-outs
- Climate carrying-cost: moderate wind risk, 26% chance of damaging wind over 30y; severe wildfire risk; extreme-heat days projected 7→20/yr by 2055 (HVAC capex compounding) — expect insurance premiums to compound above CPI over the hold.
Questions for the listing agent
- It's been on market 31 days. Have you received any prior offers? Is the seller open to a 3% concession, seller financing, or rate buy-down credit?
- Is there a deadline driving the sale (1031 exchange, divorce, estate, relocation)? That informs how much negotiation room exists.
- Schools are F-rated, which usually means shorter tenancies and higher turnover. Who's the typical renter profile here, and what's been the actual vacancy rate?
- What's the average days-on-market for RENTAL listings here right now (not sales)? A rising rental-DOM trend means longer vacancies and softer asking-rent achievability than the comps imply.
- What's the recent tenant-quality profile in this submarket — average credit score on applications, eviction rate, late-payment / NSF rate, and stable-employment percentage? A property-management company in the area should have these aggregated.
- How much new for-sale + rental construction is in the pipeline within 1–3 miles? Heavy new supply typically softens prices + rents 12–24 months out; constrained supply supports both.
Investment metrics
- 1% rule
- 1.19% ✓
- Cap rate
- 10.01%
- Cash-on-cash
- 13.29%
- DSCR
- 1.59
- GRM
- 7.0
CMA / ARV
No comps found within radius.
Projected returns pro-forma
-3.0% appreciation · 3.0% rent growth · sell at horizon
- IRR
- 3.3%
- Equity multiple
- 1.13×
- Total profit
- $4,049
- Equity at exit
- $17,147
- IRR
- 12.8%
- Equity multiple
- 2.01×
- Total profit
- $32,673
- Equity at exit
- $9,943
Cash invested: $32,200 (down + closing). Projections, not guarantees.
Landlord ↔ Tenant lean methodology
- Overall (STATE)
- 87 Strongly Landlord-Friendly
- State Texas
- 87 Strongly Landlord-Friendly · R+5
- County
- — inherits STATE
- City
- — inherits STATE
ZIP-level market 76273
- Home prices YoY
- -15.7%
- Active inventory
- 283
- Price-to-rent
- 7.0×
Monthly cashflow live
- Estimated rent
- $1,368 medium interval (Pro) →
- Mortgage (P&I)
- −$603
- Tax from tax record
- −$73 /mo · $878/yr
- Insurance
- −$48
- HOA
- −$0
- Vacancy / Maint / Mgmt
- −$287
- Net cashflow
- $357
Break-even live
Sensitivity live
| Price | -10% $422 | -5% $389 | +0% $357 | +5% $324 | +10% $291 |
|---|---|---|---|---|---|
| Rent | -10% $248 | -5% $302 | +0% $357 | +5% $411 | +10% $465 |
| Rate | -1.0pp $414 | -0.5pp $386 | base $357 | +0.5pp $327 | +1.0pp $296 |
UW: 25.0% down · 7.5% · 30yr · 1.5% tax · 5.0% vac · 8.0% maint · 8.0% mgmt
Financing live
Cash to close
- Down payment
- $28,750
- Closing costs
- $3,450
- Reserves months
- —
- Total cash needed
- —
Loan-product check · same deal, 3 products live
Conventional
25% down · 7.5% · 30yr
- Down + closing
- —
- Monthly P&I
- —
- Monthly cashflow
- —
- DSCR
- —
- Eligible?
- —
Personal DTI + credit; lowest rate.
DSCR
20% down · 8.5% · 30yr
- Down + closing
- —
- Monthly P&I
- —
- Monthly cashflow
- —
- DSCR
- —
- Eligible?
- —
No personal income docs; deal must DSCR.
Hard money
10% down · 12.0% · 12mo
- Down + closing
- —
- Monthly P&I
- —
- Monthly cashflow
- —
- DSCR
- —
- Eligible?
- —
Short-term bridge; refi at stabilization.
Listing history 21 events
-
2026-06-19days on market $115,000 Active 31 DOM
-
2026-06-18days on market $115,000 Active 30 DOM
-
2026-06-17days on market $115,000 Active 29 DOM
-
2026-06-16days on market $115,000 Active 28 DOM
-
2026-06-15days on market $115,000 Active 27 DOM
-
2026-06-14days on market $115,000 Active 25 DOM
-
2026-06-13days on market $115,000 Active 24 DOM
-
2026-06-10days on market $115,000 Active 22 DOM
-
2026-06-09days on market $115,000 Active 21 DOM
-
2026-06-08days on market $115,000 Active 20 DOM
-
2026-06-07pricedays on market $115,000 Active 19 DOM
-
2026-06-05days on market $125,000 Active 16 DOM
-
2026-06-02days on market $125,000 Active 14 DOM
-
2026-06-01days on market $125,000 Active 13 DOM
-
2026-05-31days on market $125,000 Active 12 DOM
-
2026-05-30days on market $125,000 Active 11 DOM
-
2026-05-19$125,000 Active
-
2009-08-20soldstatus
-
2007-05-16soldstatus
-
2007-04-03soldstatus
-
2002-12-10soldstatus
ⓘ Source: listings_history table (triggers on properties + properties_extension) + one-shot
backfill from property_details.listing_events for pre-trigger history.
Tax reassessment forecast TX · Resets to sale price
- Current annual tax
- $878 · $73/mo
- Projected year-2 tax
- $2,104 · $175/mo
- Expected delta
- +$1,227/yr (+$102/mo · 139.8%)
ⓘ Screening estimate from a state-policy table — verify with the county assessor before closing.
Climate risk First Street
- Flood 4/10 Moderate FEMA zone X (unshaded) · 22% chance over 30 yrs
- Wildfire 8/10 Severe
- Heat 6/10 Major 7 d/yr ≥109°F today · 20 d/yr by 30 yrs out
- Wind 5/10 Major 26% chance of damaging wind over 30 yrs
- Air quality 3/10 Moderate 3 unhealthy d/yr today · 3 by 30 yrs out
Nearby sold comps map
Loading sold comps map…
Walkable amenities ~0.75 mi
Loading nearby amenities…
Taxation est. · year 1
- Rental income
- $16,415
- − Mortgage interest
- −$6,442
- − Property taxes
- −$878
- − Insurance
- −$575
- − Repairs & maintenance
- −$1,313
- − Management
- −$1,313
- − Depreciation
- −$3,345
- Taxable income
- $2,549
- Est. tax owed @ 24.0%
- −$612
- After-tax cash flow
- $3,667/yr
For passive investors: Depreciation is non-cash, so a rental often shows a tax loss while cash-flowing — sheltering income. Rental losses are passive: they offset passive income freely, and up to $25,000/yr can offset ordinary (W-2) income if you actively participate and your MAGI is under $100k (phasing out to $0 by $150k); unused losses carry forward. On sale, claimed depreciation is recaptured at up to 25%, and gains may owe capital-gains tax (a 1031 exchange can defer both). Figures are a year-1 estimate at your 24.0% rate — not tax advice; consult a CPA.
Schools (NCES district)
- District
- S And S CISD
- NCES district ID
- 4838400
- Math proficiency
- 37% ▼ -10.00%
- Reading proficiency
- 42% ▼ -1.00%
- Median HH income
- $59,107
- Composite
- 34.94/100
- National rank
- #5064
- State rank
- #381 of 826 in TX
Livability — Southmayd
- Score
- 66/100
- State rank
- #610
- US rank
- #11558
Category grades
Schools grade is shown separately in the Schools card above.
Census & demographics
- Census place
- Southmayd, TX
- City population
- 248
- Population (ZIP)
- 11,019
Population outlook (Grayson County) Hauer SSP2
- Today (2025)
- 134,540 people
- By 2030
- 138,653 · +3.1%
- By 2040
- 145,958 · +8.5%
- By 2050
- 151,218 · +12.4%
- By 2075
- 161,802 · +20.3%
- By 2100
- 159,036 · +18.2%
Race, ethnicity, and origin ACS 2023
- Neighborhood character
- Predominantly White (82%)
- Race & ethnicity
- White 82% Hispanic / Latino 10% Two or more races 7% Asian 3% Black 1%
- Hispanic origin (detail)
- Mexican 7%
- Common ancestry
- Lithuanian 3% Portuguese 1% Slovak 1%
- Foreign-born
- 4% · South Korea, Canada
- Languages at home
- 94% English-only · Spanish 5% Other Indo-European 1%
Political lean MEDSL · Grayson
- 2024 margin
- Solid R (+54.3) · D 22.5% · R 76.7%
- 2008→2024 swing
- -16.4pp toward R · 2008: -37.9pp · 2024: -54.3pp
- All cycles
- 2024: R+54.3 2020: R+49.9 2016: R+53.1 2012: R+48.0 2008: R+37.9
Not yet ingested
- Civics
- —
Market trends
- HPI YoY
- ▼ -49.19%
- Current HPI
- 264.3677
- Rent YoY
- —
- Metro
- —
- State GDP YoY
- ▲ 3.95%
- F500 in state
- 110
Industry mix (Fortune 500 HQ in TX)
| Industry | F500 HQs | Revenue |
|---|---|---|
| Energy | 16 | $1,198B |
|
||
| Technology | 5 | $198B |
|
||
| Engineering / Construction | 4 | $72B |
|
||
| Energy Services | 3 | $60B |
|
||
| Utilities | 3 | $41B |
|
||
| Healthcare | 2 | $330B |
|
||
Price history
5 events — show timeline
- 2026-05-19 Listed $125,000 NTREIS
- 2009-08-20 Sold (Public Records) — Public Records
- 2007-05-16 Sold (Public Records) — Public Records
- 2007-04-03 Sold (Public Records) — Public Records
- 2002-12-10 Sold (Public Records) — Public Records
Property tax history
-1.8%/yrLatest (2025): $878 · +9.6% YoY. Source: county tax records.
Cash-flow waterfall
monthlySold comps — $/sqft
last 12 mo · ≤1 miLoading sold comps…