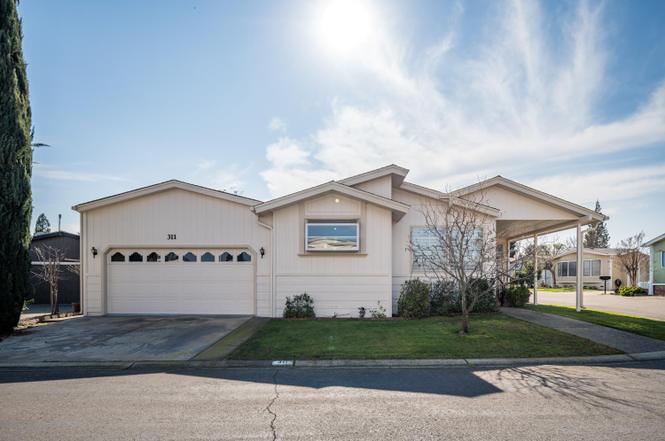
311 Justin Ct · Roseville, CA
Flood risk 1/10 · Minimal
- FEMA flood zone
- X (unshaded)
- Chance of flooding over 30 yrs
- 0.0%
- Est. flood insurance / yr
- $507 – $1,088
Fire risk 5/10 · Moderate
- Est. fire insurance / yr
- $659 – $1,223
Heat risk 7/10 · Major
- Hot days now (above 104°F)
- 7 days/yr
- Hot days in 30 yrs
- 16 days/yr
Wind risk 1/10 · Minimal
- Chance of severe wind over 30 yrs
- —
Air-quality risk 10/10 · Severe
- Unhealthy air days now
- 33 days/yr
- Unhealthy air days in 30 yrs
- 37 days/yr
Risk factors via First Street. Map © Google.
Why this score? — see what drove the B+ grade
The composite is a weighted blend of 9 inputs, each scored 0–100. Each bar is that input's sub-score; the figure is the points it added to the 100-point composite (weight × sub-score).
- Cash flow +30.0/30.0
- ARV discount +12.2/15.0
- 1% rule +10.0/10.0
- DSCR +10.0/10.0
- Schools +5.1/10.0
- Livability +3.9/5.0
- Rent growth +2.9/5.0
- Condition / age +2.5/5.0
- Appreciation +0.0/10.0
$166,900
🖨 Deal sheet 📄 Offer letter ✓ Due diligence
Listing remarks
Welcome home to effortless living in Diamond K Estates 55+ Community. This 2 bedroom 2 bath home has 1644 sq. ft of tranquil living. The ample sized living room has plenty of space for entertaining or a cozy night by the fireplace. The primary bedroom has 2 closets and lots of room for that king sized bed. Tile kitchen counters and with an island. Lovely covered deck for those nice summer evenings. Fresh paint inside and out. Located close to shopping, dining, vibrant old town Roseville and medical. HVAC is newer. Clear rest report.
Key facts
- 2 closets
- Covered deck
- Island
Tags
Property features AI
Finance
- Other: Property is a manufactured home in a park (land lease: No)
- HOA & community: No homeowners association; Located in a senior community
Exterior
- Parking: 2-car garage; Attached garage with garage door opener; Off-street parking; Boat storage; Guest parking available
- Utilities: Public water; Public sewer; Individual electric meter; Individual gas meter; Underground utilities; Cable available
- Home design: Manufactured home in park (triple wide); Updated/remodeled; Built in 1989; Manufacturer: Hallmark Southwest, Make: Winchester
- Construction: Composition roof; Skirt: Other
- Exterior features: Porch awning; Landscaped front and back; Porch
Interior
- Kitchen: Island; Breakfast nook; Ceramic counters; Free-standing gas range; Free-standing refrigerator; Hood over range; Dishwasher; Microwave; Ice maker
- Bedrooms: 2 bedrooms (including master bedroom)
- Flooring: Carpet; Laminate; Wood
- Bathrooms: 2 full bathrooms; Double sinks, skylight/solar tube, tub with shower over, and separate shower stall(s)
- Heating & cooling: Central heating; Fireplace heating; Other heating; Central air conditioning; Ceiling fans
- Interior features: Formal entry; Skylights; Covered porch/deck with railings; Porch steps; Dual-pane windows with window coverings; Living room with cathedral/vaulted ceiling and great room layout; One wood-burning fireplace in the living room
- Laundry & utility: Washer and dryer included; Washer/dryer hookups available; Laundry located inside and in the garage; 220V outlet in laundry area
Neighborhood map
What this means for you Summary
Snapshot
- This is a 2-bed/2.0-bath manufactured listed at $167k.
Deal economics
- At list price, monthly cash flow is $1k ($13k/yr) — positive.
- The deal already cash-flows at list — no discount required.
- Meets the 1% rule at list price ($3k rent vs $167k).
- Recommended offer: $157k (6.0% below list) — sets the bar for market timing.
- Cap rate 13.9% vs local median 2.8% in Roseville — top-decile yield for the area; either an underpriced asset or a hidden risk that comps aren't pricing in. Stress-test before assuming the spread holds.
Location & tenants
- Location reads 77/100 on livability (#90 in CA, #3,239 nationally) — a middle-class / working-renter tenant base. Strengths: commute A+, employment A+, housing A+; Watch: cost of living F.
- Roseville Joint Union High (urban): math 42% / reading 71% proficiency, ranked #86 of 517 in CA (top 17%) — acceptable for families but not a draw, mixed tenant base, ~2y average lease.
- Market conditions: Rents rising (+1.8%/yr); 167 active listings in the ZIP; 16 comparable units currently listed for rent nearby; rentals leasing fast (median 2d on market — plan ~1-2 weeks tenant-placement turnaround); solid renter incomes; 3,535 units permitted in Placer County in 2024 (689 in 5+ unit buildings).
- This rent runs 33% of the median local income ($101k/yr) — at the standard rent-burdened threshold; future hikes will face affordability resistance.
Forward outlook
- Local home prices are declining (-3.0%/yr); year-one equity from $1k of loan paydown is wiped out by about $5k of value loss. Plan a longer hold.
- Placer County population projected at +20% by 2050 — long-run rental-demand tailwind backs the buy-and-hold thesis.
- At projected returns (-3.0% appreciation + 1.8% rent growth), your $47k cash investment doubles in ~5 years — after that, you're playing with house money.
Negotiation context
- It's been on market 70 days — a 6% lower offer ($157k) is reasonable based on typical stale-listing flexibility.
Risks & watch-outs
- Climate carrying-cost: moderate wildfire risk; extreme-heat days projected 7→16/yr by 2055 (HVAC capex compounding) — expect insurance premiums to compound above CPI over the hold.
Questions for the listing agent
- It's been on market 70 days. Have you received any prior offers? Is the seller open to a 6% concession, seller financing, or rate buy-down credit?
- Why hasn't it sold? Are there any deal-killer items the seller is aware of (foundation, flood, title, zoning, code violations)?
- Is there a deadline driving the sale (1031 exchange, divorce, estate, relocation)? That informs how much negotiation room exists.
- Schools are B-rated — typically a magnet for longer-tenancy family renters. What's the average tenant stay here, and is there a school-zone premium baked into asking?
- What's the average days-on-market for RENTAL listings here right now (not sales)? A rising rental-DOM trend means longer vacancies and softer asking-rent achievability than the comps imply.
- What's the recent tenant-quality profile in this submarket — average credit score on applications, eviction rate, late-payment / NSF rate, and stable-employment percentage? A property-management company in the area should have these aggregated.
- How much new for-sale + rental construction is in the pipeline within 1–3 miles? Heavy new supply typically softens prices + rents 12–24 months out; constrained supply supports both.
Investment metrics
- 1% rule
- 1.68% ✓
- Cap rate
- 13.92%
- Cash-on-cash
- 27.24%
- DSCR
- 2.21
- GRM
- 5.0
CMA / ARV
- ARV (on-the-fly)
- $186,368
- Comps found
- 12
Show comp detail 12 sales within ~0.75 mi
| Address | Dist | Beds/Ba | Sqft | Sold | Price | $/sf | Match |
|---|---|---|---|---|---|---|---|
| 290 Lafayette | 0.09mi | 2/2.0 | 1,708 (+3%) | 5mo | $175,900 | $103 | 87 |
| 300 Lafayette Dr | 0.06mi | 3/2.0 (+1) | 1,608 (-3%) | 9mo | $180,000 | $112 | 79 |
| 27 Hancock Dr | 0.19mi | 2/2.0 | 1,790 (+8%) | 0mo | $189,000 | $106 | 78 |
| 227 Lafayette Dr #227 | 0.12mi | 3/2.0 (+1) | 1,624 (-2%) | 11mo | $190,000 | $117 | 76 |
| 144 Kaseberg Dr | 0.19mi | 2/2.0 | 1,788 (+8%) | 8mo | $153,000 | $86 | 72 |
| 322 Kaseberg Dr | 0.05mi | 2/2.0 | 1,440 (-14%) | 8mo | $169,900 | $118 | 69 |
| 173 Livingston | 0.09mi | 2/2.0 | 1,440 (-14%) | 10mo | $120,000 | $83 | 65 |
| 4 Kaseberg | 0.07mi | 2/2.0 | 1,440 (-14%) | 11mo | $179,000 | $124 | 65 |
| 255 Kirkwood Dr | 0.36mi | 3/2.5 (+1) | 1,760 (+6%) | 2mo | $134,500 | $76 | 64 |
| 154 Brunswick | 0.18mi | 3/2.0 (+1) | 1,440 (-14%) | 2mo | $190,000 | $132 | 63 |
| 240 Lafayette | 0.32mi | 2/2.0 | 1,440 (-14%) | 2mo | $135,000 | $94 | 61 |
| 128 Kaseberg Dr | 0.30mi | 3/2.5 (+1) | 1,840 (+11%) | 17mo | $215,500 | $117 | 48 |
Match score weights: distance 35% · size 25% · config 20% · recency 20%. Top-matched comps best support the ARV.
Projected returns pro-forma
-3.0% appreciation · 1.75% rent growth · sell at horizon
- IRR
- 19.8%
- Equity multiple
- 1.79×
- Total profit
- $37,085
- Equity at exit
- $24,885
- IRR
- 27.2%
- Equity multiple
- 3.26×
- Total profit
- $105,539
- Equity at exit
- $14,430
Cash invested: $46,732 (down + closing). Projections, not guarantees.
Landlord ↔ Tenant lean methodology
- Overall (STATE)
- 18 Strongly Tenant-Friendly
- State California
- 18 Strongly Tenant-Friendly · D+13
- County
- — inherits STATE
- City
- — inherits STATE
ZIP-level market 95678
- Rents YoY
- 1.8%
- Active inventory
- 167
- Price-to-rent
- 5.0×
Monthly cashflow live
- Estimated rent
- $2,803 high interval (Pro) →
- Mortgage (P&I)
- −$875
- Tax est. 1.5%
- −$209 /mo · $2,504/yr
- Insurance
- −$70
- HOA
- −$0
- Vacancy / Maint / Mgmt
- −$589
- Net cashflow
- $1,061
Break-even live
UW: 25.0% down · 7.5% · 30yr · 1.5% tax · 5.0% vac · 8.0% maint · 8.0% mgmt
Financing live
Cash to close
- Down payment
- $41,725
- Closing costs
- $5,007
- Reserves months
- —
- Total cash needed
- —
Loan-product check · same deal, 3 products live
Conventional
25% down · 7.5% · 30yr
- Down + closing
- —
- Monthly P&I
- —
- Monthly cashflow
- —
- DSCR
- —
- Eligible?
- —
Personal DTI + credit; lowest rate.
DSCR
20% down · 8.5% · 30yr
- Down + closing
- —
- Monthly P&I
- —
- Monthly cashflow
- —
- DSCR
- —
- Eligible?
- —
No personal income docs; deal must DSCR.
Hard money
10% down · 12.0% · 12mo
- Down + closing
- —
- Monthly P&I
- —
- Monthly cashflow
- —
- DSCR
- —
- Eligible?
- —
Short-term bridge; refi at stabilization.
Rent comps 16 comps
| Address | Beds | Baths | Sqft | Rent | $/sqft | DOM | Units | Dist |
|---|---|---|---|---|---|---|---|---|
| 512 Adora Cir Roseville, CA | 2.0 | 3.0 | 1225 | $3,387 | $2.76 | 4d | 1 | 0.40mi |
| 413 Adora Cir Roseville, CA | 1.0–2.0 | 1.0–2.5 | 985 | $2,863 | $2.91 | 1d | 4 | 0.40mi |
| 1317 Rice Ln Roseville, CA | 3.0 | 2.0 | 1442 | $2,395 | $1.66 | 1d | 1 | 0.47mi |
| 304 Diamond Oaks Rd Roseville, CA | 3.0 | 2.0 | 2116 | $3,200 | $1.51 | 10d | 1 | 0.52mi |
| 1243 S Bluff Dr Roseville, CA | 3.0 | 2.0 | 1433 | $2,795 | $1.95 | 21d | 1 | 0.58mi |
| 604 Hovey Way Roseville, CA | 3.0 | 2.0 | 1169 | $2,695 | $2.31 | 1d | 1 | 0.59mi |
| 317 Aspen Ct Roseville, CA | 3.0 | 2.0 | 1744 | $3,200 | $1.83 | 1d | 1 | 0.63mi |
| 248 Summer Grove Cir Roseville, CA | 3.0 | 2.0 | 1160 | $2,695 | $2.32 | 1d | 1 | 0.94mi |
| 637 Shelby Ranch Ln Roseville, CA | 3.0 | 2.0 | 1241 | $2,700 | $2.18 | 21d | 1 | 0.94mi |
| 409 Washington Blvd Roseville, CA | 3.0 | 2.0 | 2000 | $1,995 | $1.00 | 1d | 1 | 0.97mi |
| 412 Avila Dr Roseville, CA | 3.0 | 3.0 | 1839 | $2,900 | $1.58 | 1d | 1 | 1.33mi |
| 201 Sapphire Ct Roseville, CA | 3.0 | 3.0 | 1488 | $2,750 | $1.85 | 19d | 1 | 1.33mi |
| 204 Sapphire Ct Roseville, CA | 3.0 | 2.0 | 1202 | $2,775 | $2.31 | 1d | 1 | 1.34mi |
| 120 Ivy St Roseville, CA | 3.0 | 2.5 | 1525 | $2,595 | $1.70 | 1d | 1 | 1.35mi |
| 129 Vernon St Apt 403 Roseville, CA | 2.0 | 2.0 | 2112 | $4,500 | $2.13 | 7d | 1 | 1.36mi |
| 7950 Foothills Blvd Roseville, CA | 2.0–3.0 | 2.0 | 1103 | $2,380 | $2.16 | 1d | 5 | 1.36mi |
Climate risk First Street
- Flood 1/10 Low FEMA zone X (unshaded) · 0% chance over 30 yrs
- Wildfire 5/10 Major
- Heat 7/10 Severe 7 d/yr ≥104°F today · 16 d/yr by 30 yrs out
- Wind 1/10 Low
- Air quality 10/10 Extreme 33 unhealthy d/yr today · 37 by 30 yrs out
Nearby sold comps map
Loading sold comps map…
Walkable amenities ~0.75 mi
Loading nearby amenities…
Taxation est. · year 1
- Rental income
- $33,635
- − Mortgage interest
- −$9,349
- − Property taxes
- −$2,504
- − Insurance
- −$834
- − Repairs & maintenance
- −$2,691
- − Management
- −$2,691
- − Depreciation
- −$4,855
- Taxable income
- $10,711
- Est. tax owed @ 24.0%
- −$2,571
- After-tax cash flow
- $10,160/yr
For passive investors: Depreciation is non-cash, so a rental often shows a tax loss while cash-flowing — sheltering income. Rental losses are passive: they offset passive income freely, and up to $25,000/yr can offset ordinary (W-2) income if you actively participate and your MAGI is under $100k (phasing out to $0 by $150k); unused losses carry forward. On sale, claimed depreciation is recaptured at up to 25%, and gains may owe capital-gains tax (a 1031 exchange can defer both). Figures are a year-1 estimate at your 24.0% rate — not tax advice; consult a CPA.
Schools (NCES district)
- District
- Roseville Joint Union High
- NCES district ID
- 0633630
- Math proficiency
- 42% ▼ -6.00%
- Reading proficiency
- 71% ▼ -3.00%
- Median HH income
- $81,930
- Composite
- 51.11/100
- National rank
- #1763
- State rank
- #86 of 517 in CA
Livability — Roseville
- Score
- 77/100
- State rank
- #90
- US rank
- #3239
Category grades
Schools grade is shown separately in the Schools card above.
Census & demographics
- Census place
- Roseville, CA
- County
- Placer County · 390,510 people
- City population
- 161,837
- Metro
- Sacramento-Roseville-Folsom, CA
- Population (ZIP)
- 45,346
- Household income
- $100,554
- Rent vs Own
- Severe rent burden
- 2544.0
Population outlook (Placer County) Hauer SSP2
- Today (2025)
- 422,709 people
- By 2030
- 444,249 · +5.1%
- By 2040
- 480,192 · +13.6%
- By 2050
- 506,390 · +19.8%
- By 2075
- 550,219 · +30.2%
- By 2100
- 547,760 · +29.6%
Race, ethnicity, and origin ACS 2023
- Neighborhood character
- Diverse neighborhood (Simpson 0.58)
- Race & ethnicity
- White 60% Hispanic / Latino 23% Two or more races 17% Asian 8% Black 2%
- Hispanic origin (detail)
- Mexican 16% Puerto Rican 1%
- Common ancestry
- Russian 3% Slovak 2% Italian 2%
- Foreign-born
- 14% · Canada, China, South Korea
- Languages at home
- 79% English-only · Spanish 10% Other Indo-European 4% Russian/Polish/Slavic 2%
Political lean MEDSL · Placer
- 2024 margin
- Lean R (+8.5) · D 44.3% · R 52.8% · Other 2.9%
- 2008→2024 swing
- +2.8pp toward D · 2008: -11.3pp · 2024: -8.5pp
- All cycles
- 2024: R+8.5 2020: R+6.7 2016: R+11.3 2012: R+20.1 2008: R+11.3
Not yet ingested
- Civics
- —
Market trends
- HPI YoY
- ▼ -418.46%
- Current HPI
- 272.0182
- Rent YoY
- ▲ 1.75%
- Metro
- Sacramento-Roseville-Folsom, CA
- State GDP YoY
- ▲ 3.21%
- F500 in state
- 116
Industry mix (Fortune 500 HQ in CA)
| Industry | F500 HQs | Revenue |
|---|---|---|
| Technology | 27 | $1,492B |
|
||
| Financial Services | 3 | $174B |
|
||
| Retail | 3 | $44B |
|
||
| Insurance | 3 | $26B |
|
||
| Media / Entertainment | 2 | $115B |
|
||
| Pharmaceuticals / Biotech | 2 | $62B |
|
||
Cash-flow waterfall
monthlySold comps — $/sqft
last 12 mo · ≤1 miLoading sold comps…