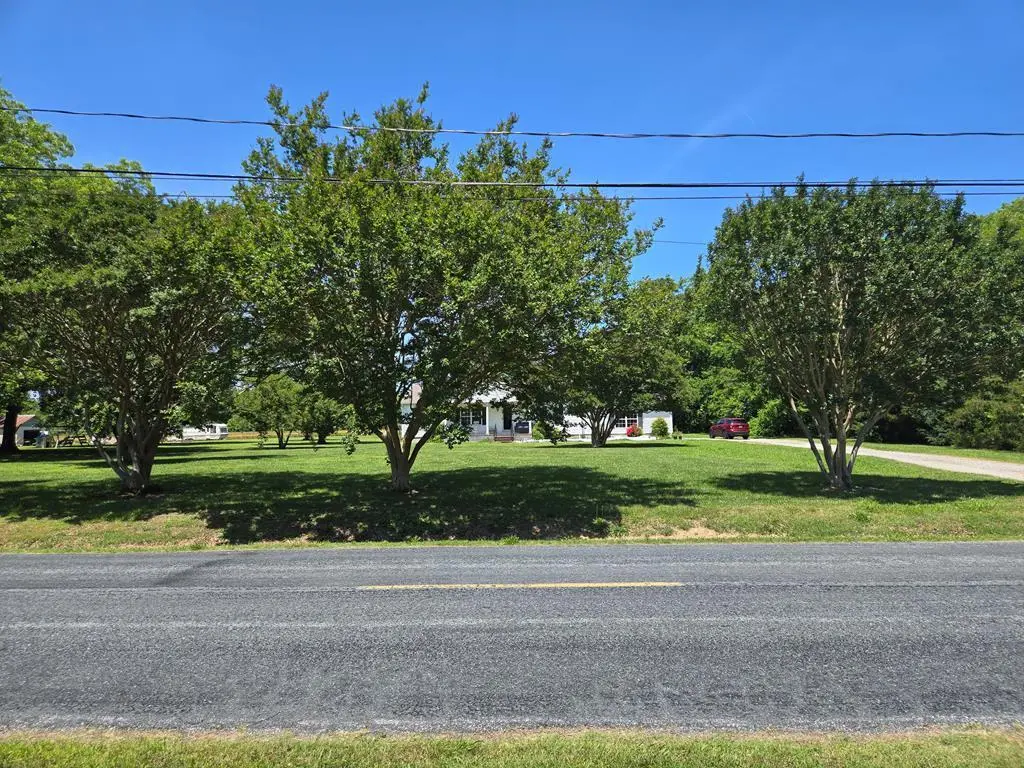
3107 Old Cape Charles Rd · Cape Charles, VA
Flood risk 1/10 · Minimal
- FEMA flood zone
- X (unshaded)
- Chance of flooding over 30 yrs
- 0.0%
- Est. flood insurance / yr
- $507 – $1,088
Fire risk 1/10 · Minimal
- Est. fire insurance / yr
- $666 – $1,236
Heat risk 9/10 · Severe
- Hot days now (above 102°F)
- 7 days/yr
- Hot days in 30 yrs
- 18 days/yr
Wind risk 8/10 · Major
- Chance of severe wind over 30 yrs
- 80.0%
Air-quality risk 3/10 · Minor
- Unhealthy air days now
- 3 days/yr
- Unhealthy air days in 30 yrs
- 3 days/yr
Risk factors via First Street. Map © Google.
Why this score? — see what drove the D grade
The composite is a weighted blend of 9 inputs, each scored 0–100. Each bar is that input's sub-score; the figure is the points it added to the 100-point composite (weight × sub-score).
- Cash flow +12.5/30.0
- ARV discount +10.3/15.0
- Schools +4.1/10.0
- DSCR +3.7/10.0
- Livability +3.1/5.0
- Rent growth +2.5/5.0
- Condition / age +2.5/5.0
- 1% rule +2.4/10.0
- Appreciation +0.0/10.0
$399,000
🖨 Deal sheet (PDF) 📄 Offer letter ✓ Due diligence
Listing remarks MLS
Cape Charles: 1.95 acre 3bdrm2bath 2car attached garage. Primary bedroom/bath on one side, two others with bath on the other side. Can be sold semi furnished. Can be ready for vacation rental market quickly. Right outside of Town, 2 mile walk from the house to Rayfield's on the new trail. No Town taxes, NO HOA. Plenty of land for pool, boat/rv storage. Sit on the porch and watch the ponies play. Owner/agent
Key facts
- Boat rv storage
- 1.95 acre
- 1.94 acre lot
Tags
Neighborhood map
What this means for you Summary
Snapshot
- This is a 3-bed/2.0-bath single-family listed at $399k.
Deal economics
- At list price, monthly cash flow is $-57 ($-681/yr) — negative.
- To cash-flow at today's rent, offer at most $389k (2.5% below list).
- To meet the 1% rule (rent ≥ 1% of price), the offer needs to be $295k (26.1% below list).
- Recommended offer: $295k (26.1% below list) — sets the bar for 1% rule.
- Cap rate 6.1% vs local median 1.2% in Cape Charles — top-decile yield for the area; either an underpriced asset or a hidden risk that comps aren't pricing in. Stress-test before assuming the spread holds.
Location & tenants
- Location reads 61/100 on livability (#420 in VA) — a middle-class / working-renter tenant base. Strengths: crime A+; Watch: employment C-, housing C-, cost of living D+.
- Northampton County Public School District (rural): math 36% / reading 62% proficiency, ranked #103 of 131 in VA (top 79%) — families likely to look elsewhere, expect single-tenant / working-renter base with shorter leases; 68% free/reduced lunch — lower-income household profile, screen leases tightly.
- Zoned schools: Kiptopeke Elementary (math 27% / reading 52%, grade F, #900 of 1,108 statewide, top 83%, 351 students, 100% FRL); Northampton Middle (math 37% / reading 67%, grade C+, #218 of 342 statewide, top 65%, 206 students, 99% FRL); Northampton High (math 47% / reading 77%, grade B-, #231 of 319 statewide, top 75%, 433 students, 100% FRL) — zoned schools average 99% FRL vs 68% district-wide (31 pts higher); higher-poverty schools than district average — tighter screening recommended.
- Market conditions: 339 active listings in the ZIP; 1 comparable units currently listed for rent nearby; 164 units permitted in Northampton County in 2024 (0 in 5+ unit buildings).
Forward outlook
- Local home prices are declining (-3.0%/yr); year-one equity from $3k of loan paydown is wiped out by about $12k of value loss. Plan a longer hold.
- Northampton County population projected at -23% by 2050 — secular population decline; favor cash flow + early exit over multi-decade hold.
Negotiation context
- It's been on market 108 days — a 9% lower offer ($363k) is reasonable based on typical stale-listing flexibility.
- 4 sale attempts; this cycle's ask has dropped $26k (6%) from the opening price — seller is motivated, your offer sets the floor, not the list.
Risks & watch-outs
- Climate carrying-cost: severe wind risk, 80% chance of damaging wind over 30y; extreme-heat days projected 7→18/yr by 2055 (HVAC capex compounding) — expect insurance premiums to compound above CPI over the hold.
Questions for the listing agent
- What do current leases actually rent for vs. the listed asking? Can we see a recent rent roll and the last 12 months of T-12 income?
- It's been on market 108 days. Have you received any prior offers? Is the seller open to a 26% concession, seller financing, or rate buy-down credit?
- Why hasn't it sold? Are there any deal-killer items the seller is aware of (foundation, flood, title, zoning, code violations)?
- Is there a deadline driving the sale (1031 exchange, divorce, estate, relocation)? That informs how much negotiation room exists.
- The area grade is low — what's the realistic commute time and amenity access for the typical tenant pool here? Any planned neighborhood developments (good or bad) we should know about?
- What's the average days-on-market for RENTAL listings here right now (not sales)? A rising rental-DOM trend means longer vacancies and softer asking-rent achievability than the comps imply.
- What's the recent tenant-quality profile in this submarket — average credit score on applications, eviction rate, late-payment / NSF rate, and stable-employment percentage? A property-management company in the area should have these aggregated.
- How much new for-sale + rental construction is in the pipeline within 1–3 miles? Heavy new supply typically softens prices + rents 12–24 months out; constrained supply supports both.
Investment metrics
- 1% rule
- 0.74% ✗
- Cap rate
- 6.12%
- Cash-on-cash
- -0.61%
- DSCR
- 0.97
- GRM
- 11.3
CMA / ARV
- ARV (median comp)
- $425,234
- List price
- $399,000
- Delta
- -6.17%
- Verdict
- FAIR
- Comps
- 13 within 1.0 mi
Projected returns pro-forma
-3.0% appreciation · 3.0% rent growth · sell at horizon
- IRR
- -17.4%
- Equity multiple
- 0.39×
- Total profit
- $-68,451
- Equity at exit
- $59,492
- IRR
- -9.5%
- Equity multiple
- 0.42×
- Total profit
- $-65,002
- Equity at exit
- $34,498
Cash invested: $111,720 (down + closing). Projections, not guarantees.
Landlord ↔ Tenant lean methodology
- Overall (STATE)
- 55 Moderately Landlord-Leaning
- State Virginia
- 55 Moderately Landlord-Leaning · D+2
- County
- — inherits STATE
- City
- — inherits STATE
ZIP-level market 23310
- Active inventory
- 339
- Price-to-rent
- 11.3×
Monthly cashflow live
- Estimated rent
- $2,950 medium interval (Pro) →
- Mortgage (P&I)
- −$2,092
- Tax from tax record
- −$129 /mo · $1,543/yr
- Insurance
- −$166
- HOA
- −$0
- Vacancy / Maint / Mgmt
- −$620
- Net cashflow
- $-57
Break-even live
Sensitivity live
| Price | -10% $169 | -5% $56 | +0% $-57 | +5% $-170 | +10% $-283 |
|---|---|---|---|---|---|
| Rent | -10% $-290 | -5% $-173 | +0% $-57 | +5% $60 | +10% $176 |
| Rate | -1.0pp $144 | -0.5pp $45 | base $-57 | +0.5pp $-160 | +1.0pp $-265 |
UW: 25.0% down · 7.5% · 30yr · 1.5% tax · 5.0% vac · 8.0% maint · 8.0% mgmt
Financing live
Cash to close
- Down payment
- $99,750
- Closing costs
- $11,970
- Reserves months
- —
- Total cash needed
- —
Loan-product check · same deal, 3 products live
Conventional
25% down · 7.5% · 30yr
- Down + closing
- —
- Monthly P&I
- —
- Monthly cashflow
- —
- DSCR
- —
- Eligible?
- —
Personal DTI + credit; lowest rate.
DSCR
20% down · 8.5% · 30yr
- Down + closing
- —
- Monthly P&I
- —
- Monthly cashflow
- —
- DSCR
- —
- Eligible?
- —
No personal income docs; deal must DSCR.
Hard money
10% down · 12.0% · 12mo
- Down + closing
- —
- Monthly P&I
- —
- Monthly cashflow
- —
- DSCR
- —
- Eligible?
- —
Short-term bridge; refi at stabilization.
Rent comps 1 comps
| Address | Beds | Baths | Sqft | Rent | $/sqft | DOM | Units | Dist |
|---|---|---|---|---|---|---|---|---|
| 304 Troon Ct Cape Charles, VA | 3.0 | 2.0 | 1550 | $2,950 | $1.90 | 45d | 1 | 1.24mi |
Listing history 23 events
-
2026-06-21days on market $399,000 Active 108 DOM
-
2026-06-19days on market $399,000 Active 106 DOM
-
2026-06-18days on market $399,000 Active 105 DOM
-
2026-06-17days on market $399,000 Active 104 DOM
-
2026-06-16days on market $399,000 Active 103 DOM
-
2026-06-15days on market $399,000 Active 102 DOM
-
2026-06-14pricedays on market $399,000 Active 100 DOM
-
2026-06-12days on market $425,000 Active 99 DOM
-
2026-06-09days on market $425,000 Active 96 DOM
-
2026-06-08days on market $425,000 Active 95 DOM
-
2026-06-07days on market $425,000 Active 94 DOM
-
2026-06-05days on market $425,000 Active 92 DOM
-
2026-06-03days on market $425,000 Active 90 DOM
-
2026-06-02days on market $425,000 Active 89 DOM
-
2026-06-01days on market $425,000 Active 88 DOM
-
2026-05-31days on market $425,000 Active 87 DOM
-
2026-05-30days on market $425,000 Active 86 DOM
-
2026-03-05$425,000 Active 410-char remark
Show marketing remark (410 chars)
Cape Charles: 1.95 acre 3bdrm2bath 2car attached garage. Primary bedroom/bath on one side, two others with bath on the other side. Can be sold semi furnished. Can be ready for vacation rental market quickly. Right outside of Town, 2 mile walk from the house to Rayfield's on the new trail. No Town taxes, NO HOA. Plenty of land for pool, boat/rv storage. Sit on the porch and watch the ponies play. Owner/agent
-
2026-03-03status Active
-
2026-03-03price $415,000
-
2025-12-03$389,900 Active
-
2025-06-02price $389,900
-
2025-05-26$424,900 Active
ⓘ Source: listings_history table (triggers on properties + properties_extension) + one-shot
backfill from property_details.listing_events for pre-trigger history.
Tax reassessment forecast VA · Resets to sale price
- Current annual tax
- $1,543 · $129/mo
- Projected year-2 tax
- $3,272 · $273/mo
- Expected delta
- +$1,729/yr (+$144/mo · 112.0%)
ⓘ Screening estimate from a state-policy table — verify with the county assessor before closing.
Climate risk First Street
- Flood 1/10 Low FEMA zone X (unshaded) · 0% chance over 30 yrs
- Wildfire 1/10 Low
- Heat 9/10 Extreme 7 d/yr ≥102°F today · 18 d/yr by 30 yrs out
- Wind 8/10 Severe 80% chance of damaging wind over 30 yrs
- Air quality 3/10 Moderate 3 unhealthy d/yr today · 3 by 30 yrs out
Nearby sold comps map
Loading sold comps map…
Walkable amenities ~0.75 mi
Loading nearby amenities…
Taxation est. · year 1
- Rental income
- $35,400
- − Mortgage interest
- −$22,350
- − Property taxes
- −$1,543
- − Insurance
- −$1,995
- − Repairs & maintenance
- −$2,832
- − Management
- −$2,832
- − Depreciation
- −$11,607
- Taxable loss
- −$7,759
- Est. tax savings @ 24.0%
- +$1,862
- After-tax cash flow
- $1,181/yr
For passive investors: Depreciation is non-cash, so a rental often shows a tax loss while cash-flowing — sheltering income. Rental losses are passive: they offset passive income freely, and up to $25,000/yr can offset ordinary (W-2) income if you actively participate and your MAGI is under $100k (phasing out to $0 by $150k); unused losses carry forward. On sale, claimed depreciation is recaptured at up to 25%, and gains may owe capital-gains tax (a 1031 exchange can defer both). Figures are a year-1 estimate at your 24.0% rate — not tax advice; consult a CPA.
Schools (NCES district)
- District
- Northampton County Public School District
- NCES district ID
- 5102710
- Math proficiency
- 36% ▼ -33.00%
- Reading proficiency
- 62% ▼ -3.00%
- Median HH income
- $37,253
- Composite
- 40.63/100
- National rank
- #3687
- State rank
- #103 of 131 in VA
Livability — Cape Charles
- Score
- 61/100
- State rank
- #420
- US rank
- #18001
Category grades
Schools grade is shown separately in the Schools card above.
Census & demographics
- Population (ZIP)
- 4,934
Population outlook (Northampton County) Hauer SSP2
- Today (2025)
- 11,360 people
- By 2030
- 10,838 · -4.6%
- By 2040
- 9,696 · -14.6%
- By 2050
- 8,764 · -22.9%
- By 2075
- 6,885 · -39.4%
- By 2100
- 4,891 · -56.9%
Race, ethnicity, and origin ACS 2023
- Neighborhood character
- Majority White (62%)
- Race & ethnicity
- White 62% Black 28% Two or more races 8% Hispanic / Latino 7%
- Hispanic origin (detail)
- Mexican 4% Puerto Rican 2%
- Common ancestry
- Lithuanian 3% Romanian 1% Slovak 1%
- Foreign-born
- 4% · Canada
- Languages at home
- 93% English-only · Spanish 4% Russian/Polish/Slavic 1% French/Haitian/Cajun 1%
Political lean MEDSL · Northampton
- 2024 margin
- Lean D (+6.2) · D 52.7% · R 46.6%
- 2008→2024 swing
- -10.4pp toward R · 2008: 16.5pp · 2024: 6.2pp
- All cycles
- 2024: D+6.2 2020: D+10.6 2016: D+9.3 2012: D+16.4 2008: D+16.5
Not yet ingested
- Civics
- —
Market trends
- HPI YoY
- ▼ -180.64%
- Current HPI
- 282.274
- Rent YoY
- —
- Metro
- —
- State GDP YoY
- ▲ 2.40%
- F500 in state
- 50
Industry mix (Fortune 500 HQ in VA)
| Industry | F500 HQs | Revenue |
|---|---|---|
| Aerospace / Defense | 4 | $236B |
|
||
| Technology / Defense | 3 | $32B |
|
||
| Financial Services | 2 | $176B |
|
||
| Utilities | 2 | $27B |
|
||
| Insurance | 2 | $25B |
|
||
| Technology | 2 | $15B |
|
||
Price history
+0.0% since first listed6 events — show timeline
- 2026-03-05 Listed $425,000 ESAR
- 2026-03-03 Relisted — ESAR
- 2026-03-03 Price Changed $415,000 ESAR
- 2025-12-03 Listed $389,900 ESAR
- 2025-06-02 Price Changed $389,900 ESAR
- 2025-05-26 Listed $424,900 ESAR
Property tax history
+3.2%/yrLatest (2024): $1,543 · +35.0% YoY. Source: county tax records.
Cash-flow waterfall
monthlySold comps — $/sqft
last 12 mo · ≤1 miLoading sold comps…