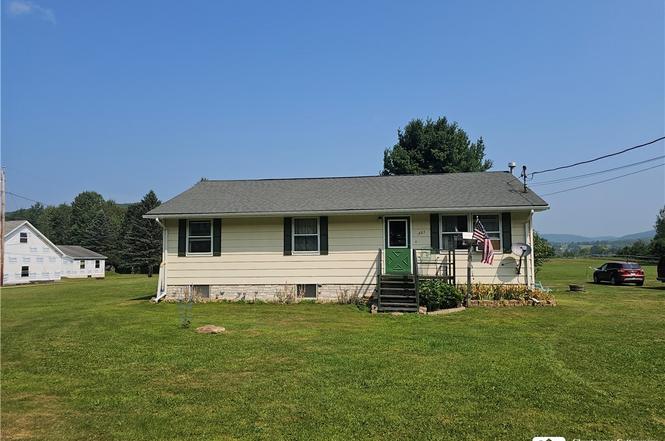
1483 Portville Obi Rd · Weston Mills, NY
Flood risk 1/10 · Minimal
- FEMA flood zone
- X
- Chance of flooding over 30 yrs
- 0.0%
- Est. flood insurance / yr
- $473 – $860
Fire risk 4/10 · Minor
- Est. fire insurance / yr
- $691 – $1,283
Heat risk 2/10 · Minimal
- Hot days now (above 89°F)
- 8 days/yr
- Hot days in 30 yrs
- 18 days/yr
Wind risk 1/10 · Minimal
- Chance of severe wind over 30 yrs
- —
Air-quality risk 1/10 · Minimal
- Unhealthy air days now
- 0 days/yr
- Unhealthy air days in 30 yrs
- 0 days/yr
Risk factors via First Street. Map © Google.
Why this score? — see what drove the D- grade
The composite is a weighted blend of 9 inputs, each scored 0–100. Each bar is that input's sub-score; the figure is the points it added to the 100-point composite (weight × sub-score).
- Appreciation +8.8/10.0
- Cash flow +6.6/30.0
- Schools +5.5/10.0
- ARV discount +3.4/15.0
- Livability +3.2/5.0
- 1% rule +3.0/10.0
- Rent growth +2.5/5.0
- Condition / age +2.5/5.0
- DSCR +0.9/10.0
$139,900
🖨 Deal sheet (PDF) 📄 Offer letter ✓ Due diligence
Listing remarks
Charming 3-bedroom ranch situated on a beautiful 1.1-acre lot in a peaceful setting! This home offers comfortable one-level living with the added bonus of a partially finished basement that expands your living space. Downstairs you’ll find two bonus rooms, a kitchenette, and a bathroom already in place—perfect for guests, extended living, hobbies, or a potential in-law setup. Outside, enjoy the tranquility of the spacious yard along with a large shed conveniently located next to the home, providing excellent storage and easy access. A wonderful opportunity to enjoy country-style living with room to grow!
Key facts
- Spacious yard
- Kitchenette
- Two bonus rooms
Tags
Neighborhood map
What this means for you Summary
Snapshot
- This is a 3-bed/1.0-bath single-family listed at $140k.
Deal economics
- At list price, monthly cash flow is $-228 ($-3k/yr) — negative.
- To cash-flow at today's rent, offer at most $100k (28.7% below list).
- To meet the 1% rule (rent ≥ 1% of price), the offer needs to be $112k (20.2% below list).
- Recommended offer: $100k (28.7% below list) — sets the bar for cash-flow.
Location & tenants
- Location reads 65/100 on livability (#667 in NY) — a middle-class / working-renter tenant base. Strengths: cost of living A+, housing A+, crime A; Watch: health & safety C-, amenities F, commute F.
- Portville Central School District (rural): math 63% / reading 65% proficiency, ranked #190 of 590 in NY (top 32%) — acceptable for families but not a draw, mixed tenant base, ~2y average lease.
- Zoned schools: Portville Elementary School (math 60% / reading 62%, grade B, #736 of 2,108 statewide, top 35%, 518 students, 46% FRL); Portville Junior-Senior High School (math 67% / reading 72%, grade B, #715 of 1,100 statewide, top 67%, 450 students, 47% FRL) — zoned schools average 46% FRL vs 30% district-wide (17 pts higher); higher-poverty schools than district average — tighter screening recommended.
- Market conditions: 25 active listings in the ZIP; 87 units permitted in Allegany County in 2024 (0 in 5+ unit buildings).
Forward outlook
- In year one you build about $12k of equity ($967 loan paydown + $11k appreciation (7.7% local appreciation)).
- Allegany County population projected at -26% by 2050 — secular population decline; favor cash flow + early exit over multi-decade hold.
- By year 4, paydown + projected appreciation supports a ~$40k cash-out refi (75% LTV) — recoverable capital for the next deal without selling this one.
Negotiation context
- Only 4 days on market — expect competitive offers; lowballing is unlikely to land.
- 2 sale attempts with the ask held roughly flat each time — persistent listings suggest the price (not the market) is what's stuck; bring a comps-based counter.
- Current owner paid $70k; list at $140k implies a 100% gain — meaningful room to come down on a strong offer.
Risks & watch-outs
- Watch-outs: property tax is 2.7% of price.
Questions for the listing agent
- What do current leases actually rent for vs. the listed asking? Can we see a recent rent roll and the last 12 months of T-12 income?
- Property tax is high relative to price — has the assessment been appealed recently, and will the sale trigger a re-assessment?
- Is there a deadline driving the sale (1031 exchange, divorce, estate, relocation)? That informs how much negotiation room exists.
- Schools are F-rated, which usually means shorter tenancies and higher turnover. Who's the typical renter profile here, and what's been the actual vacancy rate?
- The area grade is low — what's the realistic commute time and amenity access for the typical tenant pool here? Any planned neighborhood developments (good or bad) we should know about?
- What's the average days-on-market for RENTAL listings here right now (not sales)? A rising rental-DOM trend means longer vacancies and softer asking-rent achievability than the comps imply.
- What's the recent tenant-quality profile in this submarket — average credit score on applications, eviction rate, late-payment / NSF rate, and stable-employment percentage? A property-management company in the area should have these aggregated.
- How much new for-sale + rental construction is in the pipeline within 1–3 miles? Heavy new supply typically softens prices + rents 12–24 months out; constrained supply supports both.
Investment metrics
- 1% rule
- 0.80% ✗
- Cap rate
- 4.34%
- Cash-on-cash
- -6.97%
- DSCR
- 0.69
- GRM
- 10.4
CMA / ARV
- ARV (on-the-fly)
- $128,128
- Comps found
- 1
Show comp detail 1 sale within ~0.75 mi
| Address | Dist | Beds/Ba | Sqft | Sold | Price | $/sf | Match |
|---|---|---|---|---|---|---|---|
| 1483 Portville Obi Rd | 0.00mi | 3/2.5 | 1,232 (0%) | 1mo | $128,000 | $104 | 93 |
Match score weights: distance 35% · size 25% · config 20% · recency 20%. Top-matched comps best support the ARV.
Projected returns pro-forma
7.68% appreciation · 3.0% rent growth · sell at horizon
- IRR
- 14.0%
- Equity multiple
- 2.03×
- Total profit
- $40,416
- Equity at exit
- $103,280
- IRR
- 14.1%
- Equity multiple
- 4.27×
- Total profit
- $128,196
- Equity at exit
- $202,207
Cash invested: $39,172 (down + closing). Projections, not guarantees.
Landlord ↔ Tenant lean methodology
- Overall (STATE)
- 15 Strongly Tenant-Friendly
- State New York
- 15 Strongly Tenant-Friendly · D+10
- County
- — inherits STATE
- City
- — inherits STATE
ZIP-level market 14770
- Home prices YoY
- 2.9%
- Active inventory
- 25
- Price-to-rent
- 10.4×
Monthly cashflow live
- Estimated rent
- $1,117 medium interval (Pro) →
- Mortgage (P&I)
- −$734
- Tax from tax record
- −$318 /mo · $3,815/yr
- Insurance
- −$58
- HOA
- −$0
- Vacancy / Maint / Mgmt
- −$235
- Net cashflow
- $-228
Break-even live
Sensitivity live
| Price | -10% $-148 | -5% $-188 | +0% $-228 | +5% $-267 | +10% $-307 |
|---|---|---|---|---|---|
| Rent | -10% $-316 | -5% $-272 | +0% $-228 | +5% $-183 | +10% $-139 |
| Rate | -1.0pp $-157 | -0.5pp $-192 | base $-228 | +0.5pp $-264 | +1.0pp $-301 |
UW: 25.0% down · 7.5% · 30yr · 1.5% tax · 5.0% vac · 8.0% maint · 8.0% mgmt
Financing live
Cash to close
- Down payment
- $34,975
- Closing costs
- $4,197
- Reserves months
- —
- Total cash needed
- —
Loan-product check · same deal, 3 products live
Conventional
25% down · 7.5% · 30yr
- Down + closing
- —
- Monthly P&I
- —
- Monthly cashflow
- —
- DSCR
- —
- Eligible?
- —
Personal DTI + credit; lowest rate.
DSCR
20% down · 8.5% · 30yr
- Down + closing
- —
- Monthly P&I
- —
- Monthly cashflow
- —
- DSCR
- —
- Eligible?
- —
No personal income docs; deal must DSCR.
Hard money
10% down · 12.0% · 12mo
- Down + closing
- —
- Monthly P&I
- —
- Monthly cashflow
- —
- DSCR
- —
- Eligible?
- —
Short-term bridge; refi at stabilization.
Listing history 6 events
-
2026-03-07status Pending
-
2026-03-03$139,900 Active
-
2026-02-06historical
-
2025-09-29price $154,900
-
2025-08-08$159,900 Active
-
2004-05-04soldstatus $70,000
ⓘ Source: listings_history table (triggers on properties + properties_extension) + one-shot
backfill from property_details.listing_events for pre-trigger history.
Tax reassessment forecast NY · Partial reset (capped growth)
- Current annual tax
- $3,815 · $318/mo
- Projected year-2 tax
- $3,815 · $318/mo
- Expected delta
- $0/yr ($0/mo · 0.0%)
ⓘ Screening estimate from a state-policy table — verify with the county assessor before closing.
Climate risk First Street
- Flood 1/10 Low FEMA zone X · 0% chance over 30 yrs
- Wildfire 4/10 Moderate
- Heat 2/10 Low 8 d/yr ≥89°F today · 18 d/yr by 30 yrs out
- Wind 1/10 Low
- Air quality 1/10 Low 0 unhealthy d/yr today · 0 by 30 yrs out
Nearby sold comps map
Loading sold comps map…
Walkable amenities ~0.75 mi
Loading nearby amenities…
Taxation est. · year 1
- Rental income
- $13,401
- − Mortgage interest
- −$7,837
- − Property taxes
- −$3,815
- − Insurance
- −$700
- − Repairs & maintenance
- −$1,072
- − Management
- −$1,072
- − Depreciation
- −$4,070
- Taxable loss
- −$5,163
- Est. tax savings @ 24.0%
- +$1,239
- After-tax cash flow
- $-1,492/yr
For passive investors: Depreciation is non-cash, so a rental often shows a tax loss while cash-flowing — sheltering income. Rental losses are passive: they offset passive income freely, and up to $25,000/yr can offset ordinary (W-2) income if you actively participate and your MAGI is under $100k (phasing out to $0 by $150k); unused losses carry forward. On sale, claimed depreciation is recaptured at up to 25%, and gains may owe capital-gains tax (a 1031 exchange can defer both). Figures are a year-1 estimate at your 24.0% rate — not tax advice; consult a CPA.
Schools (NCES district)
- District
- Portville Central School District
- NCES district ID
- 3623640
- Math proficiency
- 63% ▲ 1.00%
- Reading proficiency
- 65% ▲ 5.00%
- Median HH income
- $52,207
- Composite
- 54.6/100
- National rank
- #1337
- State rank
- #190 of 590 in NY
Livability — Weston Mills
- Score
- 65/100
- State rank
- #667
- US rank
- #12400
Category grades
Schools grade is shown separately in the Schools card above.
Census & demographics
- City population
- 95
- Population (ZIP)
- 2,805
Population outlook (Allegany County) Hauer SSP2
- Today (2025)
- 45,362 people
- By 2030
- 43,078 · -5.0%
- By 2040
- 38,031 · -16.2%
- By 2050
- 33,634 · -25.9%
- By 2075
- 25,285 · -44.3%
- By 2100
- 18,902 · -58.3%
Race, ethnicity, and origin ACS 2023
- Neighborhood character
- Predominantly White (93%)
- Race & ethnicity
- White 93% Two or more races 4% Black 2%
- Common ancestry
- Romanian 8% Slovak 4% Lithuanian 1%
- Foreign-born
- 2% · Canada
- Languages at home
- 99% English-only · Spanish 1%
Political lean MEDSL · Allegany
- 2024 margin
- Solid R (+43.2) · D 28.4% · R 71.6%
- 2008→2024 swing
- -21.5pp toward R · 2008: -21.7pp · 2024: -43.2pp
- All cycles
- 2024: R+43.2 2020: R+38.9 2016: R+42.3 2012: R+25.3 2008: R+21.7
Not yet ingested
- Civics
- —
Market trends
- HPI YoY
- ▲ 7.68%
- Current HPI
- 276.8841
- Rent YoY
- —
- Metro
- —
- State GDP YoY
- ▲ 2.60%
- F500 in state
- 92
Industry mix (Fortune 500 HQ in NY)
| Industry | F500 HQs | Revenue |
|---|---|---|
| Financial Services | 10 | $950B |
|
||
| Consumer Goods | 9 | $162B |
|
||
| Insurance | 4 | $225B |
|
||
| Telecommunications | 2 | $144B |
|
||
| Pharmaceuticals | 2 | $112B |
|
||
| Media / Entertainment | 2 | $69B |
|
||
Price history
+99.9% since first listed6 events — show timeline
- 2026-03-07 Pending — UNYREIS
- 2026-03-03 Listed $139,900 UNYREIS
- 2026-02-06 Listing Removed — UNYREIS
- 2025-09-29 Price Changed $154,900 UNYREIS
- 2025-08-08 Listed $159,900 UNYREIS
- 2004-05-04 Sold (Public Records) $70,000 Public Records
Property tax history
+5.3%/yrLatest (2025): $3,815 · +3.5% YoY. Source: county tax records.
Cash-flow waterfall
monthlySold comps — $/sqft
last 12 mo · ≤1 miLoading sold comps…