 Multi-family
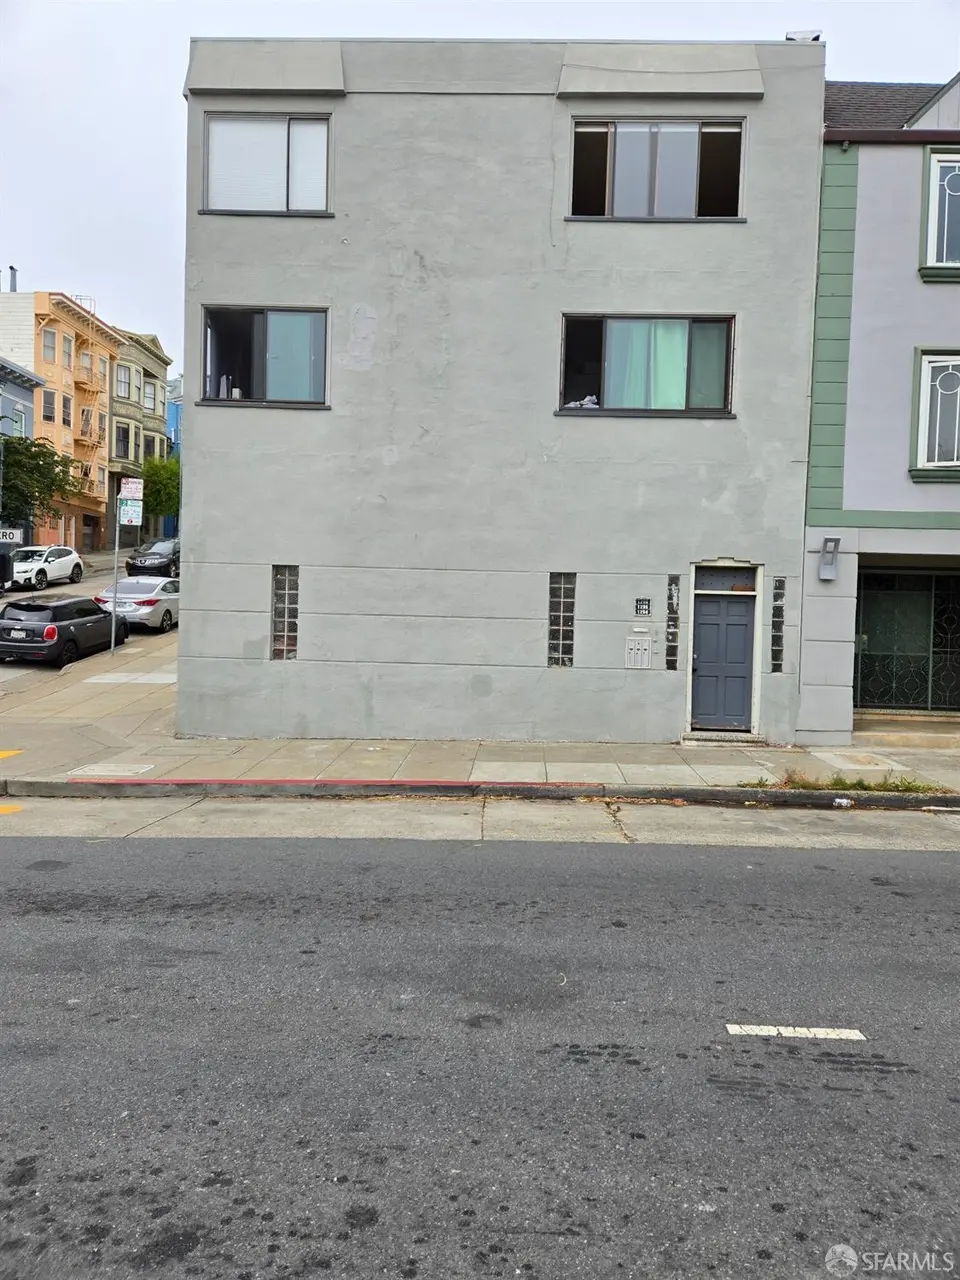
1294 Guerrero St · San Francisco, CA
Flood risk 1/10 · Minimal
- FEMA flood zone
- X (unshaded)
- Chance of flooding over 30 yrs
- 0.0%
- Est. flood insurance / yr
- $507 – $1,088
Fire risk 1/10 · Minimal
- Est. fire insurance / yr
- $659 – $1,223
Heat risk 2/10 · Minimal
- Hot days now (above 78°F)
- 8 days/yr
- Hot days in 30 yrs
- 19 days/yr
Wind risk 1/10 · Minimal
- Chance of severe wind over 30 yrs
- —
Air-quality risk 8/10 · Major
- Unhealthy air days now
- 15 days/yr
- Unhealthy air days in 30 yrs
- 15 days/yr
Risk factors via First Street. Map © Google.
Why this score? — see what drove the D grade
The composite is a weighted blend of 9 inputs, each scored 0–100. Each bar is that input's sub-score; the figure is the points it added to the 100-point composite (weight × sub-score).
- ARV discount +11.1/15.0
- Cash flow +9.5/30.0
- Rent growth +5.0/5.0
- Schools +5.0/10.0
- Livability +3.8/5.0
- 1% rule +2.9/10.0
- DSCR +2.7/10.0
- Condition / age +2.2/5.0
- Appreciation +0.0/10.0
$1,749,000
🖨 Deal sheet (PDF) 📄 Offer letter ✓ Due diligence
Multi-family units
County records classify this as Multi-Family (2-4 Unit). Listing-text estimate: 1 unit. estimate disagrees with records
Listing remarks MLS
Good opportunity for Investors/Owner users to own this solid 2 story Building in the vibrant 24th & Valencia Streets area. it consists of 2 1br/1ba units and 1 2br/1ba unit, plus an unwarranted In-Law unit, attached 2 car parking garage and a backyard.
Key facts
- Backyard
- 2 story building
- 1,916 sq ft lot
Tags
Neighborhood map
What this means for you Summary
Snapshot
- This is a 9-bed/3.0-bath multifamily listed at $1.75M. Condition is rated fair.
Deal economics
- At list price, monthly cash flow is $-1k ($-15k/yr) — negative.
- To cash-flow at today's rent, offer at most $1.57M (10.0% below list).
- To meet the 1% rule (rent ≥ 1% of price), the offer needs to be $1.38M (21.3% below list).
- Recommended offer: $1.38M (21.3% below list) — sets the bar for 1% rule.
- Cap rate 5.5% vs local median 2.1% in San Francisco — top-decile yield for the area; either an underpriced asset or a hidden risk that comps aren't pricing in. Stress-test before assuming the spread holds.
Location & tenants
- Location reads 76/100 on livability (#90 in CA, #3,143 nationally) — a middle-class / working-renter tenant base. Strengths: amenities A+, commute A+, employment A+; Watch: crime F, cost of living F.
- San Francisco Unified (urban): math 50% / reading 56% proficiency, ranked #322 of 1,400 in CA (top 23%) — acceptable for families but not a draw, mixed tenant base, ~2y average lease.
- Zoned schools: Lilienthal (Claire) Elementary (669 students, 19% FRL); Giannini (A.P.) Middle (1,192 students, 34% FRL); Lowell High (2,632 students, 37% FRL) — zoned schools average 30% FRL vs 49% district-wide (19 pts lower); this property's tenant base skews higher-income than the district average.
- Market conditions: Rents rising fast (+14.5%/yr); 162 active listings in the ZIP; high-income renter base; 750 units permitted in San Francisco County in 2024 (688 in 5+ unit buildings).
- At $13,763/mo this rent would consume 104% of the median local household income ($158k/yr) (locally 2732% of renters already pay >50% of income on rent) — very limited rent-growth headroom before tenants either downsize or default.
Forward outlook
- Local home prices are declining (-3.0%/yr); year-one equity from $12k of loan paydown is wiped out by about $52k of value loss. Plan a longer hold.
- San Francisco County population projected at +39% by 2050 — long-run rental-demand tailwind backs the buy-and-hold thesis.
Negotiation context
- It's been on market 292 days — a 12% lower offer ($1.54M) is reasonable based on typical stale-listing flexibility.
- 4 sale attempts since 9y ago; this cycle's ask has dropped $140k (7%) from the opening price — seller is motivated, your offer sets the floor, not the list.
Risks & watch-outs
- Watch-outs: built in 1948 — expect roof / HVAC / electrical / plumbing capex.
Questions for the listing agent
- What do current leases actually rent for vs. the listed asking? Can we see a recent rent roll and the last 12 months of T-12 income?
- It's been on market 292 days. Have you received any prior offers? Is the seller open to a 21% concession, seller financing, or rate buy-down credit?
- Have any recent inspections been done? Can we get a copy of the seller's disclosures and any deferred-maintenance estimates?
- Built in 1948 — when were the roof, HVAC, electrical panel, plumbing, and water heater last replaced?
- Why hasn't it sold? Are there any deal-killer items the seller is aware of (foundation, flood, title, zoning, code violations)?
- Is there a deadline driving the sale (1031 exchange, divorce, estate, relocation)? That informs how much negotiation room exists.
- Schools are B-rated — typically a magnet for longer-tenancy family renters. What's the average tenant stay here, and is there a school-zone premium baked into asking?
- Crime grade is F in this area — have there been break-ins, vandalism, or insurance claims at this property in the last 3 years? What carrier currently insures it and at what premium?
- The area grade is low — what's the realistic commute time and amenity access for the typical tenant pool here? Any planned neighborhood developments (good or bad) we should know about?
- What's the average days-on-market for RENTAL listings here right now (not sales)? A rising rental-DOM trend means longer vacancies and softer asking-rent achievability than the comps imply.
- What's the recent tenant-quality profile in this submarket — average credit score on applications, eviction rate, late-payment / NSF rate, and stable-employment percentage? A property-management company in the area should have these aggregated.
- How much new apartment / multifamily construction is in the pipeline within 1–3 miles? Heavy new supply (>2% of stock underway) typically softens rents 12–24 months out; light construction supports rent growth.
Investment metrics
- 1% rule
- 0.79% ✗
- Cap rate
- 5.46%
- Cash-on-cash
- -2.98%
- DSCR
- 0.87
- GRM
- 10.6
CMA / ARV
- ARV (median comp)
- $1,899,329
- List price
- $1,749,000
- Delta
- -7.91%
- Verdict
- FAIR
- Comps
- 20 within 1.0 mi
Show comp detail 5 sales within ~0.75 mi
| Address | Dist | Beds/Ba | Sqft | Sold | Price | $/sf | Match |
|---|---|---|---|---|---|---|---|
| 3779-3781 25th St | 0.09mi | 9/3.0 | 3,100 (+8%) | 7mo | $2,285,000 | $737 | 78 |
| 1330 Valencia St | 0.13mi | 8/3.0 (-1) | 2,612 (-9%) | 20mo | $1,250,000 | $479 | 57 |
| 828-830 Treat Ave | 0.67mi | 8/3.0 (-1) | 2,800 (-3%) | 7mo | $1,060,000 | $379 | 53 |
| 385 29th St | 0.57mi | 8/4.0 (-1) | 2,762 (-4%) | 20mo | $1,835,000 | $664 | 41 |
| 385 29th St | 0.57mi | 8/4.0 (-1) | 2,762 (-4%) | 20mo | $1,835,000 | $664 | 41 |
Match score weights: distance 35% · size 25% · config 20% · recency 20%. Top-matched comps best support the ARV.
Projected returns pro-forma
-3.0% appreciation · 8.0% rent growth · sell at horizon
- IRR
- -15.8%
- Equity multiple
- 0.41×
- Total profit
- $-287,803
- Equity at exit
- $260,782
- IRR
- -0.4%
- Equity multiple
- 0.96×
- Total profit
- $-18,303
- Equity at exit
- $151,222
Cash invested: $489,720 (down + closing). Projections, not guarantees.
Landlord ↔ Tenant lean methodology
- Overall (CITY)
- 0 Strongly Tenant-Friendly
- State California
- 18 Strongly Tenant-Friendly · D+13
- County
- — inherits STATE
- City San Francisco
- 0 Strongly Tenant-Friendly · D+57
ZIP-level market 94110
- Rents YoY
- 14.5%
- Active inventory
- 162
- Price-to-rent
- 32.8×
Monthly cashflow live
- Estimated rent
- $13,763 high interval (Pro) →
- Mortgage (P&I)
- −$9,172
- Tax est. 1.5%
- −$2,186 /mo · $26,235/yr
- Insurance
- −$729
- HOA
- −$0
- Vacancy / Maint / Mgmt
- −$2,890
- Net cashflow
- $-1,214
Break-even live
Sensitivity live
| Price | -10% $-5 | -5% $-610 | +0% $-1,214 | +5% $-1,819 | +10% $-2,423 |
|---|---|---|---|---|---|
| Rent | -10% $-2,301 | -5% $-1,758 | +0% $-1,214 | +5% $-671 | +10% $-127 |
| Rate | -1.0pp $-333 | -0.5pp $-769 | base $-1,214 | +0.5pp $-1,667 | +1.0pp $-2,128 |
3-unit breakdown (identical units grouped — click to expand)
| Units | Beds | Baths | Est. rent |
|---|---|---|---|
| 2× units | 1 | 1 | $8,884 |
| #1 | 1 | 1 | $4,442 |
| #2 | 1 | 1 | $4,442 |
| 1× unit | 2 | 1 | $4,879 |
| Total (3 units) | $13,763 | ||
UW: 25.0% down · 7.5% · 30yr · 1.5% tax · 5.0% vac · 8.0% maint · 8.0% mgmt
Financing live
Cash to close
- Down payment
- $437,250
- Closing costs
- $52,470
- Reserves months
- —
- Total cash needed
- —
Loan-product check · same deal, 3 products live
Conventional
25% down · 7.5% · 30yr
- Down + closing
- —
- Monthly P&I
- —
- Monthly cashflow
- —
- DSCR
- —
- Eligible?
- —
Personal DTI + credit; lowest rate.
DSCR
20% down · 8.5% · 30yr
- Down + closing
- —
- Monthly P&I
- —
- Monthly cashflow
- —
- DSCR
- —
- Eligible?
- —
No personal income docs; deal must DSCR.
Hard money
10% down · 12.0% · 12mo
- Down + closing
- —
- Monthly P&I
- —
- Monthly cashflow
- —
- DSCR
- —
- Eligible?
- —
Short-term bridge; refi at stabilization.
Listing history 26 events
-
2026-06-21days on market $1,749,000 Active 292 DOM
-
2026-06-18days on market $1,749,000 Active 289 DOM
-
2026-06-17days on market $1,749,000 Active 288 DOM
-
2026-06-16days on market $1,749,000 Active 287 DOM
-
2026-06-15days on market $1,749,000 Active 286 DOM
-
2026-06-13days on market $1,749,000 Active 284 DOM
-
2026-06-13days on market $1,749,000 Active 283 DOM
-
2026-06-09days on market $1,749,000 Active 280 DOM
-
2026-06-08days on market $1,749,000 Active 279 DOM
-
2026-06-07days on market $1,749,000 Active 278 DOM
-
2026-06-04days on market $1,749,000 Active 275 DOM
-
2026-06-03days on market $1,749,000 Active 274 DOM
-
2026-06-02days on market $1,749,000 Active 273 DOM
-
2026-06-01days on market $1,749,000 Active 272 DOM
-
2026-05-31days on market $1,749,000 Active 271 DOM
-
2025-10-21price $1,749,000 258-char remark
Show marketing remark (258 chars)
Good opportunity for Investors/Owner users to own this solid 2 story Building in the vibrant 24th & Valencia Streets area. it consists of 2 1br/1ba units and 1 2br/1ba unit, plus an unwarranted In-Law unit, attached 2 car parking garage and a backyard.
-
2025-09-02$1,889,000 Active 258-char remark
Show marketing remark (258 chars)
Good opportunity for Investors/Owner users to own this solid 2 story Building in the vibrant 24th & Valencia Streets area. it consists of 2 1br/1ba units and 1 2br/1ba unit, plus an unwarranted In-Law unit, attached 2 car parking garage and a backyard.
-
2018-06-09historical
-
2018-06-07price $1,695,000
-
2018-02-19$1,799,000 Active
-
2017-11-24historical
-
2017-10-09price $1,889,000
-
2017-08-27$1,989,000 Active
-
2017-07-07historical
-
2017-06-09price $2,368,000
-
2017-04-26$2,969,000 Active
ⓘ Source: listings_history table (triggers on properties + properties_extension) + one-shot
backfill from property_details.listing_events for pre-trigger history.
Climate risk First Street
- Flood 1/10 Low FEMA zone X (unshaded) · 0% chance over 30 yrs
- Wildfire 1/10 Low
- Heat 2/10 Low 8 d/yr ≥78°F today · 19 d/yr by 30 yrs out
- Wind 1/10 Low
- Air quality 8/10 Severe 15 unhealthy d/yr today · 15 by 30 yrs out
Nearby sold comps map
Loading sold comps map…
Walkable amenities ~0.75 mi
Loading nearby amenities…
Taxation est. · year 1
- Rental income
- $165,156
- − Mortgage interest
- −$97,971
- − Property taxes
- −$26,235
- − Insurance
- −$8,745
- − Repairs & maintenance
- −$13,212
- − Management
- −$13,212
- − Depreciation
- −$50,880
- Taxable loss
- −$45,100
- Est. tax savings @ 24.0%
- +$10,824
- After-tax cash flow
- $-3,746/yr
For passive investors: Depreciation is non-cash, so a rental often shows a tax loss while cash-flowing — sheltering income. Rental losses are passive: they offset passive income freely, and up to $25,000/yr can offset ordinary (W-2) income if you actively participate and your MAGI is under $100k (phasing out to $0 by $150k); unused losses carry forward. On sale, claimed depreciation is recaptured at up to 25%, and gains may owe capital-gains tax (a 1031 exchange can defer both). Figures are a year-1 estimate at your 24.0% rate — not tax advice; consult a CPA.
Condition & rehab AI · 8 photos
This multi-family property requires moderate renovations to improve its curb appeal and interior aesthetics, which would significantly increase its resale and rental value.
Repairs flagged
- Major exterior paint — Significant discoloration and wear
- Major interior paint — Chipping and peeling
- Moderate kitchen cabinets — Older style and worn
- Moderate bathroom fixtures — Standard fixtures with some wear
- Moderate flooring — Worn and dated appearance
- Moderate HVAC systems — Standard systems with some wear
Value-add opportunities
- Both Paint exterior and interior — Enhances curb appeal and interior aesthetics
- Both Replace kitchen cabinets — Modernizes the kitchen and adds value
- Both Upgrade bathroom fixtures — Improves functionality and aesthetics
- Both Replace worn flooring — Enhances comfort and appearance
- Both Service HVAC systems — Ensures comfort and energy efficiency
Renovation cost estimate screening
| Repair item | Severity | Est. cost |
|---|---|---|
| exterior paint · Significant discoloration and wear | Major | $15,000–50,000 |
| interior paint · Chipping and peeling | Major | $15,000–50,000 |
| kitchen cabinets · Older style and worn | Moderate | $3,000–15,000 |
| bathroom fixtures · Standard fixtures with some wear | Moderate | $3,000–15,000 |
| flooring · Worn and dated appearance | Moderate | $3,000–15,000 |
| HVAC systems · Standard systems with some wear | Moderate | $3,000–15,000 |
| Total estimated repair cost · 6 items | $42,000–160,000 |
Value-add ROI direction
- Both Paint exterior and interior — Enhances curb appeal and interior aesthetics ↑
- Both Replace kitchen cabinets — Modernizes the kitchen and adds value ↑
- Both Upgrade bathroom fixtures — Improves functionality and aesthetics ↑
- Both Replace worn flooring — Enhances comfort and appearance ↑
- Both Service HVAC systems — Ensures comfort and energy efficiency ↑
ⓘ Cost ranges are severity-bucket heuristics (US national rule-of-thumb). Get contractor quotes + a written scope before underwriting a rehab budget.
Schools (NCES district)
- District
- San Francisco Unified
- NCES district ID
- 0634410
- Math proficiency
- 50% ▬ 0.00%
- Reading proficiency
- 56% ▲ 1.00%
- Median HH income
- $81,249
- Composite
- 50.14/100
- National rank
- #4088
- State rank
- #322 of 1400 in CA
Livability — San Francisco
- Score
- 76/100
- State rank
- #90
- US rank
- #3143
Category grades
Schools grade is shown separately in the Schools card above.
Census & demographics
- Census place
- San Francisco, CA
- County
- San Francisco County · 827,552 people
- City population
- 827,552
- Metro
- San Francisco-Oakland-Berkeley, CA
- Population (ZIP)
- 66,865
- Household income
- $158,351
- Rent vs Own
- Severe rent burden
- 2732.0
Population outlook (San Francisco County) Hauer SSP2
- Today (2025)
- 1,030,936 people
- By 2030
- 1,110,409 · +7.7%
- By 2040
- 1,270,010 · +23.2%
- By 2050
- 1,435,001 · +39.2%
- By 2075
- 1,779,074 · +72.6%
- By 2100
- 1,966,767 · +90.8%
Race, ethnicity, and origin ACS 2023
- Neighborhood character
- Highly diverse neighborhood (Simpson 0.70)
- Race & ethnicity
- White 41% Hispanic / Latino 32% Asian 16% Two or more races 15% Black 4% Native American 1%
- Hispanic origin (detail)
- Mexican 16% Puerto Rican 1%
- Common ancestry
- Lithuanian 3% Italian 2% Romanian 2%
- Foreign-born
- 28% · Canada, China, Vietnam
- Languages at home
- 58% English-only · Spanish 27% Chinese 5% Other Indo-European 2%
Political lean MEDSL · San Francisco
- 2024 margin
- Solid D (+64.8) · D 80.3% · R 15.5% · Other 4.1%
- 2008→2024 swing
- -5.7pp toward R · 2008: 70.5pp · 2024: 64.8pp
- All cycles
- 2024: D+64.8 2020: D+72.5 2016: D+76.1 2012: D+70.2 2008: D+70.5
Not yet ingested
- Civics
- —
Market trends
- HPI YoY
- ▼ -1385.62%
- Current HPI
- 267.2424
- Rent YoY
- ▲ 14.54%
- Metro
- San Francisco-Oakland-Berkeley, CA
- State GDP YoY
- ▲ 3.21%
- F500 in state
- 116
Industry mix (Fortune 500 HQ in CA)
| Industry | F500 HQs | Revenue |
|---|---|---|
| Technology | 27 | $1,492B |
|
||
| Financial Services | 3 | $174B |
|
||
| Retail | 3 | $44B |
|
||
| Insurance | 3 | $26B |
|
||
| Media / Entertainment | 2 | $115B |
|
||
| Pharmaceuticals / Biotech | 2 | $62B |
|
||
Price history
-41.1% since first listed11 events — show timeline
- 2025-10-21 Price Changed $1,749,000 San Francisco MLS
- 2025-09-02 Listed $1,889,000 San Francisco MLS
- 2018-06-09 Delisted — San Francisco MLS
- 2018-06-07 Price Changed $1,695,000 San Francisco MLS
- 2018-02-19 Listed $1,799,000 San Francisco MLS
- 2017-11-24 Delisted — San Francisco MLS
- 2017-10-09 Price Changed $1,889,000 San Francisco MLS
- 2017-08-27 Listed $1,989,000 San Francisco MLS
- 2017-07-07 Delisted — San Francisco MLS
- 2017-06-09 Price Changed $2,368,000 San Francisco MLS
- 2017-04-26 Listed $2,969,000 San Francisco MLS
Cash-flow waterfall
monthlySold comps — $/sqft
last 12 mo · ≤1 miLoading sold comps…