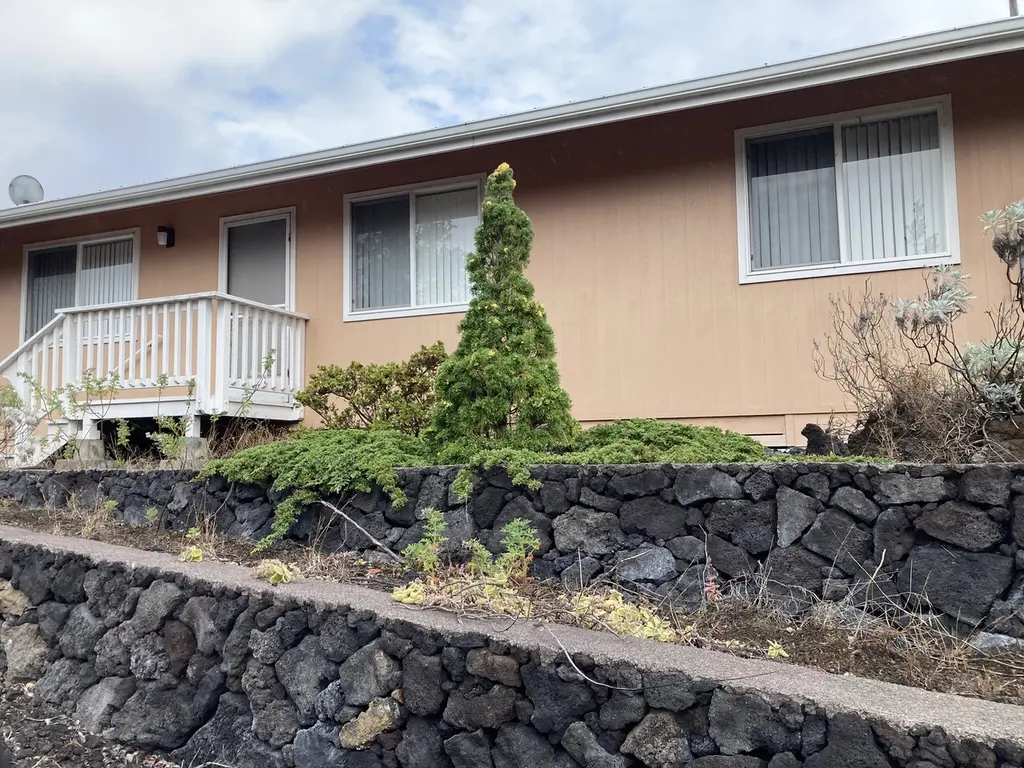
92-8270 Pineapple Pkwy · Hawaiian Ocean View, HI
Flood risk 1/10 · Minimal
- FEMA flood zone
- X (unshaded)
- Chance of flooding over 30 yrs
- 0.0%
- Est. flood insurance / yr
- $507 – $1,088
Fire risk No data
- Est. fire insurance / yr
- —
Heat risk No data
- Hot days now (above threshold)
- —
- Hot days in 30 yrs
- —
Wind risk No data
- Chance of severe wind over 30 yrs
- —
Air-quality risk 1/10 · Minimal
- Unhealthy air days now
- —
- Unhealthy air days in 30 yrs
- —
Risk factors via First Street. Map © Google.
Why this score? — see what drove the D- grade
The composite is a weighted blend of 9 inputs, each scored 0–100. Each bar is that input's sub-score; the figure is the points it added to the 100-point composite (weight × sub-score).
- ARV discount +15.0/15.0
- Cash flow +6.4/30.0
- Appreciation +5.0/10.0
- Schools +3.7/10.0
- Rent growth +2.5/5.0
- Condition / age +2.5/5.0
- Livability +2.4/5.0
- 1% rule +1.6/10.0
- DSCR +0.7/10.0
$320,000
🖨 Deal sheet 📄 Offer letter ✓ Due diligence
Listing remarks MLS
Motivated Seller!! This si a great starter home or retirement house with spacious vaulted ceiling in the living dining area with gas fireplace Three bedrooms, 2 Full baths and a big spacious lanai looking out at sweeping coastline ocean views. New carpet throughout. Freshly painted inside and out New fridge. Covered carport and 10,000 water tank, Dont miss this great house! Sold As IS
Key facts
- 1 acre lot
- Built 1996
- Listed 91 days
Neighborhood map
What this means for you Summary
Snapshot
- This is a 3-bed/2.0-bath single-family listed at $320k.
Deal economics
- At list price, monthly cash flow is $-552 ($-7k/yr) — negative.
- To cash-flow at today's rent, offer at most $240k (25.0% below list).
- To meet the 1% rule (rent ≥ 1% of price), the offer needs to be $210k (34.4% below list).
- Recommended offer: $210k (34.4% below list) — sets the bar for 1% rule.
Location & tenants
- Location reads 48/100 on livability (#151 in HI) — a working-class tenant base; expect higher turnover. Watch: housing C-, health & safety C-, schools D.
- Hawaii Department Of Education (suburban): math 32% / reading 50% proficiency, ranked #1 of 1 in HI (top 100%) — families likely to look elsewhere, expect single-tenant / working-renter base with shorter leases.
- Market conditions: 247 active listings in the ZIP; 1 comparable units currently listed for rent nearby; 982 units permitted in Hawaii County in 2024 (0 in 5+ unit buildings).
Forward outlook
- In year one you build about $12k of equity ($2k loan paydown + $10k appreciation (3.0% local appreciation)).
- Hawaii County population projected at +24% by 2050 — long-run rental-demand tailwind backs the buy-and-hold thesis.
- By year 4, paydown + projected appreciation supports a ~$40k cash-out refi (75% LTV) — recoverable capital for the next deal without selling this one.
Negotiation context
- It's been on market 91 days — a 9% lower offer ($291k) is reasonable based on typical stale-listing flexibility.
- 4 sale attempts since 2y ago with the ask held roughly flat each time — persistent listings suggest the price (not the market) is what's stuck; bring a comps-based counter.
Questions for the listing agent
- What do current leases actually rent for vs. the listed asking? Can we see a recent rent roll and the last 12 months of T-12 income?
- It's been on market 91 days. Have you received any prior offers? Is the seller open to a 34% concession, seller financing, or rate buy-down credit?
- Why hasn't it sold? Are there any deal-killer items the seller is aware of (foundation, flood, title, zoning, code violations)?
- Is there a deadline driving the sale (1031 exchange, divorce, estate, relocation)? That informs how much negotiation room exists.
- Schools are D-rated, which usually means shorter tenancies and higher turnover. Who's the typical renter profile here, and what's been the actual vacancy rate?
- The area grade is low — what's the realistic commute time and amenity access for the typical tenant pool here? Any planned neighborhood developments (good or bad) we should know about?
- What's the average days-on-market for RENTAL listings here right now (not sales)? A rising rental-DOM trend means longer vacancies and softer asking-rent achievability than the comps imply.
- What's the recent tenant-quality profile in this submarket — average credit score on applications, eviction rate, late-payment / NSF rate, and stable-employment percentage? A property-management company in the area should have these aggregated.
- How much new for-sale + rental construction is in the pipeline within 1–3 miles? Heavy new supply typically softens prices + rents 12–24 months out; constrained supply supports both.
Investment metrics
- 1% rule
- 0.66% ✗
- Cap rate
- 4.22%
- Cash-on-cash
- -7.40%
- DSCR
- 0.67
- GRM
- 12.7
CMA / ARV
- ARV (median comp)
- $500,876
- List price
- $320,000
- Delta
- -36.11%
- Verdict
- UNDERPRICED
- Comps
- 2 within 2.0 mi
Projected returns pro-forma
3.0% appreciation · 3.0% rent growth · sell at horizon
- IRR
- 0.7%
- Equity multiple
- 1.04×
- Total profit
- $3,395
- Equity at exit
- $143,886
- IRR
- 4.5%
- Equity multiple
- 1.69×
- Total profit
- $61,490
- Equity at exit
- $221,745
Cash invested: $89,600 (down + closing). Projections, not guarantees.
Landlord ↔ Tenant lean methodology
- Overall (STATE)
- 37 Tenant-Leaning
- State Hawaii
- 37 Tenant-Leaning · D+13
- County
- — inherits STATE
- City
- — inherits STATE
ZIP-level market 96737
- Active inventory
- 247
- Price-to-rent
- 12.7×
Monthly cashflow live
- Estimated rent
- $2,100 medium interval (Pro) →
- Mortgage (P&I)
- −$1,678
- Tax est. 1.5%
- −$400 /mo · $4,800/yr
- Insurance
- −$133
- HOA
- −$0
- Vacancy / Maint / Mgmt
- −$441
- Net cashflow
- $-552
Break-even live
UW: 25.0% down · 7.5% · 30yr · 1.5% tax · 5.0% vac · 8.0% maint · 8.0% mgmt
Financing live
Cash to close
- Down payment
- $80,000
- Closing costs
- $9,600
- Reserves months
- —
- Total cash needed
- —
Loan-product check · same deal, 3 products live
Conventional
25% down · 7.5% · 30yr
- Down + closing
- —
- Monthly P&I
- —
- Monthly cashflow
- —
- DSCR
- —
- Eligible?
- —
Personal DTI + credit; lowest rate.
DSCR
20% down · 8.5% · 30yr
- Down + closing
- —
- Monthly P&I
- —
- Monthly cashflow
- —
- DSCR
- —
- Eligible?
- —
No personal income docs; deal must DSCR.
Hard money
10% down · 12.0% · 12mo
- Down + closing
- —
- Monthly P&I
- —
- Monthly cashflow
- —
- DSCR
- —
- Eligible?
- —
Short-term bridge; refi at stabilization.
Rent comps 1 comps
| Address | Beds | Baths | Sqft | Rent | $/sqft | DOM | Units | Dist |
|---|---|---|---|---|---|---|---|---|
| 92-2136 Coral Pkwy Captain Cook, HI | 2.0 | 2.5 | 1296 | $2,100 | $1.62 | 43d | 1 | 0.37mi |
Listing history 25 events
-
2026-06-17days on market $320,000 Active 91 DOM
-
2026-06-16days on market $320,000 Active 90 DOM
-
2026-06-15days on market $320,000 Active 89 DOM
-
2026-06-13days on market $320,000 Active 87 DOM
-
2026-06-13days on market $320,000 Active 86 DOM
-
2026-06-10days on market $320,000 Active 84 DOM
-
2026-06-09days on market $320,000 Active 83 DOM
-
2026-06-08days on market $320,000 Active 82 DOM
-
2026-06-07days on market $320,000 Active 81 DOM
-
2026-06-05days on market $320,000 Active 78 DOM
-
2026-06-03days on market $320,000 Active 77 DOM
-
2026-06-02days on market $320,000 Active 76 DOM
-
2026-06-01days on market $320,000 Active 75 DOM
-
2026-05-31days on market $320,000 Active 74 DOM
-
2026-04-22price $320,000 387-char remark
Show marketing remark (387 chars)
Motivated Seller!! This si a great starter home or retirement house with spacious vaulted ceiling in the living dining area with gas fireplace Three bedrooms, 2 Full baths and a big spacious lanai looking out at sweeping coastline ocean views. New carpet throughout. Freshly painted inside and out New fridge. Covered carport and 10,000 water tank, Dont miss this great house! Sold As IS
-
2026-03-18$324,000 Active 387-char remark
Show marketing remark (387 chars)
Motivated Seller!! This si a great starter home or retirement house with spacious vaulted ceiling in the living dining area with gas fireplace Three bedrooms, 2 Full baths and a big spacious lanai looking out at sweeping coastline ocean views. New carpet throughout. Freshly painted inside and out New fridge. Covered carport and 10,000 water tank, Dont miss this great house! Sold As IS
-
2025-11-08historical
-
2025-06-07price $345,000
-
2025-06-07status Active
-
2025-06-07price $339,000
-
2025-05-31historical
-
2025-03-21price $359,000
-
2025-01-17status Active
-
2025-01-11historical
-
2024-11-05$369,000 Active
ⓘ Source: listings_history table (triggers on properties + properties_extension) + one-shot
backfill from property_details.listing_events for pre-trigger history.
Climate risk First Street
- Flood 1/10 Low FEMA zone X (unshaded) · 0% chance over 30 yrs
- Air quality 1/10 Low
Nearby sold comps map
Loading sold comps map…
Walkable amenities ~0.75 mi
Loading nearby amenities…
Taxation est. · year 1
- Rental income
- $25,200
- − Mortgage interest
- −$17,925
- − Property taxes
- −$4,800
- − Insurance
- −$1,600
- − Repairs & maintenance
- −$2,016
- − Management
- −$2,016
- − Depreciation
- −$9,309
- Taxable loss
- −$12,466
- Est. tax savings @ 24.0%
- +$2,992
- After-tax cash flow
- $-3,638/yr
For passive investors: Depreciation is non-cash, so a rental often shows a tax loss while cash-flowing — sheltering income. Rental losses are passive: they offset passive income freely, and up to $25,000/yr can offset ordinary (W-2) income if you actively participate and your MAGI is under $100k (phasing out to $0 by $150k); unused losses carry forward. On sale, claimed depreciation is recaptured at up to 25%, and gains may owe capital-gains tax (a 1031 exchange can defer both). Figures are a year-1 estimate at your 24.0% rate — not tax advice; consult a CPA.
Schools (NCES district)
- District
- Hawaii Department Of Education
- NCES district ID
- 1500030
- Math proficiency
- 32% ▼ -10.00%
- Reading proficiency
- 50% ▼ -3.00%
- Median HH income
- $69,005
- Composite
- 37.07/100
- National rank
- #4504
- State rank
- #1 of 1 in HI
Livability — Hawaiian Ocean View
- Score
- 48/100
- State rank
- #151
- US rank
- #26127
Category grades
Schools grade is shown separately in the Schools card above.
Census & demographics
- Census place
- Hawaiian Ocean View, HI
- City population
- 3,781
- Population (ZIP)
- 3,781
Population outlook (Hawaii County) Hauer SSP2
- Today (2025)
- 220,733 people
- By 2030
- 232,156 · +5.2%
- By 2040
- 252,486 · +14.4%
- By 2050
- 272,703 · +23.5%
- By 2075
- 332,113 · +50.5%
- By 2100
- 398,342 · +80.5%
Race, ethnicity, and origin ACS 2023
- Neighborhood character
- Highly diverse neighborhood (Simpson 0.81)
- Race & ethnicity
- Two or more races 42% White 39% Hispanic / Latino 16% Asian 6% Pacific Islander 6% Black 1% Native American 1%
- Hispanic origin (detail)
- Mexican 6% Puerto Rican 10%
- Common ancestry
- Portuguese 5% Scotch-Irish 4% Hispanic 4%
- Foreign-born
- 6% · Canada
- Languages at home
- 75% English-only · Other Asian/Pacific 10% Spanish 3% Russian/Polish/Slavic 2%
Political lean MEDSL · Hawaii
- 2024 margin
- Strong D (+28.3) · D 63.0% · R 34.7% · Other 2.3%
- 2008→2024 swing
- -25.4pp toward R · 2008: 53.7pp · 2024: 28.3pp
- All cycles
- 2024: D+28.3 2020: D+36.2 2016: D+36.6 2012: D+51.3 2008: D+53.7
Not yet ingested
- Civics
- —
Market trends
- HPI YoY
- —
- Current HPI
- —
- Rent YoY
- —
- Metro
- —
- State GDP YoY
- —
- F500 in state
- 0
Price history
-13.3% since first listed11 events — show timeline
- 2026-04-22 Price Changed $320,000 HI Information Service
- 2026-03-18 Listed $324,000 HI Information Service
- 2025-11-08 Listing Removed — HI Information Service
- 2025-06-07 Price Changed $345,000 HI Information Service
- 2025-06-07 Relisted — HI Information Service
- 2025-06-07 Price Changed $339,000 HI Information Service
- 2025-05-31 Listing Removed — HI Information Service
- 2025-03-21 Price Changed $359,000 HI Information Service
- 2025-01-17 Relisted — HI Information Service
- 2025-01-11 Listing Removed — HI Information Service
- 2024-11-05 Listed $369,000 HI Information Service
Cash-flow waterfall
monthlySold comps — $/sqft
last 12 mo · ≤1 miLoading sold comps…