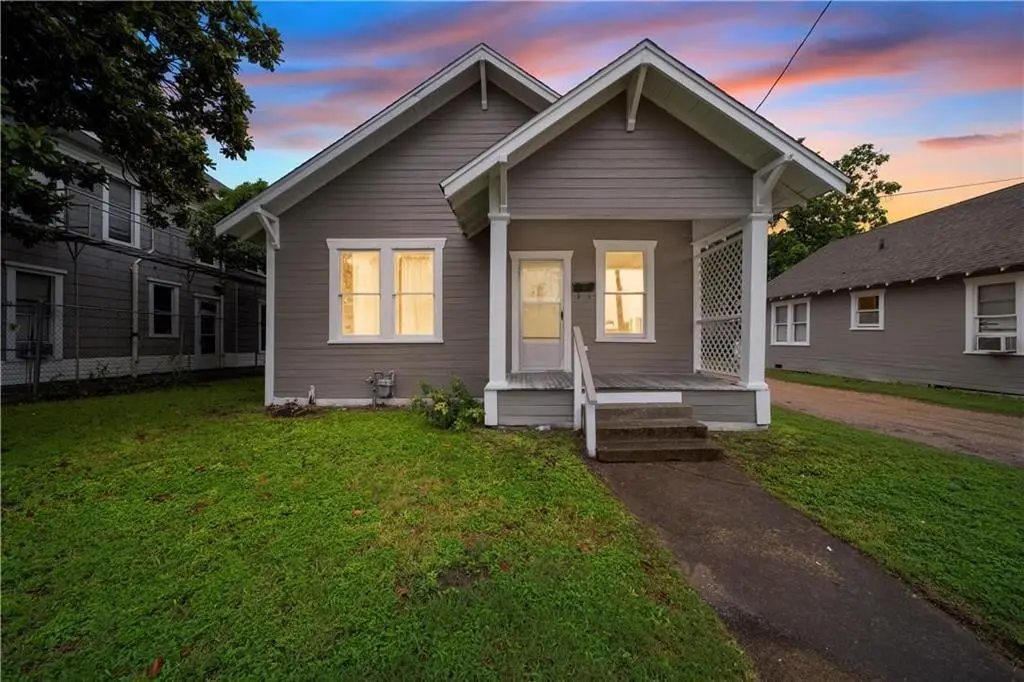
400 Live Oak St · Marlin, TX
Flood risk 1/10 · Minimal
- FEMA flood zone
- X
- Chance of flooding over 30 yrs
- 0.0%
- Est. flood insurance / yr
- $507 – $1,088
Fire risk 3/10 · Minor
- Est. fire insurance / yr
- $1,222 – $2,270
Heat risk 7/10 · Major
- Hot days now (above 108°F)
- 7 days/yr
- Hot days in 30 yrs
- 23 days/yr
Wind risk 6/10 · Moderate
- Chance of severe wind over 30 yrs
- 70.0%
Air-quality risk 1/10 · Minimal
- Unhealthy air days now
- 0 days/yr
- Unhealthy air days in 30 yrs
- 0 days/yr
Risk factors via First Street. Map © Google.
Why this score? — see what drove the D+ grade
The composite is a weighted blend of 9 inputs, each scored 0–100. Each bar is that input's sub-score; the figure is the points it added to the 100-point composite (weight × sub-score).
- Cash flow +19.3/30.0
- Appreciation +7.1/10.0
- DSCR +6.1/10.0
- 1% rule +5.7/10.0
- Livability +3.0/5.0
- Rent growth +2.5/5.0
- Condition / age +2.5/5.0
- Schools +1.7/10.0
- ARV discount +0.8/15.0
$84,999
🖨 Deal sheet (PDF) 📄 Offer letter ✓ Due diligence
Listing remarks
Lovely home nestled in the heart of Marlin, Tx. Minutes from department stores, restaurants and other popular shopping stores. Would be great for an investment property or small family. 390 Live Oak and 400 Live Oak can be packaged together.
Key facts
- 6,011 sq ft lot
- Listed 20 days
Property features AI
Finance
- Other: Lot is less than 0.5 acre (approx. 0.138 acre); Parcel/Tax info available (not included: specific tax amounts excluded)
- Financial info: Listing accepts Cash, Conventional, and VA loan; Second mortgage: No
- HOA & community: No homeowners association
Exterior
- Parking: No garage; No covered or carport spaces
- Security: No accessibility or smart home features listed
- Utilities: City water; City sewer (sewer available); Municipal utility district: No
- Home design: Single family residence; One story; Not attached to another property; Subdivision: Oakes
- Construction: Siding and stucco exterior; Composition roof; Pillar/post/pier foundation; Year built not specified
- Exterior features: Covered porch(es); Partial chain link fencing
Interior
- Kitchen: Electric water heater
- Bedrooms: 2 bedrooms (both on the main level)
- Flooring: Carpet; Wood
- Bathrooms: 2 full bathrooms
- Heating & cooling: Window unit(s) for cooling
- Interior features: One living area; One dining area; Other interior features
- Laundry & utility: No specific laundry/utility appliances listed
Neighborhood map
What this means for you Summary
Snapshot
- This is a 2-bed/2.0-bath single-family listed at $85k.
Deal economics
- At list price, monthly cash flow is $93 ($1k/yr) — positive.
- The deal already cash-flows at list — no discount required.
- Meets the 1% rule at list price ($907 rent vs $85k).
- Recommended offer: $84k (1.5% below list) — sets the bar for market timing.
- Cap rate 7.6% vs local median 5.7% in Marlin — top-decile yield for the area; either an underpriced asset or a hidden risk that comps aren't pricing in. Stress-test before assuming the spread holds.
Location & tenants
- Location reads 59/100 on livability (#1,146 in TX) — a working-class tenant base; expect higher turnover. Strengths: cost of living A+, crime B+, housing B+; Watch: amenities F, commute F, employment F.
- Marlin ISD (town): math 21% / reading 22% proficiency, ranked #779 of 826 in TX (top 94%) — low school quality limits family demand, transient renter base, plan for 1-2y turnover; 84% free/reduced lunch — lower-income household profile, screen leases tightly.
- Zoned schools: Marlin El (math 22% / reading 27%, grade F, #3,052 of 4,322 statewide, top 74%, 474 students, 99% FRL); Marlin Middle (math 22% / reading 27%, grade F, #1,279 of 1,662 statewide, top 78%, 201 students, 100% FRL); Marlin High (math 2% / reading 12%, grade F, #1,612 of 1,632 statewide, top 99%, 243 students, 99% FRL) — zoned schools average 99% FRL vs 84% district-wide (16 pts higher); higher-poverty schools than district average — tighter screening recommended.
- Market conditions: 121 active listings in the ZIP; 4 units permitted in Falls County in 2024 (0 in 5+ unit buildings).
Forward outlook
- In year one you build about $4k of equity ($587 loan paydown + $4k appreciation (4.2% local appreciation)).
- Falls County population projected at -14% by 2050 — secular population decline; favor cash flow + early exit over multi-decade hold.
- At projected returns (4.2% appreciation + 3.0% rent growth), your $24k cash investment doubles in ~5 years — after that, you're playing with house money.
- By year 8, paydown + projected appreciation supports a ~$31k cash-out refi (75% LTV) — recoverable capital for the next deal without selling this one.
Negotiation context
- It's been on market 20 days — a 2% lower offer ($84k) is reasonable based on typical stale-listing flexibility.
- 2 sale attempts since 5y ago; this cycle's ask has dropped $5k (6%) from the opening price — seller is motivated, your offer sets the floor, not the list.
Risks & watch-outs
- Climate carrying-cost: major wind risk, 70% chance of damaging wind over 30y; extreme-heat days projected 7→23/yr by 2055 (HVAC capex compounding) — expect insurance premiums to compound above CPI over the hold.
Questions for the listing agent
- Is there a deadline driving the sale (1031 exchange, divorce, estate, relocation)? That informs how much negotiation room exists.
- Schools are F-rated, which usually means shorter tenancies and higher turnover. Who's the typical renter profile here, and what's been the actual vacancy rate?
- The area grade is low — what's the realistic commute time and amenity access for the typical tenant pool here? Any planned neighborhood developments (good or bad) we should know about?
- What's the average days-on-market for RENTAL listings here right now (not sales)? A rising rental-DOM trend means longer vacancies and softer asking-rent achievability than the comps imply.
- What's the recent tenant-quality profile in this submarket — average credit score on applications, eviction rate, late-payment / NSF rate, and stable-employment percentage? A property-management company in the area should have these aggregated.
- How much new for-sale + rental construction is in the pipeline within 1–3 miles? Heavy new supply typically softens prices + rents 12–24 months out; constrained supply supports both.
Investment metrics
- 1% rule
- 1.07% ✓
- Cap rate
- 7.60%
- Cash-on-cash
- 4.68%
- DSCR
- 1.21
- GRM
- 7.8
CMA / ARV
- ARV (on-the-fly)
- $73,944
- Comps found
- 4
Show comp detail 4 sales within ~0.75 mi
| Address | Dist | Beds/Ba | Sqft | Sold | Price | $/sf | Match |
|---|---|---|---|---|---|---|---|
| 117 W Anders St W #1 | 0.70mi | 2/1.0 | 940 (+0%) | 4mo | $51,500 | $55 | 59 |
| 309 Louise St | 0.57mi | 1/1.0 (-1) | 972 (+4%) | 0mo | $99,000 | $102 | 58 |
| 213 Capps St | 0.32mi | 3/1.5 (+1) | 1,004 (+7%) | 11mo | $79,000 | $79 | 57 |
| 700 N Gresham St | 0.64mi | 3/1.0 (+1) | 920 (-2%) | 22mo | $29,500 | $32 | 40 |
Match score weights: distance 35% · size 25% · config 20% · recency 20%. Top-matched comps best support the ARV.
Projected returns pro-forma
4.17% appreciation · 3.0% rent growth · sell at horizon
- IRR
- 14.9%
- Equity multiple
- 1.91×
- Total profit
- $21,564
- Equity at exit
- $43,945
- IRR
- 15.9%
- Equity multiple
- 3.61×
- Total profit
- $62,233
- Equity at exit
- $72,562
Cash invested: $23,800 (down + closing). Projections, not guarantees.
Landlord ↔ Tenant lean methodology
- Overall (STATE)
- 87 Strongly Landlord-Friendly
- State Texas
- 87 Strongly Landlord-Friendly · R+5
- County
- — inherits STATE
- City
- — inherits STATE
ZIP-level market 76661
- Home prices YoY
- 3.4%
- Active inventory
- 121
- Price-to-rent
- 7.8×
Monthly cashflow live
- Estimated rent
- $907 medium interval (Pro) →
- Mortgage (P&I)
- −$446
- Tax from tax record
- −$143 /mo · $1,713/yr
- Insurance
- −$35
- HOA
- −$0
- Vacancy / Maint / Mgmt
- −$190
- Net cashflow
- $93
Break-even live
Sensitivity live
| Price | -10% $141 | -5% $117 | +0% $93 | +5% $69 | +10% $45 |
|---|---|---|---|---|---|
| Rent | -10% $21 | -5% $57 | +0% $93 | +5% $129 | +10% $164 |
| Rate | -1.0pp $136 | -0.5pp $114 | base $93 | +0.5pp $71 | +1.0pp $48 |
UW: 25.0% down · 7.5% · 30yr · 1.5% tax · 5.0% vac · 8.0% maint · 8.0% mgmt
Financing live
Cash to close
- Down payment
- $21,250
- Closing costs
- $2,550
- Reserves months
- —
- Total cash needed
- —
Loan-product check · same deal, 3 products live
Conventional
25% down · 7.5% · 30yr
- Down + closing
- —
- Monthly P&I
- —
- Monthly cashflow
- —
- DSCR
- —
- Eligible?
- —
Personal DTI + credit; lowest rate.
DSCR
20% down · 8.5% · 30yr
- Down + closing
- —
- Monthly P&I
- —
- Monthly cashflow
- —
- DSCR
- —
- Eligible?
- —
No personal income docs; deal must DSCR.
Hard money
10% down · 12.0% · 12mo
- Down + closing
- —
- Monthly P&I
- —
- Monthly cashflow
- —
- DSCR
- —
- Eligible?
- —
Short-term bridge; refi at stabilization.
Listing history 15 events
-
2026-06-21days on market $84,999 Active 20 DOM
-
2026-06-18days on market $84,999 Active 17 DOM
-
2026-06-17days on market $84,999 Active 16 DOM
-
2026-06-16days on market $84,999 Active 15 DOM
-
2026-06-15price $84,999 Active 14 DOM
-
2026-06-15days on market $89,999 Active 14 DOM
-
2026-06-14days on market $89,999 Active 12 DOM
-
2026-06-13days on market $89,999 Active 11 DOM
-
2026-06-10days on market $89,999 Active 9 DOM
-
2026-06-09days on market $89,999 Active 8 DOM
-
2026-06-08days on market $89,999 Active 7 DOM
-
2026-06-07days on market $89,999 Active 6 DOM
-
2026-06-03days on market $89,999 Active 2 DOM
-
2026-06-02remarks 241-char remark
-
2026-06-02$89,999 Active 1 DOM
ⓘ Source: listings_history table (triggers on properties + properties_extension) + one-shot
backfill from property_details.listing_events for pre-trigger history.
Tax reassessment forecast TX · Resets to sale price
- Current annual tax
- $1,713 · $143/mo
- Projected year-2 tax
- $1,713 · $143/mo
- Expected delta
- $0/yr ($0/mo · -0.0%)
ⓘ Screening estimate from a state-policy table — verify with the county assessor before closing.
Climate risk First Street
- Flood 1/10 Low FEMA zone X · 0% chance over 30 yrs
- Wildfire 3/10 Moderate
- Heat 7/10 Severe 7 d/yr ≥108°F today · 23 d/yr by 30 yrs out
- Wind 6/10 Major 70% chance of damaging wind over 30 yrs
- Air quality 1/10 Low 0 unhealthy d/yr today · 0 by 30 yrs out
Nearby sold comps map
Loading sold comps map…
Walkable amenities ~0.75 mi
Loading nearby amenities…
Taxation est. · year 1
- Rental income
- $10,886
- − Mortgage interest
- −$4,761
- − Property taxes
- −$1,713
- − Insurance
- −$425
- − Repairs & maintenance
- −$871
- − Management
- −$871
- − Depreciation
- −$2,473
- Taxable loss
- −$228
- Est. tax savings @ 24.0%
- +$55
- After-tax cash flow
- $1,167/yr
For passive investors: Depreciation is non-cash, so a rental often shows a tax loss while cash-flowing — sheltering income. Rental losses are passive: they offset passive income freely, and up to $25,000/yr can offset ordinary (W-2) income if you actively participate and your MAGI is under $100k (phasing out to $0 by $150k); unused losses carry forward. On sale, claimed depreciation is recaptured at up to 25%, and gains may owe capital-gains tax (a 1031 exchange can defer both). Figures are a year-1 estimate at your 24.0% rate — not tax advice; consult a CPA.
Schools (NCES district)
- District
- Marlin ISD
- NCES district ID
- 4829130
- Math proficiency
- 21% ▲ 2.00%
- Reading proficiency
- 22% ▲ 6.00%
- Median HH income
- $29,255
- Composite
- 17.18/100
- National rank
- #9106
- State rank
- #779 of 826 in TX
Livability — Marlin
- Score
- 59/100
- State rank
- #1146
- US rank
- #20161
Category grades
Schools grade is shown separately in the Schools card above.
Census & demographics
- Census place
- Marlin, TX
- Population (ZIP)
- 7,266
Population outlook (Falls County) Hauer SSP2
- Today (2025)
- 15,782 people
- By 2030
- 15,209 · -3.6%
- By 2040
- 14,276 · -9.5%
- By 2050
- 13,645 · -13.5%
- By 2075
- 13,724 · -13.0%
- By 2100
- 13,005 · -17.6%
Race, ethnicity, and origin ACS 2023
- Neighborhood character
- Highly diverse neighborhood (Simpson 0.70)
- Race & ethnicity
- Black 35% Hispanic / Latino 30% White 30% Two or more races 13% Asian 3%
- Hispanic origin (detail)
- Mexican 29%
- Common ancestry
- Romanian 2% Lithuanian 1% Italian 1%
- Foreign-born
- 7% · Canada
- Languages at home
- 84% English-only · Spanish 15%
Political lean MEDSL · Falls
- 2024 margin
- Solid R (+44.7) · D 27.3% · R 72.0%
- 2008→2024 swing
- -25.0pp toward R · 2008: -19.7pp · 2024: -44.7pp
- All cycles
- 2024: R+44.7 2020: R+37.1 2016: R+33.6 2012: R+24.4 2008: R+19.7
Not yet ingested
- Civics
- —
Market trends
- HPI YoY
- ▲ 4.17%
- Current HPI
- 126.9217
- Rent YoY
- —
- Metro
- —
- State GDP YoY
- ▲ 3.95%
- F500 in state
- 110
Industry mix (Fortune 500 HQ in TX)
| Industry | F500 HQs | Revenue |
|---|---|---|
| Energy | 16 | $1,198B |
|
||
| Technology | 5 | $198B |
|
||
| Engineering / Construction | 4 | $72B |
|
||
| Energy Services | 3 | $60B |
|
||
| Utilities | 3 | $41B |
|
||
| Healthcare | 2 | $330B |
|
||
Price history
+2.9% since first listed3 events — show timeline
- 2026-06-01 Listed $89,999 NTREIS
- 2021-11-24 Listing Removed — NTREIS
- 2021-06-09 Listed $87,500 NTREIS
Property tax history
+16.0%/yrLatest (2025): $1,713 · +6.0% YoY. Source: county tax records.
Cash-flow waterfall
monthlySold comps — $/sqft
last 12 mo · ≤1 miLoading sold comps…