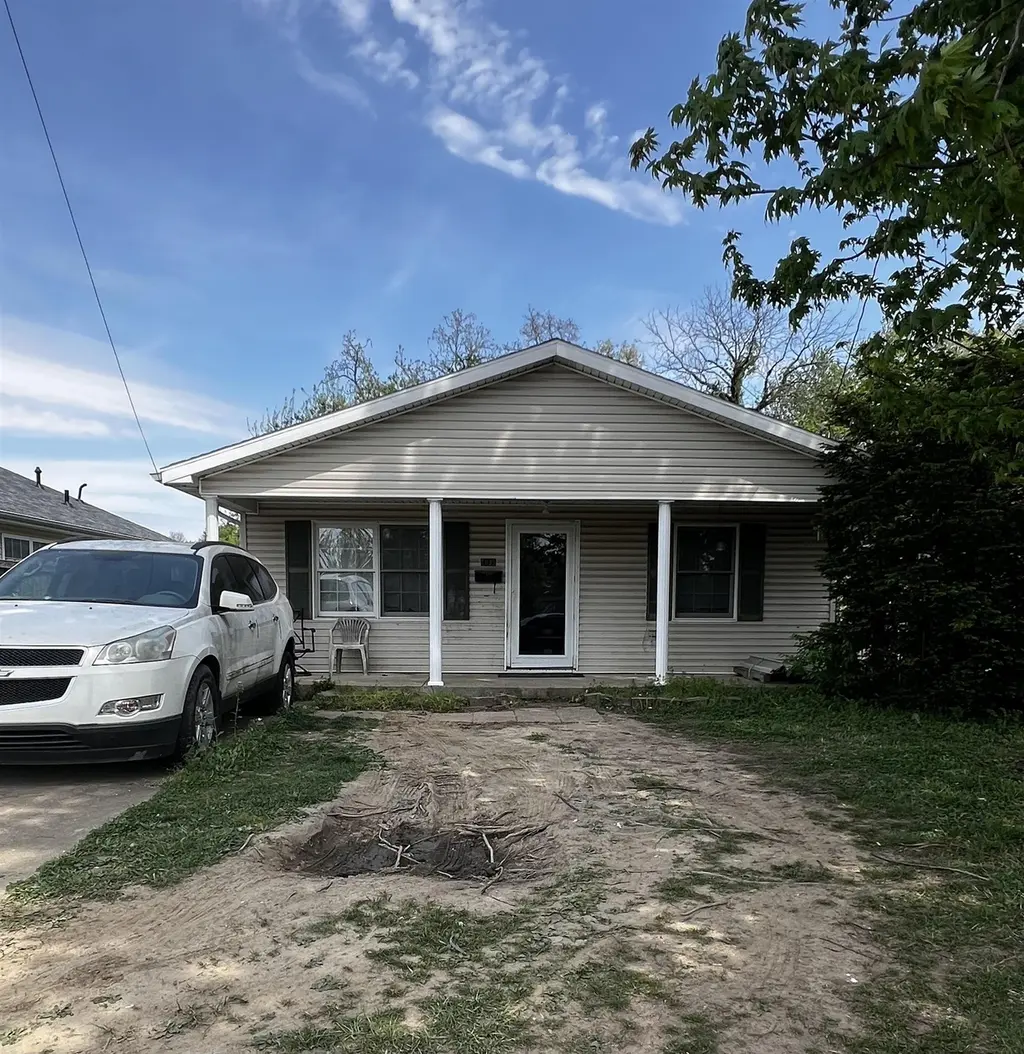
1035 W 8th St · Owensboro, KY
Flood risk 1/10 · Minimal
- FEMA flood zone
- X (unshaded)
- Chance of flooding over 30 yrs
- 0.0%
- Est. flood insurance / yr
- $507 – $1,088
Fire risk 1/10 · Minimal
- Est. fire insurance / yr
- $839 – $1,559
Heat risk 5/10 · Moderate
- Hot days now (above 107°F)
- 7 days/yr
- Hot days in 30 yrs
- 19 days/yr
Wind risk 2/10 · Minimal
- Chance of severe wind over 30 yrs
- 3.0%
Air-quality risk 3/10 · Minor
- Unhealthy air days now
- 2 days/yr
- Unhealthy air days in 30 yrs
- 3 days/yr
Risk factors via First Street. Map © Google.
Why this score? — see what drove the B+ grade
The composite is a weighted blend of 9 inputs, each scored 0–100. Each bar is that input's sub-score; the figure is the points it added to the 100-point composite (weight × sub-score).
- Cash flow +30.0/30.0
- ARV discount +15.0/15.0
- 1% rule +10.0/10.0
- DSCR +10.0/10.0
- Livability +3.6/5.0
- Schools +2.6/10.0
- Rent growth +2.5/5.0
- Condition / age +2.5/5.0
- Appreciation +0.0/10.0
$89,900
🖨 Deal sheet 📄 Offer letter ✓ Due diligence
Listing remarks MLS
Investor opportunity! This 3 bedroom, 1.5 bath home, built in 2002, offers great potential with a spacious backyard and central Owensboro location. Property is being sold AS IS and is ideal for buyers looking to renovate or add to their investment portfolio. Potential downpayment assistance grant through the City of Owensboro - Buyer will need to verify.
Key facts
- Spacious backyard
- Built 2001
- Listed 22 days
Tags
Neighborhood map
What this means for you Summary
Snapshot
- This is a 3-bed/2.0-bath single-family listed at $90k.
Deal economics
- At list price, monthly cash flow is $547 ($7k/yr) — positive.
- The deal already cash-flows at list — no discount required.
- Meets the 1% rule at list price ($1k rent vs $90k).
- Recommended offer: $89k (1.5% below list) — sets the bar for market timing.
- Cap rate 13.6% vs local median 3.1% in Owensboro — top-decile yield for the area; either an underpriced asset or a hidden risk that comps aren't pricing in. Stress-test before assuming the spread holds.
Location & tenants
- Location reads 71/100 on livability (#148 in KY) — a middle-class / working-renter tenant base. Strengths: cost of living A+, housing A+, health & safety B; Watch: employment D+, crime D-, amenities F.
- Owensboro Independent (urban): math 27% / reading 36% proficiency, ranked #100 of 165 in KY (top 61%) — families likely to look elsewhere, expect single-tenant / working-renter base with shorter leases; 63% free/reduced lunch — lower-income household profile, screen leases tightly.
- Market conditions: 297 active listings in the ZIP; 2 comparable units currently listed for rent nearby; 226 units permitted in Daviess County in 2024 (6 in 5+ unit buildings).
Forward outlook
- Local home prices are declining (-3.0%/yr); year-one equity from $622 of loan paydown is wiped out by about $3k of value loss. Plan a longer hold.
- Daviess County population projected at +6% by 2050 — modest demand growth; plan on rents tracking national, not racing it.
- At projected returns (-3.0% appreciation + 3.0% rent growth), your $25k cash investment doubles in ~5 years — after that, you're playing with house money.
Negotiation context
- It's been on market 22 days — a 2% lower offer ($89k) is reasonable based on typical stale-listing flexibility.
- Current owner paid $55k; list at $90k implies a 63% gain — meaningful room to come down on a strong offer.
Risks & watch-outs
- Climate carrying-cost: extreme-heat days projected 7→19/yr by 2055 (HVAC capex compounding) — expect insurance premiums to compound above CPI over the hold.
Questions for the listing agent
- Is there a deadline driving the sale (1031 exchange, divorce, estate, relocation)? That informs how much negotiation room exists.
- Crime grade is D in this area — have there been break-ins, vandalism, or insurance claims at this property in the last 3 years? What carrier currently insures it and at what premium?
- What's the average days-on-market for RENTAL listings here right now (not sales)? A rising rental-DOM trend means longer vacancies and softer asking-rent achievability than the comps imply.
- What's the recent tenant-quality profile in this submarket — average credit score on applications, eviction rate, late-payment / NSF rate, and stable-employment percentage? A property-management company in the area should have these aggregated.
- How much new for-sale + rental construction is in the pipeline within 1–3 miles? Heavy new supply typically softens prices + rents 12–24 months out; constrained supply supports both.
Investment metrics
- 1% rule
- 1.51% ✓
- Cap rate
- 13.59%
- Cash-on-cash
- 26.07%
- DSCR
- 2.16
- GRM
- 5.5
CMA / ARV
- ARV (median comp)
- $112,619
- List price
- $89,900
- Delta
- -20.17%
- Verdict
- UNDERPRICED
- Comps
- 20 within 1.0 mi
Show comp detail 12 sales within ~0.75 mi
| Address | Dist | Beds/Ba | Sqft | Sold | Price | $/sf | Match |
|---|---|---|---|---|---|---|---|
| 1035 W 8th St | 0.00mi | 3/1.5 | 1,064 (0%) | 1mo | $79,000 | $74 | 97 |
| 507 Orchard St | 0.20mi | 3/2.0 | 1,120 (+5%) | 1mo | $63,000 | $56 | 81 |
| 600 Poplar St | 0.16mi | 2/1.0 (-1) | 1,064 (0%) | 6mo | $100,000 | $94 | 79 |
| 911 W 2nd St | 0.45mi | 3/1.5 | 1,020 (-4%) | 1mo | $60,000 | $59 | 69 |
| 1225 W 12th St | 0.27mi | 2/1.0 (-1) | 1,016 (-4%) | 5mo | $128,555 | $127 | 66 |
| 807 Walnut St | 0.27mi | 2/1.0 (-1) | 972 (-9%) | 2mo | $135,000 | $139 | 62 |
| 921 W 1st St | 0.52mi | 2/2.0 (-1) | 1,022 (-4%) | 4mo | $195,000 | $191 | 61 |
| 1107 W 11th St | 0.17mi | 2/1.0 (-1) | 1,220 (+15%) | 1mo | $158,000 | $130 | 58 |
| 25 Maple St | 0.54mi | 3/2.0 | 1,176 (+10%) | 3mo | $180,000 | $153 | 55 |
| 815 Allen St | 0.65mi | 2/1.0 (-1) | 1,032 (-3%) | 2mo | $122,000 | $118 | 54 |
| 1119 Independence Ave | 0.61mi | 2/1.0 (-1) | 994 (-7%) | 2mo | $115,000 | $116 | 50 |
| 1329 Allen St | 0.75mi | 3/2.0 | 1,223 (+15%) | 1mo | $188,000 | $154 | 39 |
Match score weights: distance 35% · size 25% · config 20% · recency 20%. Top-matched comps best support the ARV.
Projected returns pro-forma
-3.0% appreciation · 3.0% rent growth · sell at horizon
- IRR
- 19.8%
- Equity multiple
- 1.80×
- Total profit
- $20,227
- Equity at exit
- $13,404
- IRR
- 28.0%
- Equity multiple
- 3.48×
- Total profit
- $62,308
- Equity at exit
- $7,773
Cash invested: $25,172 (down + closing). Projections, not guarantees.
Landlord ↔ Tenant lean methodology
- Overall (STATE)
- 83 Strongly Landlord-Friendly
- State Kentucky
- 83 Strongly Landlord-Friendly · R+16
- County
- — inherits STATE
- City
- — inherits STATE
ZIP-level market 42301
- Home prices YoY
- -31.0%
- Active inventory
- 297
- Price-to-rent
- 5.5×
Monthly cashflow live
- Estimated rent
- $1,356 medium interval (Pro) →
- Mortgage (P&I)
- −$471
- Tax from tax record
- −$15 /mo · $182/yr
- Insurance
- −$37
- HOA
- −$0
- Vacancy / Maint / Mgmt
- −$285
- Net cashflow
- $547
Break-even live
UW: 25.0% down · 7.5% · 30yr · 1.5% tax · 5.0% vac · 8.0% maint · 8.0% mgmt
Financing live
Cash to close
- Down payment
- $22,475
- Closing costs
- $2,697
- Reserves months
- —
- Total cash needed
- —
Loan-product check · same deal, 3 products live
Conventional
25% down · 7.5% · 30yr
- Down + closing
- —
- Monthly P&I
- —
- Monthly cashflow
- —
- DSCR
- —
- Eligible?
- —
Personal DTI + credit; lowest rate.
DSCR
20% down · 8.5% · 30yr
- Down + closing
- —
- Monthly P&I
- —
- Monthly cashflow
- —
- DSCR
- —
- Eligible?
- —
No personal income docs; deal must DSCR.
Hard money
10% down · 12.0% · 12mo
- Down + closing
- —
- Monthly P&I
- —
- Monthly cashflow
- —
- DSCR
- —
- Eligible?
- —
Short-term bridge; refi at stabilization.
Rent comps 2 comps
| Address | Beds | Baths | Sqft | Rent | $/sqft | DOM | Units | Dist |
|---|---|---|---|---|---|---|---|---|
| 1302 Daviess St Owensboro, KY | 3.0 | 1.0 | 1008 | $1,200 | $1.19 | 21d | 1 | 0.75mi |
| 1202 Hutch Ln Unit A Owensboro, KY | 2.0 | 1.0 | 989 | $825 | $0.83 | 13d | 1 | 1.11mi |
Listing history 3 events
-
2026-05-06status Pending 356-char remark
Show marketing remark (356 chars)
Investor opportunity! This 3 bedroom, 1.5 bath home, built in 2002, offers great potential with a spacious backyard and central Owensboro location. Property is being sold AS IS and is ideal for buyers looking to renovate or add to their investment portfolio. Potential downpayment assistance grant through the City of Owensboro - Buyer will need to verify.
-
2026-04-13$89,900 Active 356-char remark
Show marketing remark (356 chars)
Investor opportunity! This 3 bedroom, 1.5 bath home, built in 2002, offers great potential with a spacious backyard and central Owensboro location. Property is being sold AS IS and is ideal for buyers looking to renovate or add to their investment portfolio. Potential downpayment assistance grant through the City of Owensboro - Buyer will need to verify.
-
2022-08-09soldstatus $55,000
ⓘ Source: listings_history table (triggers on properties + properties_extension) + one-shot
backfill from property_details.listing_events for pre-trigger history.
Tax reassessment forecast KY · Resets to sale price
- Current annual tax
- $182 · $15/mo
- Projected year-2 tax
- $773 · $64/mo
- Expected delta
- +$591/yr (+$49/mo · 324.2%)
ⓘ Screening estimate from a state-policy table — verify with the county assessor before closing.
Climate risk First Street
- Flood 1/10 Low FEMA zone X (unshaded) · 0% chance over 30 yrs
- Wildfire 1/10 Low
- Heat 5/10 Major 7 d/yr ≥107°F today · 19 d/yr by 30 yrs out
- Wind 2/10 Low 3% chance of damaging wind over 30 yrs
- Air quality 3/10 Moderate 2 unhealthy d/yr today · 3 by 30 yrs out
Nearby sold comps map
Loading sold comps map…
Walkable amenities ~0.75 mi
Loading nearby amenities…
Taxation est. · year 1
- Rental income
- $16,269
- − Mortgage interest
- −$5,036
- − Property taxes
- −$182
- − Insurance
- −$450
- − Repairs & maintenance
- −$1,301
- − Management
- −$1,301
- − Depreciation
- −$2,615
- Taxable income
- $5,383
- Est. tax owed @ 24.0%
- −$1,292
- After-tax cash flow
- $5,271/yr
For passive investors: Depreciation is non-cash, so a rental often shows a tax loss while cash-flowing — sheltering income. Rental losses are passive: they offset passive income freely, and up to $25,000/yr can offset ordinary (W-2) income if you actively participate and your MAGI is under $100k (phasing out to $0 by $150k); unused losses carry forward. On sale, claimed depreciation is recaptured at up to 25%, and gains may owe capital-gains tax (a 1031 exchange can defer both). Figures are a year-1 estimate at your 24.0% rate — not tax advice; consult a CPA.
Schools (NCES district)
- District
- Owensboro Independent
- NCES district ID
- 2104590
- Math proficiency
- 27% ▼ -16.00%
- Reading proficiency
- 36% ▼ -14.00%
- Median HH income
- $33,020
- Composite
- 25.79/100
- National rank
- #7364
- State rank
- #100 of 165 in KY
Livability — Owensboro
- Score
- 71/100
- State rank
- #148
- US rank
- #7153
Category grades
Schools grade is shown separately in the Schools card above.
Census & demographics
- Census place
- Owensboro, KY
- County
- Daviess County · 87,564 people
- City population
- 87,564
- Metro
- Owensboro, KY
- Population (ZIP)
- 45,445
- Household income
- $66,885
- Rent vs Own
- Severe rent burden
- 1228.0
Population outlook (Daviess County) Hauer SSP2
- Today (2025)
- 103,810 people
- By 2030
- 105,722 · +1.8%
- By 2040
- 108,731 · +4.7%
- By 2050
- 110,295 · +6.2%
- By 2075
- 113,056 · +8.9%
- By 2100
- 106,257 · +2.4%
Race, ethnicity, and origin ACS 2023
- Neighborhood character
- Predominantly White (82%)
- Race & ethnicity
- White 82% Black 6% Two or more races 5% Hispanic / Latino 4% Asian 3%
- Common ancestry
- Slovak 3% Italian 1% Romanian 1%
- Foreign-born
- 5% · Canada, Philippines
- Languages at home
- 92% English-only · Spanish 4% Other Asian/Pacific 2%
Political lean MEDSL · Daviess
- 2024 margin
- Solid R (+31.9) · D 33.3% · R 65.2% · Other 1.5%
- 2008→2024 swing
- -21.8pp toward R · 2008: -10.1pp · 2024: -31.9pp
- All cycles
- 2024: R+31.9 2020: R+27.9 2016: R+32.2 2012: R+21.1 2008: R+10.1
Not yet ingested
- Civics
- —
Market trends
- HPI YoY
- ▼ -106.96%
- Current HPI
- 238.2395
- Rent YoY
- —
- Metro
- Owensboro, KY
- State GDP YoY
- ▲ 1.81%
- F500 in state
- 4
Industry mix (Fortune 500 HQ in KY)
| Industry | F500 HQs | Revenue |
|---|---|---|
| Healthcare | 1 | $118B |
|
||
| Food / Beverage | 1 | $7B |
|
||
Price history
+63.5% since first listed3 events — show timeline
- 2026-05-06 Pending — GORAMLS
- 2026-04-13 Listed $89,900 GORAMLS
- 2022-08-09 Sold (Public Records) $55,000 Public Records
Property tax history
-16.3%/yrLatest (2025): $182 · -3.3% YoY. Source: county tax records.
Cash-flow waterfall
monthlySold comps — $/sqft
last 12 mo · ≤1 miLoading sold comps…