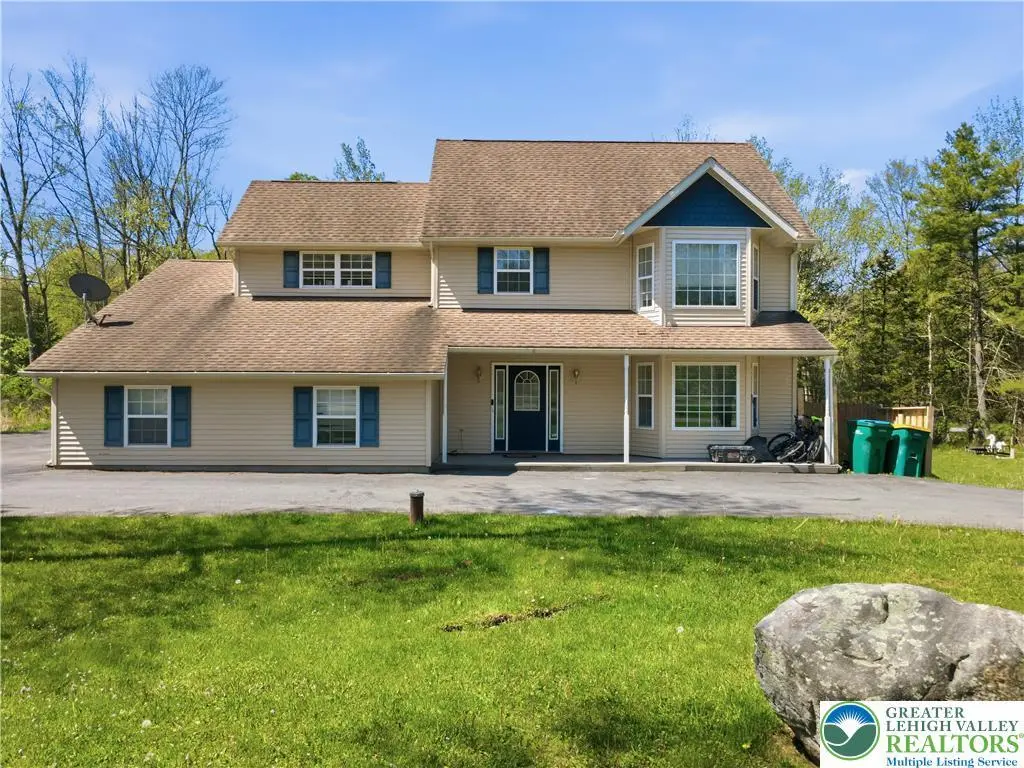
155 Cranberry Dr · Holiday Pocono, PA
Flood risk 4/10 · Minor
- FEMA flood zone
- X (unshaded)
- Chance of flooding over 30 yrs
- 0.22%
- Est. flood insurance / yr
- $507 – $1,088
Fire risk 3/10 · Minor
- Est. fire insurance / yr
- $511 – $949
Heat risk 2/10 · Minimal
- Hot days now (above 89°F)
- 7 days/yr
- Hot days in 30 yrs
- 16 days/yr
Wind risk 3/10 · Minor
- Chance of severe wind over 30 yrs
- 6.0%
Air-quality risk 2/10 · Minimal
- Unhealthy air days now
- 1 days/yr
- Unhealthy air days in 30 yrs
- 1 days/yr
Risk factors via First Street. Map © Google.
Why this score? — see what drove the F grade
The composite is a weighted blend of 9 inputs, each scored 0–100. Each bar is that input's sub-score; the figure is the points it added to the 100-point composite (weight × sub-score).
- Cash flow +9.6/30.0
- Appreciation +5.2/10.0
- Schools +4.0/10.0
- Livability +2.9/5.0
- 1% rule +2.8/10.0
- DSCR +2.7/10.0
- Rent growth +2.5/5.0
- Condition / age +2.5/5.0
- ARV discount +0.0/15.0
$435,000
🖨 Deal sheet 📄 Offer letter ✓ Due diligence
Listing remarks
Large contemporary home in Greenwood Acres! This 4-bedroom, 3-bath property offers flexibility in one of the area’s least restrictive communities. Features include a private well and septic, open yard with natural privacy, storage shed, spacious family room, large kitchen with dining area, primary suite, walk-up attic, rear deck, and garage. Conveniently located near popular vacation destinations, with short-term rental potential.
Key facts
- Private well
- Natural privacy
- Septic
Tags
Property features AI
Finance
- HOA & community: Annual association fee of $600
Exterior
- Parking: 2-car garage; Driveway; Off-street parking; Parking garage
- Utilities: Well water; Septic tank
- Home design: 2 stories; Vinyl siding; Asphalt/fiberglass roof; Slab foundation
- Construction: Built with vinyl siding; Asphalt/fiberglass roof; Slab foundation
- Exterior features: R-1 zoning
Interior
- Kitchen: Dishwasher; Microwave; Refrigerator; Electric water heater
- Bathrooms: 2 full bathrooms; 1 half bathroom
- Heating & cooling: Central air; Ceiling fans; Electric baseboard heating
- Interior features: Dining area; Separate/formal dining room
Neighborhood map
What this means for you Summary
Snapshot
- This is a 4-bed/2.5-bath single-family listed at $435k.
Deal economics
- At list price, monthly cash flow is $-292 ($-4k/yr) — negative.
- To cash-flow at today's rent, offer at most $383k (11.9% below list).
- To meet the 1% rule (rent ≥ 1% of price), the offer needs to be $340k (21.8% below list).
- Recommended offer: $340k (21.8% below list) — sets the bar for 1% rule.
- Cap rate 5.5% vs local median 1.1% in Holiday Pocono — top-decile yield for the area; either an underpriced asset or a hidden risk that comps aren't pricing in. Stress-test before assuming the spread holds.
Location & tenants
- Location reads 58/100 on livability (#1,558 in PA) — a working-class tenant base; expect higher turnover. Strengths: cost of living A+; Watch: health & safety D, schools F, amenities F.
- Pocono Mountain SD (rural): math 37% / reading 55% proficiency, ranked #245 of 539 in PA (top 46%) — families likely to look elsewhere, expect single-tenant / working-renter base with shorter leases.
- Market conditions: 90 active listings in the ZIP; 1 comparable units currently listed for rent nearby; 278 units permitted in Monroe County in 2024 (52 in 5+ unit buildings).
Forward outlook
- In year one you build about $5k of equity ($3k loan paydown + $2k appreciation (0.5% local appreciation)).
- Monroe County population projected at -11% by 2050 — secular population decline; favor cash flow + early exit over multi-decade hold.
- By year 6, paydown + projected appreciation supports a ~$31k cash-out refi (75% LTV) — recoverable capital for the next deal without selling this one.
Negotiation context
- It's been on market 24 days — a 2% lower offer ($428k) is reasonable based on typical stale-listing flexibility.
- 7 sale attempts since 11y ago with the ask held roughly flat each time — persistent listings suggest the price (not the market) is what's stuck; bring a comps-based counter.
- Current owner paid $173k; list at $435k implies a 151% gain — meaningful room to come down on a strong offer.
Questions for the listing agent
- What do current leases actually rent for vs. the listed asking? Can we see a recent rent roll and the last 12 months of T-12 income?
- What does the HOA fee cover, when was the last increase, and are there any pending special assessments or reserve-fund shortfalls?
- Is there a deadline driving the sale (1031 exchange, divorce, estate, relocation)? That informs how much negotiation room exists.
- Schools are F-rated, which usually means shorter tenancies and higher turnover. Who's the typical renter profile here, and what's been the actual vacancy rate?
- The area grade is low — what's the realistic commute time and amenity access for the typical tenant pool here? Any planned neighborhood developments (good or bad) we should know about?
- What's the average days-on-market for RENTAL listings here right now (not sales)? A rising rental-DOM trend means longer vacancies and softer asking-rent achievability than the comps imply.
- What's the recent tenant-quality profile in this submarket — average credit score on applications, eviction rate, late-payment / NSF rate, and stable-employment percentage? A property-management company in the area should have these aggregated.
- How much new for-sale + rental construction is in the pipeline within 1–3 miles? Heavy new supply typically softens prices + rents 12–24 months out; constrained supply supports both.
Investment metrics
- 1% rule
- 0.78% ✗
- Cap rate
- 5.49%
- Cash-on-cash
- -2.88%
- DSCR
- 0.87
- GRM
- 10.7
CMA / ARV
- ARV (on-the-fly)
- $354,926
- Comps found
- 12
Show comp detail 12 sales within ~0.75 mi
| Address | Dist | Beds/Ba | Sqft | Sold | Price | $/sf | Match |
|---|---|---|---|---|---|---|---|
| 122 Cranberry Dr | 0.17mi | 3/2.5 (-1) | 1,856 (-2%) | 3mo | $340,000 | $183 | 81 |
| 5266 Beechwood Rd | 0.30mi | 4/3.0 | 1,882 (-1%) | 10mo | $370,000 | $197 | 75 |
| 130 Cranberry Dr | 0.14mi | 3/2.5 (-1) | 1,804 (-5%) | 12mo | $370,000 | $205 | 70 |
| 142 Driftwood Dr | 0.29mi | 3/2.0 (-1) | 1,982 (+4%) | 4mo | $370,000 | $187 | 69 |
| 132 Woodbury Dr | 0.14mi | 4/2.5 | 2,100 (+11%) | 10mo | $378,000 | $180 | 68 |
| 132 Woodbury Dr | 0.14mi | 3/2.5 (-1) | 2,100 (+11%) | 10mo | $378,000 | $180 | 63 |
| 129 Birchwood Rd | 0.22mi | 3/2.5 (-1) | 2,100 (+11%) | 10mo | $349,000 | $166 | 59 |
| 124 Elm Dr | 0.28mi | 3/2.0 (-1) | 1,676 (-12%) | 8mo | $385,000 | $230 | 54 |
| 170 George Dr | 0.23mi | 3/3.0 (-1) | 1,672 (-12%) | 12mo | $405,000 | $242 | 53 |
| 140 Anna Rd | 0.59mi | 3/2.0 (-1) | 1,973 (+4%) | 8mo | $279,000 | $141 | 52 |
| 121 Lidio Rd | 0.33mi | 5/3.0 (+1) | 2,072 (+9%) | 17mo | $489,500 | $236 | 48 |
| 1243 Old Farm Rd | 0.65mi | 3/2.5 (-1) | 1,952 (+3%) | 20mo | $318,000 | $163 | 43 |
Match score weights: distance 35% · size 25% · config 20% · recency 20%. Top-matched comps best support the ARV.
Projected returns pro-forma
0.47% appreciation · 3.0% rent growth · sell at horizon
- IRR
- -3.7%
- Equity multiple
- 0.82×
- Total profit
- $-21,629
- Equity at exit
- $136,585
- IRR
- 1.8%
- Equity multiple
- 1.21×
- Total profit
- $25,561
- Equity at exit
- $172,623
Cash invested: $121,800 (down + closing). Projections, not guarantees.
Landlord ↔ Tenant lean methodology
- Overall (STATE)
- 62 Landlord-Friendly
- State Pennsylvania
- 62 Landlord-Friendly · EVEN
- County
- — inherits STATE
- City
- — inherits STATE
ZIP-level market 18610
- Home prices YoY
- 0.3%
- Active inventory
- 90
- Price-to-rent
- 10.7×
Monthly cashflow live
- Estimated rent
- $3,400 medium interval (Pro) →
- Mortgage (P&I)
- −$2,281
- Tax from tax record
- −$466 /mo · $5,586/yr
- Insurance
- −$181
- HOA
- −$50
- Vacancy / Maint / Mgmt
- −$714
- Net cashflow
- $-292
Break-even live
UW: 25.0% down · 7.5% · 30yr · 1.5% tax · 5.0% vac · 8.0% maint · 8.0% mgmt
Financing live
Cash to close
- Down payment
- $108,750
- Closing costs
- $13,050
- Reserves months
- —
- Total cash needed
- —
Loan-product check · same deal, 3 products live
Conventional
25% down · 7.5% · 30yr
- Down + closing
- —
- Monthly P&I
- —
- Monthly cashflow
- —
- DSCR
- —
- Eligible?
- —
Personal DTI + credit; lowest rate.
DSCR
20% down · 8.5% · 30yr
- Down + closing
- —
- Monthly P&I
- —
- Monthly cashflow
- —
- DSCR
- —
- Eligible?
- —
No personal income docs; deal must DSCR.
Hard money
10% down · 12.0% · 12mo
- Down + closing
- —
- Monthly P&I
- —
- Monthly cashflow
- —
- DSCR
- —
- Eligible?
- —
Short-term bridge; refi at stabilization.
Rent comps 1 comps
| Address | Beds | Baths | Sqft | Rent | $/sqft | DOM | Units | Dist |
|---|---|---|---|---|---|---|---|---|
| 49 Driftwood Dr Blakeslee, PA | 5.0 | 2.5 | 2603 | $3,400 | $1.31 | 44d | 1 | 0.25mi |
HOA detail
- Monthly dues
- $50 · $600/yr
Listing history 28 events
-
2026-06-19days on market $435,000 Active 24 DOM
-
2026-06-18days on market $435,000 Active 23 DOM
-
2026-06-17days on market $435,000 Active 22 DOM
-
2026-06-16days on market $435,000 Active 21 DOM
-
2026-06-15days on market $435,000 Active 20 DOM
-
2026-06-14days on market $435,000 Active 18 DOM
-
2026-06-13days on market $435,000 Active 17 DOM
-
2026-06-10days on market $435,000 Active 15 DOM
-
2026-06-09days on market $435,000 Active 14 DOM
-
2026-06-08days on market $435,000 Active 13 DOM
-
2026-06-07pricedays on market $435,000 Active 12 DOM
-
2026-06-02days on market $440,000 Active 7 DOM
-
2026-06-01days on market $440,000 Active 6 DOM
-
2026-05-31days on market $440,000 Active 5 DOM
-
2026-05-30days on market $440,000 Active 4 DOM
-
2026-05-22$440,000 Active
-
2025-09-30historical $2,400
-
2025-09-20price $2,400
-
2025-09-10$2,500
-
2020-06-05soldstatus $173,000
-
2020-01-11$200,000
-
2019-08-15$200,000
-
2019-01-24$200,000
-
2017-11-17$220,000
-
2015-11-30soldstatus $120,000
-
2015-11-23soldstatus $120,000
-
2015-06-30$135,000
-
2003-12-23soldstatus $955,301
ⓘ Source: listings_history table (triggers on properties + properties_extension) + one-shot
backfill from property_details.listing_events for pre-trigger history.
Tax reassessment forecast PA · Partial reset (capped growth)
- Current annual tax
- $5,586 · $466/mo
- Projected year-2 tax
- $6,230 · $519/mo
- Expected delta
- +$643/yr (+$54/mo · 11.5%)
ⓘ Screening estimate from a state-policy table — verify with the county assessor before closing.
Climate risk First Street
- Flood 4/10 Moderate FEMA zone X (unshaded) · 22% chance over 30 yrs
- Wildfire 3/10 Moderate
- Heat 2/10 Low 7 d/yr ≥89°F today · 16 d/yr by 30 yrs out
- Wind 3/10 Moderate 6% chance of damaging wind over 30 yrs
- Air quality 2/10 Low 1 unhealthy d/yr today · 1 by 30 yrs out
Nearby sold comps map
Loading sold comps map…
Walkable amenities ~0.75 mi
Loading nearby amenities…
Taxation est. · year 1
- Rental income
- $40,800
- − Mortgage interest
- −$24,367
- − Property taxes
- −$5,586
- − Insurance
- −$2,175
- − Repairs & maintenance
- −$3,264
- − Management
- −$3,264
- − HOA
- −$600
- − Depreciation
- −$12,655
- Taxable loss
- −$11,111
- Est. tax savings @ 24.0%
- +$2,667
- After-tax cash flow
- $-837/yr
For passive investors: Depreciation is non-cash, so a rental often shows a tax loss while cash-flowing — sheltering income. Rental losses are passive: they offset passive income freely, and up to $25,000/yr can offset ordinary (W-2) income if you actively participate and your MAGI is under $100k (phasing out to $0 by $150k); unused losses carry forward. On sale, claimed depreciation is recaptured at up to 25%, and gains may owe capital-gains tax (a 1031 exchange can defer both). Figures are a year-1 estimate at your 24.0% rate — not tax advice; consult a CPA.
Schools (NCES district)
- District
- Pocono Mountain SD
- NCES district ID
- 4219500
- Math proficiency
- 37% ▼ -5.00%
- Reading proficiency
- 55% ▲ 1.00%
- Median HH income
- $55,317
- Composite
- 39.91/100
- National rank
- #3856
- State rank
- #245 of 539 in PA
Livability — Holiday Pocono
- Score
- 58/100
- State rank
- #1558
- US rank
- #20681
Category grades
Schools grade is shown separately in the Schools card above.
Census & demographics
- Population (ZIP)
- 4,373
Population outlook (Monroe County) Hauer SSP2
- Today (2025)
- 164,099 people
- By 2030
- 161,412 · -1.6%
- By 2040
- 154,616 · -5.8%
- By 2050
- 146,710 · -10.6%
- By 2075
- 140,830 · -14.2%
- By 2100
- 138,472 · -15.6%
Race, ethnicity, and origin ACS 2023
- Neighborhood character
- Highly diverse neighborhood (Simpson 0.73)
- Race & ethnicity
- White 46% Hispanic / Latino 17% Black 15% Two or more races 10% Asian 7%
- Hispanic origin (detail)
- Puerto Rican 13%
- Common ancestry
- Romanian 6% Subsaharan African 2% Iranian 1%
- Foreign-born
- 9% · Canada
- Languages at home
- 85% English-only · Spanish 9% Tagalog/Filipino 3% Russian/Polish/Slavic 2%
Political lean MEDSL · Monroe
- 2024 margin
- Toss-up / Even · D 49.1% · R 49.9%
- 2008→2024 swing
- -17.1pp toward R · 2008: 16.3pp · 2024: -0.8pp
- All cycles
- 2024: R+0.8 2020: D+6.4 2016: D+0.3 2012: D+14.0 2008: D+16.3
Not yet ingested
- Civics
- —
Market trends
- HPI YoY
- ▲ 0.47%
- Current HPI
- 181.9087
- Rent YoY
- —
- Metro
- —
- State GDP YoY
- ▲ 1.68%
- F500 in state
- 34
Industry mix (Fortune 500 HQ in PA)
| Industry | F500 HQs | Revenue |
|---|---|---|
| Healthcare | 2 | $309B |
|
||
| Insurance | 2 | $27B |
|
||
| Telecommunications / Media | 1 | $124B |
|
||
| Industrial Distribution | 1 | $22B |
|
||
| Financial Services | 1 | $20B |
|
||
| Chemicals / Materials | 1 | $18B |
|
||
Price history
-53.9% since first listed13 events — show timeline
- 2026-05-22 Listed $440,000 GLVRMLS
- 2025-09-30 Rental Removed $2,400 PMAR
- 2025-09-20 Price Changed $2,400 PMAR
- 2025-09-10 Listed for Rent $2,500 PMAR
- 2020-06-05 Sold (MLS) $173,000 PMAR
- 2020-01-11 Listed $200,000 PMAR
- 2019-08-15 Listed $200,000 PMAR
- 2019-01-24 Listed $200,000 PMAR
- 2017-11-17 Listed $220,000 PMAR
- 2015-11-30 Sold (Public Records) $120,000 Public Records
- 2015-11-23 Sold (MLS) $120,000 PMAR
- 2015-06-30 Listed $135,000 PMAR
- 2003-12-23 Sold (Public Records) $955,301 Public Records
Property tax history
-0.2%/yrLatest (2026): $5,586 · +3.3% YoY. Source: county tax records.
Cash-flow waterfall
monthlySold comps — $/sqft
last 12 mo · ≤1 miLoading sold comps…