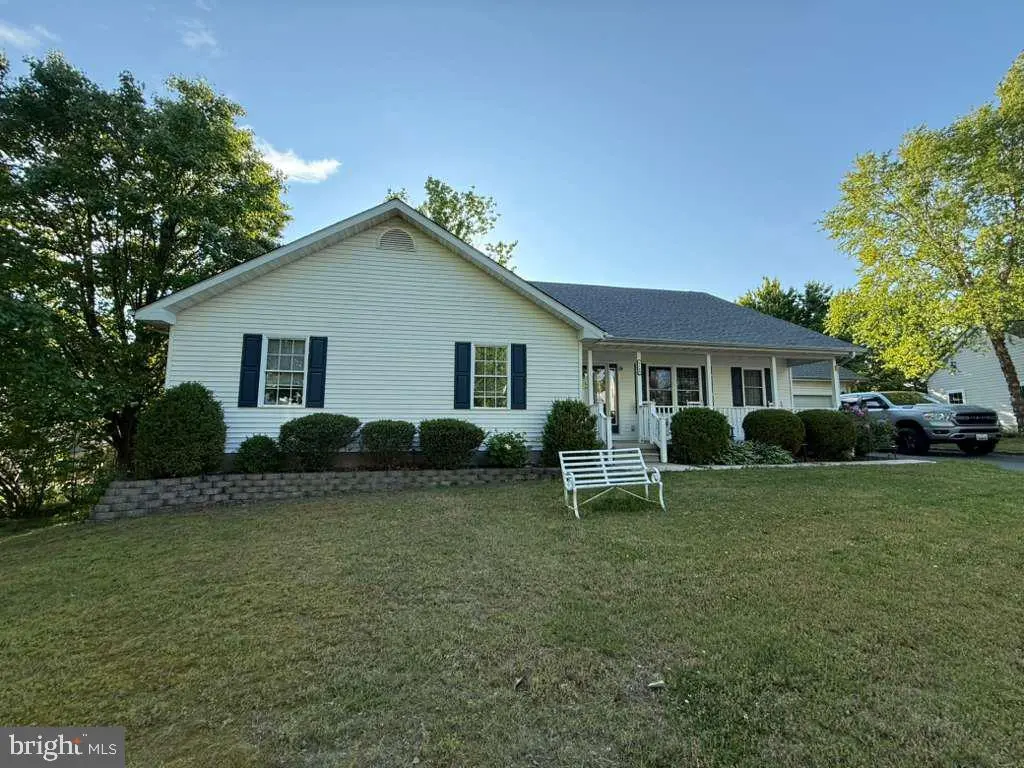
8160 Ethan Ave · Easton, MD
Flood risk 1/10 · Minimal
- FEMA flood zone
- X (unshaded)
- Chance of flooding over 30 yrs
- 0.0%
- Est. flood insurance / yr
- $507 – $1,088
Fire risk 2/10 · Minimal
- Est. fire insurance / yr
- $755 – $1,403
Heat risk 9/10 · Severe
- Hot days now (above 104°F)
- 7 days/yr
- Hot days in 30 yrs
- 16 days/yr
Wind risk 6/10 · Moderate
- Chance of severe wind over 30 yrs
- 64.0%
Air-quality risk 2/10 · Minimal
- Unhealthy air days now
- 1 days/yr
- Unhealthy air days in 30 yrs
- 1 days/yr
Risk factors via First Street. Map © Google.
Why this score? — see what drove the D- grade
The composite is a weighted blend of 9 inputs, each scored 0–100. Each bar is that input's sub-score; the figure is the points it added to the 100-point composite (weight × sub-score).
- Cash flow +12.3/30.0
- ARV discount +9.7/15.0
- DSCR +3.7/10.0
- Livability +3.6/5.0
- 1% rule +2.5/10.0
- Rent growth +2.5/5.0
- Condition / age +2.5/5.0
- Schools +2.3/10.0
- Appreciation +0.0/10.0
$388,000
🖨 Deal sheet 📄 Offer letter ✓ Due diligence
Listing remarks MLS
Great open floor plan with large rooms, fenced yard, attached 2 car garage and generous closets. Freshly painted interior, move-in ready!
Key facts
- 0.23 acre lot
- 2 garage spots
- Built 2000
Property features AI
Exterior
- Parking: Attached 2-car garage with garage door opener; Driveway with space for 4 vehicles (total 6 parking spaces)
- Utilities: Public water; Public sewer; Electric service for heating and cooling
- Home design: Vinyl siding exterior; Entry on level 1
- Construction: Composite roof
- Exterior features: Deck(s); Porch(es); Other exterior features
Interior
- Bedrooms: Three bedrooms on the main level
- Flooring: Wood flooring throughout
- Bathrooms: Two full bathrooms (both on the main level)
- Heating & cooling: Heat pump heating; Central air conditioning; Ceiling fan cooling; Hot water provided by natural gas
- Interior features: Ceiling fans; Wood floors; One fireplace
Neighborhood map
What this means for you Summary
Snapshot
- This is a 3-bed/2.0-bath single-family listed at $388k.
Deal economics
- At list price, monthly cash flow is $-70 ($-836/yr) — negative.
- To cash-flow at today's rent, offer at most $376k (3.2% below list).
- To meet the 1% rule (rent ≥ 1% of price), the offer needs to be $291k (25.1% below list).
- Recommended offer: $291k (25.1% below list) — sets the bar for 1% rule.
- Cap rate 6.1% vs local median 3.8% in Easton — top-decile yield for the area; either an underpriced asset or a hidden risk that comps aren't pricing in. Stress-test before assuming the spread holds.
Location & tenants
- Location reads 71/100 on livability (#154 in MD) — a middle-class / working-renter tenant base. Strengths: health & safety A+, housing A-, employment B+; Watch: amenities C-, schools D, crime D.
- Talbot County Public Schools (town): math 15% / reading 35% proficiency, ranked #12 of 24 in MD (top 50%) — low school quality limits family demand, transient renter base, plan for 1-2y turnover.
- Market conditions: 207 active listings in the ZIP; 5 comparable units currently listed for rent nearby; rentals lingering (median 44d on market — plan ~5-8 weeks vacancy on turnover, expect pricing pressure); 100% of comp listings sitting > 30 days — soft ceiling on asking rent; solid renter incomes; 158 units permitted in Talbot County in 2024 (0 in 5+ unit buildings).
- This rent runs 42% of the median local income ($84k/yr) — at the standard rent-burdened threshold; future hikes will face affordability resistance.
Forward outlook
- Local home prices are declining (-3.0%/yr); year-one equity from $3k of loan paydown is wiped out by about $12k of value loss. Plan a longer hold.
- Talbot County population projected at -10% by 2050 — secular population decline; favor cash flow + early exit over multi-decade hold.
Negotiation context
- It's been on market 38 days — a 3% lower offer ($376k) is reasonable based on typical stale-listing flexibility.
- 8 sale attempts since 26y ago with the ask held roughly flat each time — persistent listings suggest the price (not the market) is what's stuck; bring a comps-based counter.
- Current owner paid $250k; list at $388k implies a 55% gain — meaningful room to come down on a strong offer.
Risks & watch-outs
- Climate carrying-cost: major wind risk, 64% chance of damaging wind over 30y; extreme-heat days projected 7→16/yr by 2055 (HVAC capex compounding) — expect insurance premiums to compound above CPI over the hold.
Questions for the listing agent
- What do current leases actually rent for vs. the listed asking? Can we see a recent rent roll and the last 12 months of T-12 income?
- It's been on market 38 days. Have you received any prior offers? Is the seller open to a 25% concession, seller financing, or rate buy-down credit?
- Is there a deadline driving the sale (1031 exchange, divorce, estate, relocation)? That informs how much negotiation room exists.
- Schools are D-rated, which usually means shorter tenancies and higher turnover. Who's the typical renter profile here, and what's been the actual vacancy rate?
- Crime grade is D in this area — have there been break-ins, vandalism, or insurance claims at this property in the last 3 years? What carrier currently insures it and at what premium?
- The area grade is low — what's the realistic commute time and amenity access for the typical tenant pool here? Any planned neighborhood developments (good or bad) we should know about?
- What's the average days-on-market for RENTAL listings here right now (not sales)? A rising rental-DOM trend means longer vacancies and softer asking-rent achievability than the comps imply.
- What's the recent tenant-quality profile in this submarket — average credit score on applications, eviction rate, late-payment / NSF rate, and stable-employment percentage? A property-management company in the area should have these aggregated.
- How much new for-sale + rental construction is in the pipeline within 1–3 miles? Heavy new supply typically softens prices + rents 12–24 months out; constrained supply supports both.
Investment metrics
- 1% rule
- 0.75% ✗
- Cap rate
- 6.08%
- Cash-on-cash
- -0.77%
- DSCR
- 0.97
- GRM
- 11.1
CMA / ARV
- ARV (median comp)
- $407,599
- List price
- $388,000
- Delta
- -4.81%
- Verdict
- FAIR
- Comps
- 20 within 1.0 mi
Show comp detail 8 sales within ~0.75 mi
| Address | Dist | Beds/Ba | Sqft | Sold | Price | $/sf | Match |
|---|---|---|---|---|---|---|---|
| 8173 June Way | 0.03mi | 4/2.5 (+1) | 2,080 (+2%) | 21mo | $399,998 | $192 | 70 |
| 29676 Standish St | 0.58mi | 4/2.5 (+1) | 2,060 (+1%) | 0mo | $468,000 | $227 | 63 |
| 8382 Colony Cir | 0.41mi | 4/2.5 (+1) | 2,060 (+1%) | 16mo | $359,900 | $175 | 58 |
| 29390 Hawkes Hill Rd | 0.68mi | 3/2.0 | 2,132 (+5%) | 6mo | $420,000 | $197 | 55 |
| 8252 Lincoln Ct | 0.20mi | 4/2.5 (+1) | 2,240 (+10%) | 16mo | $460,000 | $205 | 53 |
| 8388 Colony Cir | 0.42mi | 4/2.5 (+1) | 2,277 (+12%) | 1mo | $420,000 | $184 | 52 |
| 8357 Gannon Cir | 0.49mi | 3/2.5 | 2,233 (+10%) | 9mo | $565,000 | $253 | 52 |
| 29860 Standish St | 0.62mi | 4/2.5 (+1) | 1,920 (-6%) | 17mo | $405,000 | $211 | 40 |
Match score weights: distance 35% · size 25% · config 20% · recency 20%. Top-matched comps best support the ARV.
Projected returns pro-forma
-3.0% appreciation · 3.0% rent growth · sell at horizon
- IRR
- -17.6%
- Equity multiple
- 0.38×
- Total profit
- $-67,459
- Equity at exit
- $57,852
- IRR
- -9.8%
- Equity multiple
- 0.40×
- Total profit
- $-65,064
- Equity at exit
- $33,547
Cash invested: $108,640 (down + closing). Projections, not guarantees.
Landlord ↔ Tenant lean methodology
- Overall (STATE)
- 27 Tenant-Leaning
- State Maryland
- 27 Tenant-Leaning · D+14
- County
- — inherits STATE
- City
- — inherits STATE
ZIP-level market 21601
- Home prices YoY
- -31.0%
- Active inventory
- 207
- Price-to-rent
- 11.1×
Monthly cashflow live
- Estimated rent
- $2,906 high interval (Pro) →
- Mortgage (P&I)
- −$2,035
- Tax from tax record
- −$169 /mo · $2,030/yr
- Insurance
- −$162
- HOA
- −$0
- Vacancy / Maint / Mgmt
- −$610
- Net cashflow
- $-70
Break-even live
UW: 25.0% down · 7.5% · 30yr · 1.5% tax · 5.0% vac · 8.0% maint · 8.0% mgmt
Financing live
Cash to close
- Down payment
- $97,000
- Closing costs
- $11,640
- Reserves months
- —
- Total cash needed
- —
Loan-product check · same deal, 3 products live
Conventional
25% down · 7.5% · 30yr
- Down + closing
- —
- Monthly P&I
- —
- Monthly cashflow
- —
- DSCR
- —
- Eligible?
- —
Personal DTI + credit; lowest rate.
DSCR
20% down · 8.5% · 30yr
- Down + closing
- —
- Monthly P&I
- —
- Monthly cashflow
- —
- DSCR
- —
- Eligible?
- —
No personal income docs; deal must DSCR.
Hard money
10% down · 12.0% · 12mo
- Down + closing
- —
- Monthly P&I
- —
- Monthly cashflow
- —
- DSCR
- —
- Eligible?
- —
Short-term bridge; refi at stabilization.
Rent comps 5 comps
| Address | Beds | Baths | Sqft | Rent | $/sqft | DOM | Units | Dist |
|---|---|---|---|---|---|---|---|---|
| 8460 Colony Cir Easton, MD | 4.0 | 2.5 | 2060 | $3,000 | $1.46 | 43d | 1 | 0.61mi |
| 126 Tred Avon Ave Unit NA Easton, MD | 4.0 | 2.0 | 1514 | $3,000 | $1.98 | 43d | 1 | 1.01mi |
| 607 North St Easton, MD | 3.0 | 2.5 | 1650 | $3,100 | $1.88 | 43d | 1 | 1.13mi |
| 300 Dixon St #204 Easton, MD | 3.0 | 2.5 | 2330 | $2,800 | $1.20 | 43d | 1 | 1.27mi |
| 27 N Hanson St Easton, MD | 3.0 | 2.5 | 2800 | $3,000 | $1.07 | 43d | 1 | 1.48mi |
Listing history 45 events
-
2026-06-19days on market $388,000 Active 38 DOM
-
2026-06-18days on market $388,000 Active 37 DOM
-
2026-06-17days on market $388,000 Active 36 DOM
-
2026-06-16days on market $388,000 Active 35 DOM
-
2026-06-15days on market $388,000 Active 34 DOM
-
2026-06-14days on market $388,000 Active 32 DOM
-
2026-06-13price $388,000 Active 31 DOM
-
2026-06-12days on market $390,000 Active 31 DOM
-
2026-06-09days on market $390,000 Active 28 DOM
-
2026-06-08days on market $390,000 Active 27 DOM
-
2026-06-07remarks 485-char remark
-
2026-06-07pricedays on market $390,000 Active 26 DOM
-
2026-06-03days on market $395,000 Active 22 DOM
-
2026-06-02days on market $395,000 Active 21 DOM
-
2026-06-01days on market $395,000 Active 20 DOM
-
2026-05-31days on market $395,000 Active 19 DOM
-
2026-05-30days on market $395,000 Active 18 DOM
-
2026-05-12$399,000 Active 454-char remark
-
2026-04-24historical
-
2026-04-07status Active
-
2026-04-02historical
-
2026-03-17price $250,000
-
2026-01-24price $439,000
-
2025-11-10price $440,000
-
2025-10-16price $455,000
-
2025-10-04$460,000 Active
-
2025-08-08historical
-
2013-11-15soldstatus $250,000
-
2013-11-13soldstatus $250,000 Sold
Show marketing remark (137 chars)
Great open floor plan with large rooms, fenced yard, attached 2 car garage and generous closets. Freshly painted interior, move-in ready!
-
2013-11-13soldstatus $250,000
Show marketing remark (137 chars)
Great open floor plan with large rooms, fenced yard, attached 2 car garage and generous closets. Freshly painted interior, move-in ready!
-
2013-10-07status Contingent (No Kick Out)
-
2013-10-04$256,900 Active
Show marketing remark (137 chars)
Great open floor plan with large rooms, fenced yard, attached 2 car garage and generous closets. Freshly painted interior, move-in ready!
-
2013-10-04historical
Show marketing remark (137 chars)
Great open floor plan with large rooms, fenced yard, attached 2 car garage and generous closets. Freshly painted interior, move-in ready!
-
2013-10-03$256,900
Show marketing remark (137 chars)
Great open floor plan with large rooms, fenced yard, attached 2 car garage and generous closets. Freshly painted interior, move-in ready!
-
2005-04-25soldstatus $285,000
-
2005-04-22soldstatus $285,000
-
2005-03-15historical
-
2005-03-02$295,000
-
2002-09-10soldstatus $220,000
-
2002-08-29soldstatus $220,000
-
2002-07-20historical
-
2002-07-10$228,000
-
2001-01-19soldstatus $194,000
-
2000-12-12historical
-
2000-02-10$189,900
ⓘ Source: listings_history table (triggers on properties + properties_extension) + one-shot
backfill from property_details.listing_events for pre-trigger history.
Tax reassessment forecast MD · Partial reset (capped growth)
- Current annual tax
- $2,030 · $169/mo
- Projected year-2 tax
- $3,130 · $261/mo
- Expected delta
- +$1,100/yr (+$92/mo · 54.2%)
ⓘ Screening estimate from a state-policy table — verify with the county assessor before closing.
Climate risk First Street
- Flood 1/10 Low FEMA zone X (unshaded) · 0% chance over 30 yrs
- Wildfire 2/10 Low
- Heat 9/10 Extreme 7 d/yr ≥104°F today · 16 d/yr by 30 yrs out
- Wind 6/10 Major 64% chance of damaging wind over 30 yrs
- Air quality 2/10 Low 1 unhealthy d/yr today · 1 by 30 yrs out
Nearby sold comps map
Loading sold comps map…
Walkable amenities ~0.75 mi
Loading nearby amenities…
Taxation est. · year 1
- Rental income
- $34,875
- − Mortgage interest
- −$21,734
- − Property taxes
- −$2,030
- − Insurance
- −$1,940
- − Repairs & maintenance
- −$2,790
- − Management
- −$2,790
- − Depreciation
- −$11,287
- Taxable loss
- −$7,697
- Est. tax savings @ 24.0%
- +$1,847
- After-tax cash flow
- $1,011/yr
For passive investors: Depreciation is non-cash, so a rental often shows a tax loss while cash-flowing — sheltering income. Rental losses are passive: they offset passive income freely, and up to $25,000/yr can offset ordinary (W-2) income if you actively participate and your MAGI is under $100k (phasing out to $0 by $150k); unused losses carry forward. On sale, claimed depreciation is recaptured at up to 25%, and gains may owe capital-gains tax (a 1031 exchange can defer both). Figures are a year-1 estimate at your 24.0% rate — not tax advice; consult a CPA.
Schools (NCES district)
- District
- Talbot County Public Schools
- NCES district ID
- 2400630
- Math proficiency
- 15% ▼ -19.00%
- Reading proficiency
- 35% ▼ -10.00%
- Median HH income
- $61,786
- Composite
- 23.11/100
- National rank
- #7961
- State rank
- #12 of 24 in MD
Livability — Easton
- Score
- 71/100
- State rank
- #154
- US rank
- #6882
Category grades
Schools grade is shown separately in the Schools card above.
Census & demographics
- Census place
- Easton, MD
- County
- Talbot County · 24,671 people
- City population
- 24,671
- Metro
- Easton, MD
- Population (ZIP)
- 24,671
- Household income
- $83,680
- Rent vs Own
- Severe rent burden
- 771.0
Population outlook (Talbot County) Hauer SSP2
- Today (2025)
- 36,811 people
- By 2030
- 36,305 · -1.4%
- By 2040
- 34,818 · -5.4%
- By 2050
- 32,982 · -10.4%
- By 2075
- 29,631 · -19.5%
- By 2100
- 25,767 · -30.0%
Race, ethnicity, and origin ACS 2023
- Neighborhood character
- Predominantly White (71%)
- Race & ethnicity
- White 71% Black 14% Hispanic / Latino 10% Two or more races 6% Asian 1%
- Hispanic origin (detail)
- Mexican 2%
- Common ancestry
- Lithuanian 4% Romanian 3% Slovak 2%
- Foreign-born
- 9% · Canada, Guatemala
- Languages at home
- 89% English-only · Spanish 8% Other Indo-European 2%
Political lean MEDSL · Talbot
- 2024 margin
- Toss-up / Even · D 49.0% · R 49.1% · Other 1.9%
- 2008→2024 swing
- +9.6pp toward D · 2008: -9.6pp · 2024: -0.0pp
- All cycles
- 2024: R+0.0 2020: D+0.5 2016: R+11.9 2012: R+13.2 2008: R+9.6
Not yet ingested
- Civics
- —
Market trends
- HPI YoY
- ▼ -103.01%
- Current HPI
- 229.2902
- Rent YoY
- —
- Metro
- Easton, MD
- State GDP YoY
- ▲ 2.97%
- F500 in state
- 12
Industry mix (Fortune 500 HQ in MD)
| Industry | F500 HQs | Revenue |
|---|---|---|
| Aerospace / Defense | 1 | $71B |
|
||
| Utilities | 1 | $25B |
|
||
| Hotels | 1 | $24B |
|
||
| Consumer Goods | 1 | $7B |
|
||
| Real Estate | 1 | $6B |
|
||
| Chemicals | 1 | $2B |
|
||
Price history
+104.3% since first listed31 events — show timeline
- 2026-06-13 Price Changed $388,000 BRIGHT MLS
- 2026-06-04 Price Changed $390,000 BRIGHT MLS
- 2026-05-21 Price Changed $395,000 BRIGHT MLS
- 2026-05-12 Listed $399,000 BRIGHT MLS
- 2026-04-24 Listing Removed — BRIGHT MLS
- 2026-04-07 Relisted — BRIGHT MLS
- 2026-04-02 Listing Removed — BRIGHT MLS
- 2026-03-17 Price Changed $250,000 BRIGHT MLS
- 2026-01-24 Price Changed $439,000 BRIGHT MLS
- 2025-11-10 Price Changed $440,000 BRIGHT MLS
- 2025-10-16 Price Changed $455,000 BRIGHT MLS
- 2025-10-04 Listed $460,000 BRIGHT MLS
- 2025-08-08 Coming Soon — BRIGHT MLS
- 2013-11-15 Sold (Public Records) $250,000 Public Records
- 2013-11-13 Sold (MLS) $250,000 MRIS
- 2013-11-13 Sold (MLS) $250,000 BRIGHT MLS
- 2013-10-07 Pending — MRIS
- 2013-10-04 Listed $256,900 MRIS
- 2013-10-04 Listing Removed — BRIGHT MLS
- 2013-10-03 Listed $256,900 BRIGHT MLS
- 2005-04-25 Sold (Public Records) $285,000 Public Records
- 2005-04-22 Sold (MLS) $285,000 MRIS
- 2005-03-15 Delisted — MRIS
- 2005-03-02 Listed $295,000 MRIS
- 2002-09-10 Sold (Public Records) $220,000 Public Records
- 2002-08-29 Sold (MLS) $220,000 MRIS
- 2002-07-20 Delisted — MRIS
- 2002-07-10 Listed $228,000 MRIS
- 2001-01-19 Sold (MLS) $194,000 MRIS
- 2000-12-12 Delisted — MRIS
- 2000-02-10 Listed $189,900 MRIS
Property tax history
-0.9%/yrLatest (2025): $2,030 · +3.3% YoY. Source: county tax records.
Cash-flow waterfall
monthlySold comps — $/sqft
last 12 mo · ≤1 miLoading sold comps…