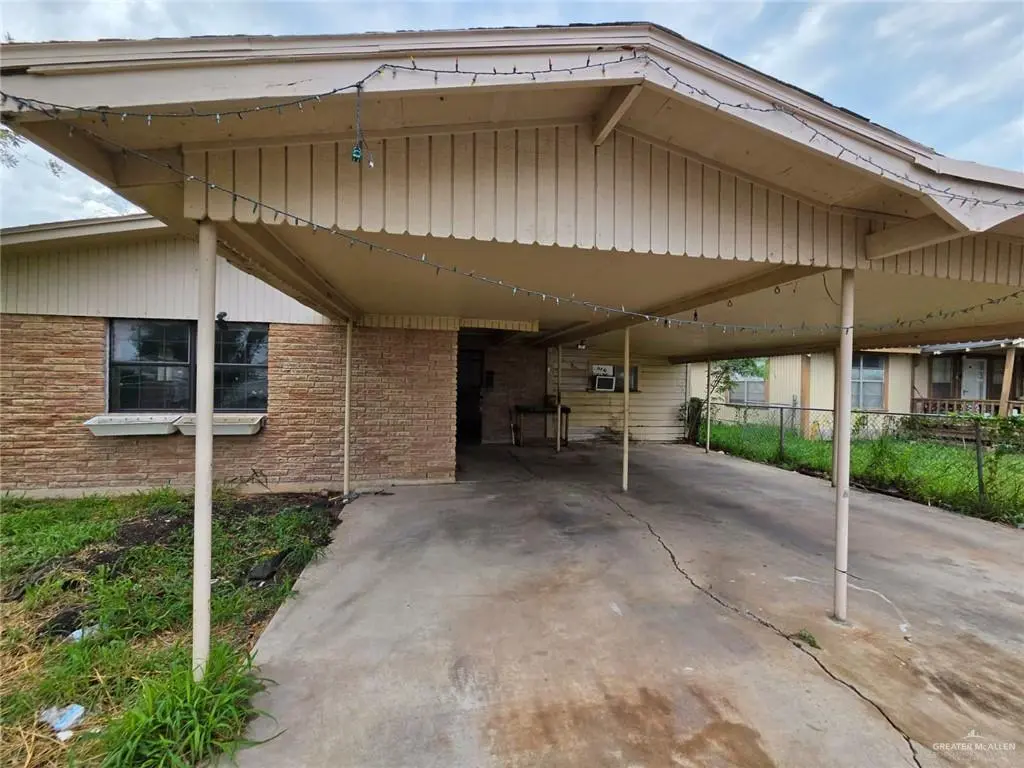
125 N Mccullough St · San Benito, TX
Flood risk 7/10 · Major
- FEMA flood zone
- X (unshaded)
- Chance of flooding over 30 yrs
- 0.95%
- Est. flood insurance / yr
- $507 – $1,088
Fire risk 5/10 · Moderate
- Est. fire insurance / yr
- $1,222 – $2,270
Heat risk 9/10 · Severe
- Hot days now (above 110°F)
- 7 days/yr
- Hot days in 30 yrs
- 26 days/yr
Wind risk 8/10 · Major
- Chance of severe wind over 30 yrs
- 99.0%
Air-quality risk 2/10 · Minimal
- Unhealthy air days now
- 1 days/yr
- Unhealthy air days in 30 yrs
- 1 days/yr
Risk factors via First Street. Map © Google.
Why this score? — see what drove the B grade
The composite is a weighted blend of 9 inputs, each scored 0–100. Each bar is that input's sub-score; the figure is the points it added to the 100-point composite (weight × sub-score).
- Cash flow +28.5/30.0
- ARV discount +15.0/15.0
- DSCR +10.0/10.0
- 1% rule +9.6/10.0
- Livability +3.3/5.0
- Rent growth +2.5/5.0
- Condition / age +2.5/5.0
- Schools +1.6/10.0
- Appreciation +0.0/10.0
$68,000
🖨 Deal sheet (PDF) 📄 Offer letter ✓ Due diligence
Listing remarks
Great investment opportunity with tons of potential! This 3 bedroom, 2 bathroom home sits on a spacious lot with a large yard offering endless possibilities for expansion, outdoor entertaining, or future improvements. Conveniently located less than one mile from the expressway, providing quick access to shopping, dining, schools, and surrounding areas. Ideal for cash buyers, investors, or handy homeowners looking for their next project. With solid potential and a desirable location, this property is a must-see. Schedule your showing today!
Key facts
- Desirable location
- Large yard
- Spacious lot
Tags
Property features AI
Finance
- Other: Lot approximately 7,500 sq ft (0.1722 acres)
- HOA & community: No homeowners association
Exterior
- Parking: Covered carport (1 covered space); No garage
- Utilities: Public water; City sewer; Electric service (implied by electric water heater)
- Home design: Single-family property (per property type); Entry from paved street
- Construction: Brick and siding construction; Slab foundation; Shingle roof; Built area approximately 1,044
- Exterior features: Balcony; Mature trees; Chain link fencing; Paved road access
Interior
- Kitchen: Electric water heater; No conveying appliances
- Flooring: Tile flooring
- Bathrooms: 2 full bathrooms
- Heating & cooling: Window unit cooling
- Interior features: Laminate and solid surface countertops; No window coverings; Laundry area
- Laundry & utility: Laundry area
Neighborhood map
What this means for you Summary
Snapshot
- This is a 3-bed/2.0-bath single-family listed at $68k.
Deal economics
- At list price, monthly cash flow is $155 ($2k/yr) — positive.
- The deal already cash-flows at list — no discount required.
- Meets the 1% rule at list price ($990 rent vs $68k).
- Recommended offer: $67k (1.5% below list) — sets the bar for market timing.
- Cap rate 10.2% vs local median 3.7% in San Benito — top-decile yield for the area; either an underpriced asset or a hidden risk that comps aren't pricing in. Stress-test before assuming the spread holds.
Location & tenants
- Location reads 66/100 on livability (#621 in TX) — a middle-class / working-renter tenant base. Strengths: cost of living A+, housing A+; Watch: crime C-, amenities F, commute F.
- San Benito CISD (suburban): math 14% / reading 27% proficiency, ranked #782 of 826 in TX (top 95%) — low school quality limits family demand, transient renter base, plan for 1-2y turnover; 78% free/reduced lunch — lower-income household profile, screen leases tightly.
- Zoned schools: Cash El (math 22% / reading 37%, grade F, #2,525 of 4,322 statewide, top 62%, 623 students, 88% FRL); Miller Jordan Middle (math 9% / reading 23%, grade F, #1,543 of 1,662 statewide, top 94%, 640 students, 91% FRL); San Benito H S (math 32% / reading 2%, grade F, #1,460 of 1,632 statewide, top 91%, 2,012 students, 80% FRL).
- Market conditions: 440 active listings in the ZIP; 5 comparable units currently listed for rent nearby; rentals at typical pace (median 16d on market — plan ~3-4 weeks tenant-placement turnaround); 40% of comp listings sitting > 30 days — soft ceiling on asking rent; 2,326 units permitted in Cameron County in 2024 (503 in 5+ unit buildings).
Forward outlook
- Local home prices are declining (-3.0%/yr); year-one equity from $470 of loan paydown is wiped out by about $2k of value loss. Plan a longer hold.
- Cameron County population projected at +3% by 2050 — modest demand growth; plan on rents tracking national, not racing it.
Negotiation context
- It's been on market 29 days — a 2% lower offer ($67k) is reasonable based on typical stale-listing flexibility.
Risks & watch-outs
- Watch-outs: property tax is 3.1% of price; flood insurance adds $66/mo.
- Climate carrying-cost: major flood risk; severe wind risk, 99% chance of damaging wind over 30y; moderate wildfire risk; extreme-heat days projected 7→26/yr by 2055 (HVAC capex compounding) — expect insurance premiums to compound above CPI over the hold.
Questions for the listing agent
- Built in 1961 — when were the roof, HVAC, electrical panel, plumbing, and water heater last replaced?
- Property tax is high relative to price — has the assessment been appealed recently, and will the sale trigger a re-assessment?
- What's the actual annual flood-insurance premium (NFIP or private), and is the property in a SFHA with mandatory coverage?
- Is there a deadline driving the sale (1031 exchange, divorce, estate, relocation)? That informs how much negotiation room exists.
- Schools are D-rated, which usually means shorter tenancies and higher turnover. Who's the typical renter profile here, and what's been the actual vacancy rate?
- What's the average days-on-market for RENTAL listings here right now (not sales)? A rising rental-DOM trend means longer vacancies and softer asking-rent achievability than the comps imply.
- What's the recent tenant-quality profile in this submarket — average credit score on applications, eviction rate, late-payment / NSF rate, and stable-employment percentage? A property-management company in the area should have these aggregated.
- How much new for-sale + rental construction is in the pipeline within 1–3 miles? Heavy new supply typically softens prices + rents 12–24 months out; constrained supply supports both.
Investment metrics
- 1% rule
- 1.46% ✓
- Cap rate
- 10.20%
- Cash-on-cash
- 13.94%
- DSCR
- 1.62
- GRM
- 5.7
CMA / ARV
- ARV (on-the-fly)
- $87,696
- Comps found
- 1
Show comp detail 1 sale within ~0.75 mi
| Address | Dist | Beds/Ba | Sqft | Sold | Price | $/sf | Match |
|---|---|---|---|---|---|---|---|
| 467 S Travis St | 0.61mi | 2/2.0 (-1) | 1,055 (+1%) | 15mo | $89,000 | $84 | 52 |
Match score weights: distance 35% · size 25% · config 20% · recency 20%. Top-matched comps best support the ARV.
Projected returns pro-forma
-3.0% appreciation · 3.0% rent growth · sell at horizon
- IRR
- -1.5%
- Equity multiple
- 0.94×
- Total profit
- $-1,056
- Equity at exit
- $10,139
- IRR
- 8.4%
- Equity multiple
- 1.64×
- Total profit
- $12,219
- Equity at exit
- $5,879
Cash invested: $19,040 (down + closing). Projections, not guarantees.
Landlord ↔ Tenant lean methodology
- Overall (STATE)
- 87 Strongly Landlord-Friendly
- State Texas
- 87 Strongly Landlord-Friendly · R+5
- County
- — inherits STATE
- City
- — inherits STATE
ZIP-level market 78586
- Home prices YoY
- -24.9%
- Active inventory
- 440
- Price-to-rent
- 5.7×
Monthly cashflow live
- Estimated rent
- $990 high interval (Pro) →
- Mortgage (P&I)
- −$357
- Tax from tax record
- −$176 /mo · $2,114/yr
- Insurance
- −$28
- Flood insurance flood zone
- −$66 /mo · $798/yr
- HOA
- −$0
- Vacancy / Maint / Mgmt
- −$208
- Net cashflow
- $155
Break-even live
Sensitivity live
| Price | -10% $193 | -5% $174 | +0% $155 | +5% $135 | +10% $116 |
|---|---|---|---|---|---|
| Rent | -10% $76 | -5% $116 | +0% $155 | +5% $194 | +10% $233 |
| Rate | -1.0pp $189 | -0.5pp $172 | base $155 | +0.5pp $137 | +1.0pp $119 |
UW: 25.0% down · 7.5% · 30yr · 1.5% tax · 5.0% vac · 8.0% maint · 8.0% mgmt
Financing live
Cash to close
- Down payment
- $17,000
- Closing costs
- $2,040
- Reserves months
- —
- Total cash needed
- —
Loan-product check · same deal, 3 products live
Conventional
25% down · 7.5% · 30yr
- Down + closing
- —
- Monthly P&I
- —
- Monthly cashflow
- —
- DSCR
- —
- Eligible?
- —
Personal DTI + credit; lowest rate.
DSCR
20% down · 8.5% · 30yr
- Down + closing
- —
- Monthly P&I
- —
- Monthly cashflow
- —
- DSCR
- —
- Eligible?
- —
No personal income docs; deal must DSCR.
Hard money
10% down · 12.0% · 12mo
- Down + closing
- —
- Monthly P&I
- —
- Monthly cashflow
- —
- DSCR
- —
- Eligible?
- —
Short-term bridge; refi at stabilization.
Rent comps 5 comps
| Address | Beds | Baths | Sqft | Rent | $/sqft | DOM | Units | Dist |
|---|---|---|---|---|---|---|---|---|
| 1485 E Stenger St San Benito, TX | 3.0 | 1.0 | 1296 | $1,150 | $0.89 | 15d | 1 | 0.41mi |
| 150 Wild Olive Cir Unit D San Benito, TX | 2.0 | 1.0 | 744 | $899 | $1.21 | 15d | 1 | 0.43mi |
| 111 Las Palmas St Apt 2 San Benito, TX | 2.0 | 2.0 | 1021 | $875 | $0.86 | 45d | 1 | 0.44mi |
| 116 Wild Olive Cir Unit 3 & 8 San Benito, TX | 2.0 | 1.0 | 792 | $795 | $1.00 | 15d | 1 | 0.46mi |
| 100 Woodford St Unit D San Benito, TX | 3.0 | 2.5 | 1500 | $1,550 | $1.03 | 45d | 1 | 0.93mi |
Listing history 18 events
-
2026-06-22days on market $68,000 Active 29 DOM
-
2026-06-18days on market $68,000 Active 26 DOM
-
2026-06-17days on market $68,000 Active 25 DOM
-
2026-06-16days on market $68,000 Active 24 DOM
-
2026-06-15days on market $68,000 Active 23 DOM
-
2026-06-14days on market $68,000 Active 21 DOM
-
2026-06-10days on market $68,000 Active 18 DOM
-
2026-06-09days on market $68,000 Active 17 DOM
-
2026-06-08days on market $68,000 Active 16 DOM
-
2026-06-07days on market $68,000 Active 15 DOM
-
2026-06-03days on market $68,000 Active 11 DOM
-
2026-06-02days on market $68,000 Active 10 DOM
-
2026-06-01days on market $68,000 Active 9 DOM
-
2026-05-31days on market $68,000 Active 8 DOM
-
2026-05-30days on market $68,000 Active 7 DOM
-
2026-05-23$68,000 Active
-
2026-01-26soldstatus
-
2025-11-24soldstatus
ⓘ Source: listings_history table (triggers on properties + properties_extension) + one-shot
backfill from property_details.listing_events for pre-trigger history.
Tax reassessment forecast TX · Resets to sale price
- Current annual tax
- $2,114 · $176/mo
- Projected year-2 tax
- $2,114 · $176/mo
- Expected delta
- $0/yr ($0/mo · 0.0%)
ⓘ Screening estimate from a state-policy table — verify with the county assessor before closing.
Climate risk First Street
- Flood 7/10 Severe FEMA zone X (unshaded) · 95% chance over 30 yrs
- Wildfire 5/10 Major
- Heat 9/10 Extreme 7 d/yr ≥110°F today · 26 d/yr by 30 yrs out
- Wind 8/10 Severe 99% chance of damaging wind over 30 yrs
- Air quality 2/10 Low 1 unhealthy d/yr today · 1 by 30 yrs out
Nearby sold comps map
Loading sold comps map…
Walkable amenities ~0.75 mi
Loading nearby amenities…
Taxation est. · year 1
- Rental income
- $11,882
- − Mortgage interest
- −$3,809
- − Property taxes
- −$2,114
- − Insurance
- −$1,138
- − Repairs & maintenance
- −$951
- − Management
- −$951
- − Depreciation
- −$1,978
- Taxable income
- $942
- Est. tax owed @ 24.0%
- −$226
- After-tax cash flow
- $1,630/yr
For passive investors: Depreciation is non-cash, so a rental often shows a tax loss while cash-flowing — sheltering income. Rental losses are passive: they offset passive income freely, and up to $25,000/yr can offset ordinary (W-2) income if you actively participate and your MAGI is under $100k (phasing out to $0 by $150k); unused losses carry forward. On sale, claimed depreciation is recaptured at up to 25%, and gains may owe capital-gains tax (a 1031 exchange can defer both). Figures are a year-1 estimate at your 24.0% rate — not tax advice; consult a CPA.
Schools (NCES district)
- District
- San Benito CISD
- NCES district ID
- 4838790
- Math proficiency
- 14% ▼ -31.00%
- Reading proficiency
- 27% ▼ -10.00%
- Median HH income
- $29,403
- Composite
- 16.31/100
- National rank
- #9212
- State rank
- #782 of 826 in TX
Livability — San Benito
- Score
- 66/100
- State rank
- #621
- US rank
- #11846
Category grades
Schools grade is shown separately in the Schools card above.
Census & demographics
- Census place
- San Benito, TX
- Population (ZIP)
- 49,103
Population outlook (Cameron County) Hauer SSP2
- Today (2025)
- 441,603 people
- By 2030
- 448,113 · +1.5%
- By 2040
- 456,385 · +3.3%
- By 2050
- 456,294 · +3.3%
- By 2075
- 423,851 · -4.0%
- By 2100
- 342,787 · -22.4%
Race, ethnicity, and origin ACS 2023
- Neighborhood character
- Predominantly Hispanic (93%)
- Race & ethnicity
- Hispanic / Latino 93% Two or more races 42% White 6%
- Hispanic origin (detail)
- Mexican 90%
- Foreign-born
- 23% · Canada
- Languages at home
- 29% English-only · Spanish 70%
Political lean MEDSL · Cameron
- 2024 margin
- Lean R (+5.8) · D 46.7% · R 52.5%
- 2008→2024 swing
- -34.6pp toward R · 2008: 28.8pp · 2024: -5.8pp
- All cycles
- 2024: R+5.8 2020: D+13.2 2016: D+32.5 2012: D+32.4 2008: D+28.8
Not yet ingested
- Civics
- —
Market trends
- HPI YoY
- ▼ -62.37%
- Current HPI
- 188.147
- Rent YoY
- —
- Metro
- —
- State GDP YoY
- ▲ 3.95%
- F500 in state
- 110
Industry mix (Fortune 500 HQ in TX)
| Industry | F500 HQs | Revenue |
|---|---|---|
| Energy | 16 | $1,198B |
|
||
| Technology | 5 | $198B |
|
||
| Engineering / Construction | 4 | $72B |
|
||
| Energy Services | 3 | $60B |
|
||
| Utilities | 3 | $41B |
|
||
| Healthcare | 2 | $330B |
|
||
Price history
3 events — show timeline
- 2026-05-23 Listed $68,000 MCALLENMLS
- 2026-01-26 Sold (Public Records) — Public Records
- 2025-11-24 Sold (Public Records) — Public Records
Property tax history
+8.7%/yrLatest (2025): $2,114 · +20.6% YoY. Source: county tax records.
Cash-flow waterfall
monthlySold comps — $/sqft
last 12 mo · ≤1 miLoading sold comps…