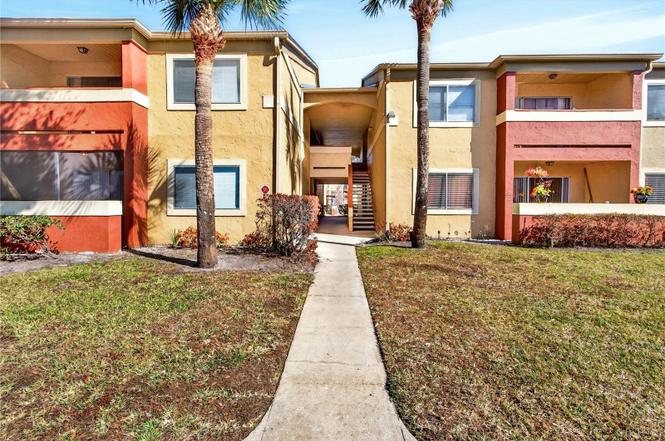
610 Kenwick Cir #205 · Casselberry, FL
Flood risk 1/10 · Minimal
- FEMA flood zone
- X (unshaded)
- Chance of flooding over 30 yrs
- 0.0%
- Est. flood insurance / yr
- $507 – $1,088
Fire risk 1/10 · Minimal
- Est. fire insurance / yr
- $947 – $1,759
Heat risk 9/10 · Severe
- Hot days now (above 108°F)
- 7 days/yr
- Hot days in 30 yrs
- 23 days/yr
Wind risk 9/10 · Severe
- Chance of severe wind over 30 yrs
- 99.0%
Air-quality risk 2/10 · Minimal
- Unhealthy air days now
- 1 days/yr
- Unhealthy air days in 30 yrs
- 2 days/yr
Risk factors via First Street. Map © Google.
Why this score? — see what drove the D grade
The composite is a weighted blend of 9 inputs, each scored 0–100. Each bar is that input's sub-score; the figure is the points it added to the 100-point composite (weight × sub-score).
- Cash flow +10.7/30.0
- ARV discount +7.5/15.0
- 1% rule +6.8/10.0
- Schools +5.1/10.0
- Livability +3.7/5.0
- DSCR +3.1/10.0
- Rent growth +3.0/5.0
- Condition / age +2.5/5.0
- Appreciation +0.0/10.0
$149,000
🖨 Deal sheet (PDF) 📄 Offer letter ✓ Due diligence
Listing remarks
Under contract-accepting backup offers. Discover this beautifully updated second-floor condo in Oxford Square 0 a well-maintained community with no special assessments and a recently paid-off roof. Inside, the split-bedroom layout offers privacy, complemented by a spacous renovatedkitchen and freshly updated bathrooms, Lightly used by seasonal owners, the home feels fresh and move-in ready. The HOA includes water, trash collection, exterior maintenance and accces to amenities such as two pools, a community center and tennic courts. Conveniently located just minutes from Sam's Club, BJ's and everyday shopping - east commute to Both Orlando Airport and Sanford Airport. Excellent location, nea
Key facts
- Split-bedroom layout
- Community center
- Renovated kitchen
Tags
Property features AI
Finance
- Other: Property type: Residential condominium; Property condition: Completed; Zoning: RMF-13
- Financial info: Total annual fees $5,028; No lease restrictions indicated
- HOA & community: Monthly condo fee of $419; Association fees cover pool, insurance, and recreational facilities; Association name: Catherine MacDougall / Oxford Square Condominium Association; Association fee required; Community clubhouse, park, pool, and street lights; Pets allowed with size limit (max 25 lbs)
Exterior
- Utilities: Public water; Public sewer; Cable available; Broadband / high-speed internet available; Electricity connected; Water connected; Sewer connected
- Home design: Residential condominium; One story; Second floor unit; Facing south
- Construction: Block construction; Shingle roof; Block foundation; Building identified as 610 / 205
- Exterior features: Covered porch; Porch; Sliding doors; Asphalt road access
Interior
- Kitchen: Dishwasher; Disposal; Microwave; Range; Refrigerator; Stone counters
- Bedrooms: 2 bedrooms
- Flooring: Carpet; Laminate
- Bathrooms: 2 full bathrooms
- Heating & cooling: Electric heating; Central air conditioning
- Interior features: Living room / dining room combo; Split bedroom floor plan; Stone counters; Window treatments; Great room; Inside utility
- Laundry & utility: Washer; Dryer; Inside laundry closet; Electric water heater
Neighborhood map
What this means for you Summary
Snapshot
- This is a 2-bed/2.0-bath condo listed at $149k.
Deal economics
- At list price, monthly cash flow is $-72 ($-863/yr) — negative.
- To cash-flow at today's rent, offer at most $136k (8.5% below list).
- Meets the 1% rule at list price ($2k rent vs $149k).
- Recommended offer: $136k (9.0% below list) — sets the bar for market timing.
- Cap rate 5.7% vs local median 4.1% in Casselberry — top-decile yield for the area; either an underpriced asset or a hidden risk that comps aren't pricing in. Stress-test before assuming the spread holds.
Location & tenants
- Location reads 73/100 on livability (#314 in FL) — a middle-class / working-renter tenant base. Strengths: cost of living A+, housing A+, health & safety A-; Watch: crime C-, employment C-, amenities F.
- Seminole (suburban): math 57% / reading 61% proficiency, ranked #13 of 73 in FL (top 18%) — acceptable for families but not a draw, mixed tenant base, ~2y average lease.
- Zoned schools: Casselberry Elementary School (math 68% / reading 65%, grade B+, #473 of 2,144 statewide, top 23%, 766 students, 70% FRL); South Seminole Middle School (math 53% / reading 50%, grade C, #232 of 571 statewide, top 41%, 995 students, 69% FRL); Lake Howell High School (math 36% / reading 49%, grade F, #264 of 667 statewide, top 41%, 2,205 students, 51% FRL) — zoned schools average 64% FRL vs 38% district-wide (25 pts higher); higher-poverty schools than district average — tighter screening recommended.
- Market conditions: Rents rising (+2.1%/yr); 189 active listings in the ZIP; 25 comparable units currently listed for rent nearby; rentals leasing fast (median 7d on market — plan ~1-2 weeks tenant-placement turnaround); 1,979 units permitted in Seminole County in 2024 (1,191 in 5+ unit buildings).
- This rent runs 30% of the median local income ($69k/yr) — at the standard rent-burdened threshold; future hikes will face affordability resistance.
Forward outlook
- Local home prices are declining (-3.0%/yr); year-one equity from $1k of loan paydown is wiped out by about $4k of value loss. Plan a longer hold.
- Seminole County population projected at +24% by 2050 — long-run rental-demand tailwind backs the buy-and-hold thesis.
Negotiation context
- It's been on market 104 days — a 9% lower offer ($136k) is reasonable based on typical stale-listing flexibility.
Risks & watch-outs
- Watch-outs: HOA is 24% of rent.
- Climate carrying-cost: severe wind risk, 99% chance of damaging wind over 30y; extreme-heat days projected 7→23/yr by 2055 (HVAC capex compounding) — expect insurance premiums to compound above CPI over the hold.
Questions for the listing agent
- What do current leases actually rent for vs. the listed asking? Can we see a recent rent roll and the last 12 months of T-12 income?
- It's been on market 104 days. Have you received any prior offers? Is the seller open to a 9% concession, seller financing, or rate buy-down credit?
- What does the HOA fee cover, when was the last increase, and are there any pending special assessments or reserve-fund shortfalls?
- Any open or pending special assessments — roof, HVAC, plumbing, elevator, façade? What's the per-unit balance and payoff schedule, and is the seller paying it off at close or rolling it to the buyer?
- Why hasn't it sold? Are there any deal-killer items the seller is aware of (foundation, flood, title, zoning, code violations)?
- Is there a deadline driving the sale (1031 exchange, divorce, estate, relocation)? That informs how much negotiation room exists.
- Schools are B-rated — typically a magnet for longer-tenancy family renters. What's the average tenant stay here, and is there a school-zone premium baked into asking?
- The area grade is low — what's the realistic commute time and amenity access for the typical tenant pool here? Any planned neighborhood developments (good or bad) we should know about?
- What's the average days-on-market for RENTAL listings here right now (not sales)? A rising rental-DOM trend means longer vacancies and softer asking-rent achievability than the comps imply.
- What's the recent tenant-quality profile in this submarket — average credit score on applications, eviction rate, late-payment / NSF rate, and stable-employment percentage? A property-management company in the area should have these aggregated.
- How much new apartment / multifamily construction is in the pipeline within 1–3 miles? Heavy new supply (>2% of stock underway) typically softens rents 12–24 months out; light construction supports rent growth.
Investment metrics
- 1% rule
- 1.18% ✓
- Cap rate
- 5.71%
- Cash-on-cash
- -2.07%
- DSCR
- 0.91
- GRM
- 7.1
CMA / ARV
No comps found within radius.
Projected returns pro-forma
-3.0% appreciation · 2.09% rent growth · sell at horizon
- IRR
- -20.9%
- Equity multiple
- 0.28×
- Total profit
- $-30,028
- Equity at exit
- $22,216
- IRR
- -17.0%
- Equity multiple
- 0.11×
- Total profit
- $-37,281
- Equity at exit
- $12,883
Cash invested: $41,720 (down + closing). Projections, not guarantees.
Landlord ↔ Tenant lean methodology
- Overall (STATE)
- 87 Strongly Landlord-Friendly
- State Florida
- 87 Strongly Landlord-Friendly · R+3
- County
- — inherits STATE
- City
- — inherits STATE
ZIP-level market 32707
- Rents YoY
- 2.1%
- Active inventory
- 189
- Price-to-rent
- 7.1×
Monthly cashflow live
- Estimated rent
- $1,751 high interval (Pro) →
- Mortgage (P&I)
- −$781
- Tax from tax record
- −$193 /mo · $2,317/yr
- Insurance
- −$62
- HOA
- −$419
- Vacancy / Maint / Mgmt
- −$368
- Net cashflow
- $-72
Break-even live
Sensitivity live
| Price | -10% $12 | -5% $-30 | +0% $-72 | +5% $-114 | +10% $-156 |
|---|---|---|---|---|---|
| Rent | -10% $-210 | -5% $-141 | +0% $-72 | +5% $-3 | +10% $66 |
| Rate | -1.0pp $3 | -0.5pp $-34 | base $-72 | +0.5pp $-111 | +1.0pp $-150 |
UW: 25.0% down · 7.5% · 30yr · 1.5% tax · 5.0% vac · 8.0% maint · 8.0% mgmt
Financing live
Cash to close
- Down payment
- $37,250
- Closing costs
- $4,470
- Reserves months
- —
- Total cash needed
- —
Loan-product check · same deal, 3 products live
Conventional
25% down · 7.5% · 30yr
- Down + closing
- —
- Monthly P&I
- —
- Monthly cashflow
- —
- DSCR
- —
- Eligible?
- —
Personal DTI + credit; lowest rate.
DSCR
20% down · 8.5% · 30yr
- Down + closing
- —
- Monthly P&I
- —
- Monthly cashflow
- —
- DSCR
- —
- Eligible?
- —
No personal income docs; deal must DSCR.
Hard money
10% down · 12.0% · 12mo
- Down + closing
- —
- Monthly P&I
- —
- Monthly cashflow
- —
- DSCR
- —
- Eligible?
- —
Short-term bridge; refi at stabilization.
Rent comps 25 comps
| Address | Beds | Baths | Sqft | Rent | $/sqft | DOM | Units | Dist |
|---|---|---|---|---|---|---|---|---|
| 610 Kenwick Cir #103 Casselberry, FL | 2.0 | 2.0 | 1126 | $1,600 | $1.42 | 18d | 1 | 0.03mi |
| 644 Kenwick Cir Casselberry, FL | 2.0 | 2.0 | 1126 | $1,575 | $1.40 | 18d | 1 | 0.06mi |
| 400 Sandpiper Ln Casselberry, FL | 1.0–3.0 | 1.0–2.0 | 937 | $1,612 | $1.72 | 0d | 10 | 0.31mi |
| 210 Welcome Way Fern Park, FL | 2.0 | 1.0–2.0 | 880 | $1,469 | $1.67 | 0d | 13 | 0.45mi |
| 310 Kentia Rd Casselberry, FL | 3.0 | 1.0 | 1034 | $1,800 | $1.74 | 16d | 1 | 0.52mi |
| 120 Waverly Dr Fern Park, FL | 3.0 | 2.0 | 1233 | $2,159 | $1.75 | 6d | 1 | 0.66mi |
| 2174 Sharp Ct Fern Park, FL | 1.0–2.0 | 1.0 | 664 | $1,379 | $2.08 | 0d | 18 | 0.75mi |
| 1000 Lake of the Woods Blvd Fern Park, FL | 2.0 | 1.0–2.0 | 945 | $1,525 | $1.61 | 25d | 2 | 0.83mi |
| 1000 Lake of the Woods Blvd Fern Park, FL | 1.0–2.0 | 1.0–2.0 | 886 | $1,600 | $1.80 | 6d | 3 | 0.83mi |
| 660 Jasmine Rd Casselberry, FL | 2.0 | 1.0 | 953 | $1,725 | $1.81 | 6d | 1 | 0.87mi |
| 2155 Fontebranda Loop Unit 180100 Casselberry, FL | 2.0 | 2.0 | 1020 | $1,799 | $1.76 | 25d | 1 | 0.90mi |
| 2155 Fontebranda Loop Unit 150212 Casselberry, FL | 1.0 | 1.0 | 794 | $1,599 | $2.01 | 25d | 1 | 0.90mi |
| 2401 Harleyford Pl Casselberry, FL | 3.0 | 2.5 | 1333 | $1,995 | $1.50 | 23d | 1 | 0.93mi |
| 1003 Sherrywood St Fern Park, FL | 2.0 | 2.0 | 1296 | $1,995 | $1.54 | 0d | 1 | 0.93mi |
| 512 El Dorado Way Casselberry, FL | 3.0 | 1.0 | 1094 | $1,895 | $1.73 | 6d | 1 | 1.01mi |
| 1227 Merritt St Altamonte Springs, FL | 3.0 | 2.0 | 1280 | $2,100 | $1.64 | 25d | 1 | 1.03mi |
| 617 E Helm Way Casselberry, FL | 3.0 | 1.0 | 1000 | $1,995 | $2.00 | 6d | 1 | 1.11mi |
| 202 Esplanade Way Unit Esplanade Way-202 Casselberry, FL | 1.0 | 1.0 | 722 | $1,200 | $1.66 | 25d | 1 | 1.12mi |
| 291 Ivey Rd Casselberry, FL | 3.0 | 2.0 | 1100 | $2,190 | $1.99 | 5d | 1 | 1.23mi |
| 400 Morrill Ter Casselberry, FL | 2.0 | 1.0 | 1000 | $1,550 | $1.55 | 6d | 1 | 1.39mi |
| 1166 Pointe Newport Ter Casselberry, FL | 1.0–3.0 | 1.0–2.0 | 961 | $1,768 | $1.84 | 6d | 16 | 1.39mi |
| 117 Georgetown Dr Unit C Casselberry, FL | 2.0 | 2.0 | 1095 | $1,550 | $1.42 | 25d | 1 | 1.41mi |
| 602 Desoto Dr Casselberry, FL | 3.0 | 2.0 | 1405 | $2,500 | $1.78 | 6d | 1 | 1.42mi |
| 602 Desoto Dr Casselberry, FL | 3.0 | 2.0 | 1405 | $2,475 | $1.76 | 0d | 1 | 1.42mi |
| 112 Highland Dr Fern Park, FL | 3.0 | 1.0 | 1192 | $1,880 | $1.58 | 0d | 1 | 1.42mi |
HOA detail condo
- Monthly dues
- $419 · $5,028/yr
- Likely covers
- watertrashexterior maint.pool
- Assessments
- None detected in remarks — confirm with the listing agent.
Listing history 2 events
-
2026-05-04price $149,000
-
2026-02-11$158,800 Active
ⓘ Source: listings_history table (triggers on properties + properties_extension) + one-shot
backfill from property_details.listing_events for pre-trigger history.
Tax reassessment forecast FL · Resets to sale price
- Current annual tax
- $2,317 · $193/mo
- Projected year-2 tax
- $2,317 · $193/mo
- Expected delta
- $0/yr ($0/mo · 0.0%)
ⓘ Screening estimate from a state-policy table — verify with the county assessor before closing.
Climate risk First Street
- Flood 1/10 Low FEMA zone X (unshaded) · 0% chance over 30 yrs
- Wildfire 1/10 Low
- Heat 9/10 Extreme 7 d/yr ≥108°F today · 23 d/yr by 30 yrs out
- Wind 9/10 Extreme 99% chance of damaging wind over 30 yrs
- Air quality 2/10 Low 1 unhealthy d/yr today · 2 by 30 yrs out
Nearby sold comps map
Loading sold comps map…
Walkable amenities ~0.75 mi
Loading nearby amenities…
Taxation est. · year 1
- Rental income
- $21,016
- − Mortgage interest
- −$8,346
- − Property taxes
- −$2,317
- − Insurance
- −$745
- − Repairs & maintenance
- −$1,681
- − Management
- −$1,681
- − HOA
- −$5,028
- − Depreciation
- −$4,335
- Taxable loss
- −$3,117
- Est. tax savings @ 24.0%
- +$748
- After-tax cash flow
- $-115/yr
For passive investors: Depreciation is non-cash, so a rental often shows a tax loss while cash-flowing — sheltering income. Rental losses are passive: they offset passive income freely, and up to $25,000/yr can offset ordinary (W-2) income if you actively participate and your MAGI is under $100k (phasing out to $0 by $150k); unused losses carry forward. On sale, claimed depreciation is recaptured at up to 25%, and gains may owe capital-gains tax (a 1031 exchange can defer both). Figures are a year-1 estimate at your 24.0% rate — not tax advice; consult a CPA.
Schools (NCES district)
- District
- Seminole
- NCES district ID
- 1201710
- Math proficiency
- 57% ▼ -7.00%
- Reading proficiency
- 61% ▼ -1.00%
- Median HH income
- $58,478
- Composite
- 51.05/100
- National rank
- #1769
- State rank
- #13 of 73 in FL
Livability — Casselberry
- Score
- 73/100
- State rank
- #314
- US rank
- #5320
Category grades
Schools grade is shown separately in the Schools card above.
Census & demographics
- Census place
- Casselberry, FL
- County
- Seminole County · 436,154 people
- City population
- 45,584
- Metro
- Orlando-Kissimmee-Sanford, FL
- Population (ZIP)
- 39,493
- Household income
- $69,113
- Rent vs Own
- Severe rent burden
- 1482.0
Population outlook (Seminole County) Hauer SSP2
- Today (2025)
- 515,494 people
- By 2030
- 545,713 · +5.9%
- By 2040
- 598,068 · +16.0%
- By 2050
- 640,663 · +24.3%
- By 2075
- 724,461 · +40.5%
- By 2100
- 755,530 · +46.6%
Race, ethnicity, and origin ACS 2023
- Neighborhood character
- Diverse neighborhood (Simpson 0.61)
- Race & ethnicity
- White 56% Hispanic / Latino 27% Two or more races 14% Black 10% Asian 4%
- Hispanic origin (detail)
- Mexican 3% Puerto Rican 12% Cuban 4% Dominican 2%
- Common ancestry
- Hispanic 3% Romanian 2% Lithuanian 2%
- Foreign-born
- 15% · Canada, Jamaica, China
- Languages at home
- 76% English-only · Spanish 18% French/Haitian/Cajun 2% Other Indo-European 1%
Political lean MEDSL · Seminole
- 2024 margin
- Toss-up / Even · D 47.6% · R 51.1% · Other 1.3%
- 2008→2024 swing
- -0.8pp no change · 2008: -2.8pp · 2024: -3.5pp
- All cycles
- 2024: R+3.5 2020: D+2.8 2016: R+1.6 2012: R+6.5 2008: R+2.8
Not yet ingested
- Civics
- —
Market trends
- HPI YoY
- ▼ -251.90%
- Current HPI
- 342.1006
- Rent YoY
- ▲ 2.09%
- Metro
- Orlando-Kissimmee-Sanford, FL
- State GDP YoY
- ▲ 3.28%
- F500 in state
- 36
Industry mix (Fortune 500 HQ in FL)
| Industry | F500 HQs | Revenue |
|---|---|---|
| Industrial Technology | 2 | $29B |
|
||
| Insurance | 2 | $17B |
|
||
| Retail | 1 | $60B |
|
||
| Technology Distribution | 1 | $58B |
|
||
| Homebuilding | 1 | $35B |
|
||
| Technology Manufacturing | 1 | $35B |
|
||
Price history
-6.2% since first listed2 events — show timeline
- 2026-05-04 Price Changed $149,000 Stellar MLS as Distributed by MLS Grid
- 2026-02-11 Listed $158,800 Stellar MLS as Distributed by MLS Grid
Property tax history
+10.6%/yrLatest (2025): $2,317 · +9.0% YoY. Source: county tax records.
Cash-flow waterfall
monthlySold comps — $/sqft
last 12 mo · ≤1 miLoading sold comps…