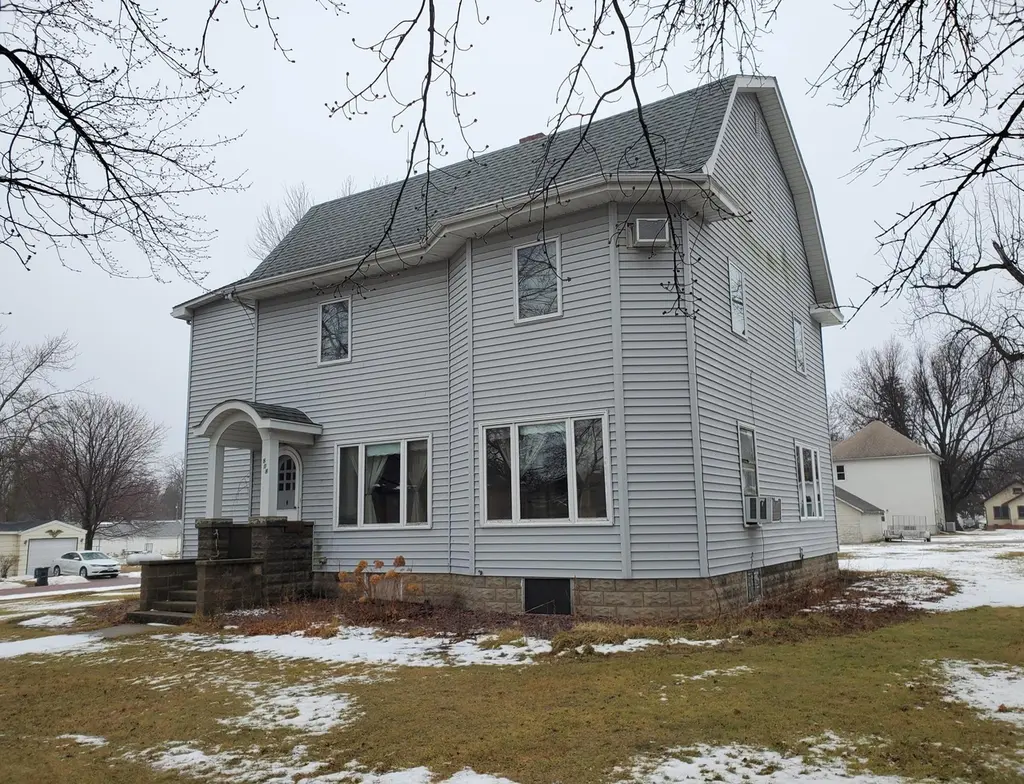
808 Adams Ave · Westbrook, MN
Flood risk 1/10 · Minimal
- FEMA flood zone
- X (unshaded)
- Chance of flooding over 30 yrs
- 0.0%
- Est. flood insurance / yr
- $507 – $1,088
Fire risk 1/10 · Minimal
- Est. fire insurance / yr
- $888 – $1,650
Heat risk 2/10 · Minimal
- Hot days now (above 98°F)
- 7 days/yr
- Hot days in 30 yrs
- 15 days/yr
Wind risk 2/10 · Minimal
- Chance of severe wind over 30 yrs
- —
Air-quality risk 2/10 · Minimal
- Unhealthy air days now
- 1 days/yr
- Unhealthy air days in 30 yrs
- 1 days/yr
Risk factors via First Street. Map © Google.
Why this score? — see what drove the D+ grade
The composite is a weighted blend of 9 inputs, each scored 0–100. Each bar is that input's sub-score; the figure is the points it added to the 100-point composite (weight × sub-score).
- Cash flow +10.8/30.0
- Appreciation +7.7/10.0
- ARV discount +7.5/15.0
- 1% rule +3.9/10.0
- Livability +3.7/5.0
- Schools +3.6/10.0
- DSCR +3.1/10.0
- Rent growth +2.5/5.0
- Condition / age +2.5/5.0
$135,000
🖨 Deal sheet (PDF) 📄 Offer letter ✓ Due diligence
Listing remarks MLS
This is the ONE!!! Situated on a corner lot, this hidden gem has plenty of space for all. It features 5 bedrooms on the upper level with a bonus room on the main floor. The foyer has plenty of space to lounge in front of the fireplace during those chilly months. The living room flows right into the dining room creating unforgettable family memories. Tucked away is the kitchen area with its own stairway leading to the upper level. Need additional space to entertain/host, the attic and basement just needs your finishing touches. Come check it out today and let your creativity run wild.
Key facts
- Attic
- Kitchen area
- Basement
Tags
Neighborhood map
What this means for you Summary
Snapshot
- This is a 5-bed/2.0-bath single-family listed at $135k.
Deal economics
- At list price, monthly cash flow is $-61 ($-736/yr) — negative.
- To cash-flow at today's rent, offer at most $124k (8.0% below list).
- To meet the 1% rule (rent ≥ 1% of price), the offer needs to be $120k (10.8% below list).
- Recommended offer: $120k (10.8% below list) — sets the bar for 1% rule.
Location & tenants
- Location reads 74/100 on livability (#229 in MN, #4,836 nationally) — a middle-class / working-renter tenant base. Strengths: crime A+, cost of living A+, health & safety A+; Watch: amenities F, commute F, employment D-.
- Westbrook-Walnut Grove Schools (rural): math 42% / reading 42% proficiency, ranked #213 of 301 in MN (top 71%) — families likely to look elsewhere, expect single-tenant / working-renter base with shorter leases.
- Zoned schools: Walnut Grove Elementary (math 52% / reading 42%, grade D-, #492 of 857 statewide, top 61%, 297 students, 61% FRL); Westbrook-Walnut Grove Secondary (math 27% / reading 37%, grade F, #335 of 471 statewide, top 73%, 183 students, 54% FRL).
- Market conditions: 18 active listings in the ZIP; 29 units permitted in Cottonwood County in 2024 (15 in 5+ unit buildings).
Forward outlook
- In year one you build about $8k of equity ($933 loan paydown + $7k appreciation (5.3% local appreciation)).
- Cottonwood County population projected to shrink 9% by 2050 — rents likely to lag national; underwrite the cash flow, not the appreciation.
- At projected returns (5.3% appreciation + 3.0% rent growth), your $38k cash investment doubles in ~5 years — after that, you're playing with house money.
- By year 5, paydown + projected appreciation supports a ~$35k cash-out refi (75% LTV) — recoverable capital for the next deal without selling this one.
Negotiation context
- It's been on market 111 days — a 9% lower offer ($123k) is reasonable based on typical stale-listing flexibility.
- 3 sale attempts since 8y ago with the ask held roughly flat each time — persistent listings suggest the price (not the market) is what's stuck; bring a comps-based counter.
- Current owner paid $75k; list at $135k implies a 80% gain — meaningful room to come down on a strong offer.
Risks & watch-outs
- Watch-outs: built in 1910 — expect roof / HVAC / electrical / plumbing capex.
Questions for the listing agent
- What do current leases actually rent for vs. the listed asking? Can we see a recent rent roll and the last 12 months of T-12 income?
- It's been on market 111 days. Have you received any prior offers? Is the seller open to a 11% concession, seller financing, or rate buy-down credit?
- Built in 1910 — when were the roof, HVAC, electrical panel, plumbing, and water heater last replaced?
- Why hasn't it sold? Are there any deal-killer items the seller is aware of (foundation, flood, title, zoning, code violations)?
- Is there a deadline driving the sale (1031 exchange, divorce, estate, relocation)? That informs how much negotiation room exists.
- Schools are D-rated, which usually means shorter tenancies and higher turnover. Who's the typical renter profile here, and what's been the actual vacancy rate?
- The area grade is low — what's the realistic commute time and amenity access for the typical tenant pool here? Any planned neighborhood developments (good or bad) we should know about?
- What's the average days-on-market for RENTAL listings here right now (not sales)? A rising rental-DOM trend means longer vacancies and softer asking-rent achievability than the comps imply.
- What's the recent tenant-quality profile in this submarket — average credit score on applications, eviction rate, late-payment / NSF rate, and stable-employment percentage? A property-management company in the area should have these aggregated.
- How much new for-sale + rental construction is in the pipeline within 1–3 miles? Heavy new supply typically softens prices + rents 12–24 months out; constrained supply supports both.
Investment metrics
- 1% rule
- 0.89% ✗
- Cap rate
- 5.75%
- Cash-on-cash
- -1.95%
- DSCR
- 0.91
- GRM
- 9.3
CMA / ARV
No comps found within radius.
Projected returns pro-forma
5.32% appreciation · 3.0% rent growth · sell at horizon
- IRR
- 12.1%
- Equity multiple
- 1.79×
- Total profit
- $29,719
- Equity at exit
- $79,101
- IRR
- 13.1%
- Equity multiple
- 3.44×
- Total profit
- $92,273
- Equity at exit
- $138,716
Cash invested: $37,800 (down + closing). Projections, not guarantees.
Landlord ↔ Tenant lean methodology
- Overall (STATE)
- 46 Balanced
- State Minnesota
- 46 Balanced · D+2
- County
- — inherits STATE
- City
- — inherits STATE
ZIP-level market 56183
- Home prices YoY
- 2.5%
- Active inventory
- 18
- Price-to-rent
- 9.3×
Monthly cashflow live
- Estimated rent
- $1,205 medium interval (Pro) →
- Mortgage (P&I)
- −$708
- Tax from tax record
- −$249 /mo · $2,986/yr
- Insurance
- −$56
- HOA
- −$0
- Vacancy / Maint / Mgmt
- −$253
- Net cashflow
- $-61
Break-even live
Sensitivity live
| Price | -10% $15 | -5% $-23 | +0% $-61 | +5% $-100 | +10% $-138 |
|---|---|---|---|---|---|
| Rent | -10% $-157 | -5% $-109 | +0% $-61 | +5% $-14 | +10% $34 |
| Rate | -1.0pp $7 | -0.5pp $-27 | base $-61 | +0.5pp $-96 | +1.0pp $-132 |
UW: 25.0% down · 7.5% · 30yr · 1.5% tax · 5.0% vac · 8.0% maint · 8.0% mgmt
Financing live
Cash to close
- Down payment
- $33,750
- Closing costs
- $4,050
- Reserves months
- —
- Total cash needed
- —
Loan-product check · same deal, 3 products live
Conventional
25% down · 7.5% · 30yr
- Down + closing
- —
- Monthly P&I
- —
- Monthly cashflow
- —
- DSCR
- —
- Eligible?
- —
Personal DTI + credit; lowest rate.
DSCR
20% down · 8.5% · 30yr
- Down + closing
- —
- Monthly P&I
- —
- Monthly cashflow
- —
- DSCR
- —
- Eligible?
- —
No personal income docs; deal must DSCR.
Hard money
10% down · 12.0% · 12mo
- Down + closing
- —
- Monthly P&I
- —
- Monthly cashflow
- —
- DSCR
- —
- Eligible?
- —
Short-term bridge; refi at stabilization.
Listing history 23 events
-
2026-06-21status $135,000 Pending 111 DOM
-
2026-06-18days on market $135,000 Active 111 DOM
-
2026-06-17days on market $135,000 Active 110 DOM
-
2026-06-16days on market $135,000 Active 109 DOM
-
2026-06-15days on market $135,000 Active 108 DOM
-
2026-06-13days on market $135,000 Active 106 DOM
-
2026-06-12days on market $135,000 Active 105 DOM
-
2026-06-09days on market $135,000 Active 102 DOM
-
2026-06-08days on market $135,000 Active 101 DOM
-
2026-06-07days on market $135,000 Active 100 DOM
-
2026-06-07days on market $135,000 Active 99 DOM
-
2026-06-04days on market $135,000 Active 96 DOM
-
2026-06-02days on market $135,000 Active 95 DOM
-
2026-06-01days on market $135,000 Active 94 DOM
-
2026-05-31days on market $135,000 Active 93 DOM
-
2026-05-31days on market $135,000 Active 92 DOM
-
2026-02-27$135,000 Active 590-char remark
Show marketing remark (590 chars)
This is the ONE!!! Situated on a corner lot, this hidden gem has plenty of space for all. It features 5 bedrooms on the upper level with a bonus room on the main floor. The foyer has plenty of space to lounge in front of the fireplace during those chilly months. The living room flows right into the dining room creating unforgettable family memories. Tucked away is the kitchen area with its own stairway leading to the upper level. Need additional space to entertain/host, the attic and basement just needs your finishing touches. Come check it out today and let your creativity run wild.
-
2025-12-27historical
-
2025-06-07price $165,000
-
2024-12-30$175,900 Active
-
2019-02-02historical
-
2018-12-21soldstatus $75,000
-
2018-04-13$84,900
ⓘ Source: listings_history table (triggers on properties + properties_extension) + one-shot
backfill from property_details.listing_events for pre-trigger history.
Tax reassessment forecast MN · Partial reset (capped growth)
- Current annual tax
- $2,986 · $249/mo
- Projected year-2 tax
- $2,986 · $249/mo
- Expected delta
- $0/yr ($0/mo · 0.0%)
ⓘ Screening estimate from a state-policy table — verify with the county assessor before closing.
Climate risk First Street
- Flood 1/10 Low FEMA zone X (unshaded) · 0% chance over 30 yrs
- Wildfire 1/10 Low
- Heat 2/10 Low 7 d/yr ≥98°F today · 15 d/yr by 30 yrs out
- Wind 2/10 Low
- Air quality 2/10 Low 1 unhealthy d/yr today · 1 by 30 yrs out
Nearby sold comps map
Loading sold comps map…
Walkable amenities ~0.75 mi
Loading nearby amenities…
Taxation est. · year 1
- Rental income
- $14,456
- − Mortgage interest
- −$7,562
- − Property taxes
- −$2,986
- − Insurance
- −$675
- − Repairs & maintenance
- −$1,157
- − Management
- −$1,157
- − Depreciation
- −$3,927
- Taxable loss
- −$3,007
- Est. tax savings @ 24.0%
- +$722
- After-tax cash flow
- $-14/yr
For passive investors: Depreciation is non-cash, so a rental often shows a tax loss while cash-flowing — sheltering income. Rental losses are passive: they offset passive income freely, and up to $25,000/yr can offset ordinary (W-2) income if you actively participate and your MAGI is under $100k (phasing out to $0 by $150k); unused losses carry forward. On sale, claimed depreciation is recaptured at up to 25%, and gains may owe capital-gains tax (a 1031 exchange can defer both). Figures are a year-1 estimate at your 24.0% rate — not tax advice; consult a CPA.
Schools (NCES district)
- District
- Westbrook-Walnut Grove Schools
- NCES district ID
- 2700183
- Math proficiency
- 42% ▼ -13.00%
- Reading proficiency
- 42% ▼ -8.00%
- Median HH income
- $43,672
- Composite
- 35.55/100
- National rank
- #4906
- State rank
- #213 of 301 in MN
Livability — Westbrook
- Score
- 74/100
- State rank
- #229
- US rank
- #4836
Category grades
Schools grade is shown separately in the Schools card above.
Census & demographics
- Census place
- Westbrook, MN
- Population (ZIP)
- 1,300
Population outlook (Cottonwood County) Hauer SSP2
- Today (2025)
- 11,130 people
- By 2030
- 10,916 · -1.9%
- By 2040
- 10,467 · -6.0%
- By 2050
- 10,136 · -8.9%
- By 2075
- 10,080 · -9.4%
- By 2100
- 10,091 · -9.3%
Race, ethnicity, and origin ACS 2023
- Neighborhood character
- Predominantly White (92%)
- Race & ethnicity
- White 92% Asian 4% Hispanic / Latino 2% Two or more races 1%
- Common ancestry
- Portuguese 18% Romanian 7% Lithuanian 2%
- Foreign-born
- 1%
- Languages at home
- 99% English-only · Other Asian/Pacific 1%
Political lean MEDSL · Cottonwood
- 2024 margin
- Solid R (+41.1) · D 28.6% · R 69.7% · Other 1.7%
- 2008→2024 swing
- -34.5pp toward R · 2008: -6.6pp · 2024: -41.1pp
- All cycles
- 2024: R+41.1 2020: R+38.2 2016: R+35.1 2012: R+15.1 2008: R+6.6
Not yet ingested
- Civics
- —
Market trends
- HPI YoY
- ▲ 5.32%
- Current HPI
- 215.6101
- Rent YoY
- —
- Metro
- —
- State GDP YoY
- ▲ 2.41%
- F500 in state
- 34
Industry mix (Fortune 500 HQ in MN)
| Industry | F500 HQs | Revenue |
|---|---|---|
| Healthcare | 2 | $407B |
|
||
| Retail | 2 | $150B |
|
||
| Consumer Goods | 2 | $32B |
|
||
| Industrial Machinery | 2 | $6B |
|
||
| Agriculture | 1 | $40B |
|
||
| Healthcare / Medical Devices | 1 | $32B |
|
||
Price history
+59.0% since first listed7 events — show timeline
- 2026-02-27 Listed $135,000 NORTHSTARMLS as Distributed by MLS Grid
- 2025-12-27 Listing Removed — NORTHSTARMLS as Distributed by MLS Grid
- 2025-06-07 Price Changed $165,000 NORTHSTARMLS as Distributed by MLS Grid
- 2024-12-30 Listed $175,900 NORTHSTARMLS as Distributed by MLS Grid
- 2019-02-02 Listing Removed — NORTHSTARMLS as Distributed by MLS Grid
- 2018-12-21 Sold (MLS) $75,000 NORTHSTARMLS as Distributed by MLS Grid
- 2018-04-13 Listed $84,900 NORTHSTARMLS as Distributed by MLS Grid
Property tax history
+76.1%/yrLatest (2025): $2,986 · +6.3% YoY. Source: county tax records.
Cash-flow waterfall
monthlySold comps — $/sqft
last 12 mo · ≤1 miLoading sold comps…