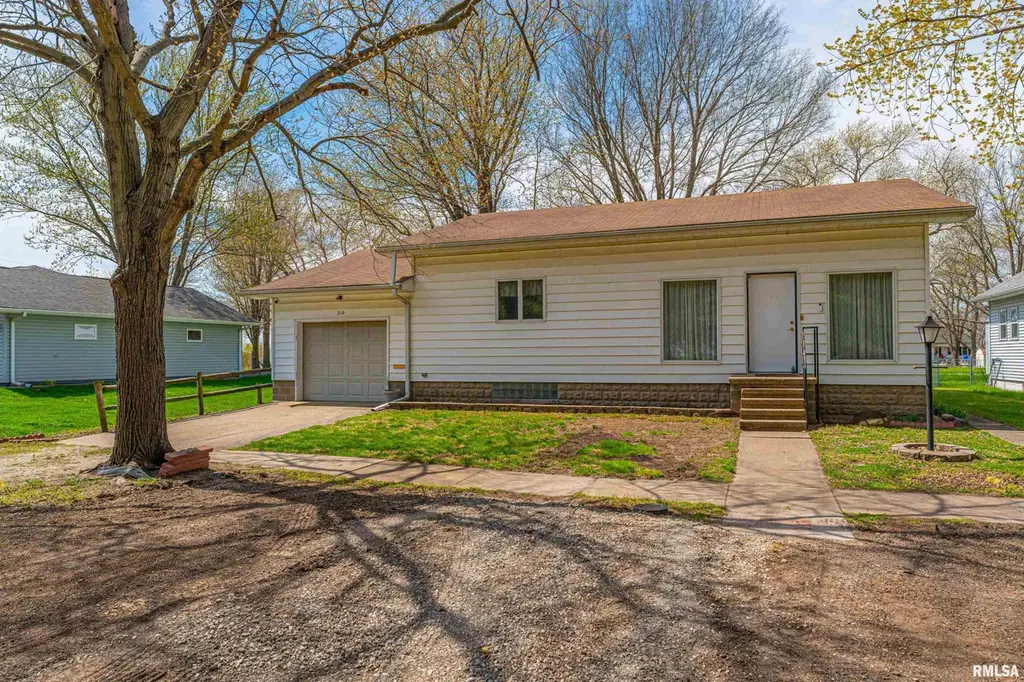
310 S 2nd St · Easton, IL
Flood risk 1/10 · Minimal
- FEMA flood zone
- X (unshaded)
- Chance of flooding over 30 yrs
- 0.0%
- Est. flood insurance / yr
- $473 – $860
Fire risk 1/10 · Minimal
- Est. fire insurance / yr
- $804 – $1,492
Heat risk 3/10 · Minor
- Hot days now (above 104°F)
- 7 days/yr
- Hot days in 30 yrs
- 19 days/yr
Wind risk 2/10 · Minimal
- Chance of severe wind over 30 yrs
- 1.0%
Air-quality risk 2/10 · Minimal
- Unhealthy air days now
- 1 days/yr
- Unhealthy air days in 30 yrs
- 2 days/yr
Risk factors via First Street. Map © Google.
Why this score? — see what drove the C+ grade
The composite is a weighted blend of 9 inputs, each scored 0–100. Each bar is that input's sub-score; the figure is the points it added to the 100-point composite (weight × sub-score).
- Cash flow +30.0/30.0
- 1% rule +10.0/10.0
- DSCR +10.0/10.0
- Appreciation +5.0/10.0
- Livability +2.9/5.0
- Rent growth +2.5/5.0
- Condition / age +2.5/5.0
- Schools +1.3/10.0
- ARV discount +0.0/15.0
$65,000
🖨 Deal sheet (PDF) 📄 Offer letter ✓ Due diligence
Listing remarks
Situated at the end of a dead-end street on a roomy 59X157 lot, this move-in ready and reasonably priced all electric two-bedroom vinyl sided ranch style home can be owned for less than rent! The interior boasts a generous 17X20 living room, 18X15 equipped eat-in kitchen with an open staircase that leads to a full basement, two nice sized bedrooms, and a full hall updated bath. The full open concept basement offers mechanicals, operable shower, and amazing work/storage space. Property also features an attached garage with a rear attached workshop area, detached storage shed, and a rear concrete patio. Combine low taxes with a low list price and you will find this small-town Mason County res
Key facts
- Open staircase
- Attached garage
- Work storage space
Tags
Property features AI
Exterior
- Parking: Attached 1-car garage
- Utilities: Public water; Public sewer
- Home design: Single family residence; Single-story main living with additional upper, lower and basement levels
- Construction: Shingle roof; Not new construction
- Exterior features: Level lot; Shed(s)
Interior
- Kitchen: Refrigerator
- Bedrooms: Two bedrooms (both on the main level)
- Flooring: Carpet in bedrooms, living room, and kitchen
- Bathrooms: One full bathroom
- Heating & cooling: Central air conditioning; Electric forced-air heating
- Interior features: Ceiling fan(s); Full, unfinished basement
- Laundry & utility: Laundry room in the basement
Neighborhood map
What this means for you Summary
Snapshot
- This is a 2-bed/1.0-bath single-family listed at $65k.
Deal economics
- At list price, monthly cash flow is $350 ($4k/yr) — positive.
- The deal already cash-flows at list — no discount required.
- Meets the 1% rule at list price ($973 rent vs $65k).
- Recommended offer: $64k (1.5% below list) — sets the bar for market timing.
Location & tenants
- Location reads 58/100 on livability (#1,138 in IL) — a working-class tenant base; expect higher turnover. Strengths: cost of living A+, housing A+; Watch: crime D, employment D, amenities F.
- Illini Central CUSD 189 (rural): math 11% / reading 18% proficiency, ranked #514 of 620 in IL (top 83%) — low school quality limits family demand, transient renter base, plan for 1-2y turnover.
- Zoned schools: Illini Central Grade School (math 17% / reading 22%, grade F, #1,054 of 2,056 statewide, top 54%, 252 students, 0% FRL); Illini Central Middle School (math 8% / reading 17%, grade F, #550 of 665 statewide, top 84%, 142 students, 0% FRL); Illini Central High School (math 5% / reading 15%, grade F, #528 of 693 statewide, top 82%, 185 students, 0% FRL) — zoned schools average 0% FRL vs 44% district-wide (44 pts lower); this property's tenant base skews higher-income than the district average.
- Market conditions: 2 active listings in the ZIP; 7 units permitted in Mason County in 2024 (0 in 5+ unit buildings).
Forward outlook
- In year one you build about $2k of equity ($449 loan paydown + $2k appreciation (3.0% local appreciation)).
- Mason County population projected at -30% by 2050 — secular population decline; favor cash flow + early exit over multi-decade hold.
- At projected returns (3.0% appreciation + 3.0% rent growth), your $18k cash investment doubles in ~3 years — after that, you're playing with house money.
Negotiation context
- It's been on market 18 days — a 2% lower offer ($64k) is reasonable based on typical stale-listing flexibility.
- Current owner paid $27k; list at $65k implies a 141% gain — meaningful room to come down on a strong offer.
Questions for the listing agent
- Is there a deadline driving the sale (1031 exchange, divorce, estate, relocation)? That informs how much negotiation room exists.
- Schools are F-rated, which usually means shorter tenancies and higher turnover. Who's the typical renter profile here, and what's been the actual vacancy rate?
- Crime grade is D in this area — have there been break-ins, vandalism, or insurance claims at this property in the last 3 years? What carrier currently insures it and at what premium?
- What's the average days-on-market for RENTAL listings here right now (not sales)? A rising rental-DOM trend means longer vacancies and softer asking-rent achievability than the comps imply.
- What's the recent tenant-quality profile in this submarket — average credit score on applications, eviction rate, late-payment / NSF rate, and stable-employment percentage? A property-management company in the area should have these aggregated.
- How much new for-sale + rental construction is in the pipeline within 1–3 miles? Heavy new supply typically softens prices + rents 12–24 months out; constrained supply supports both.
Investment metrics
- 1% rule
- 1.50% ✓
- Cap rate
- 12.76%
- Cash-on-cash
- 23.08%
- DSCR
- 2.03
- GRM
- 5.6
CMA / ARV
- ARV (on-the-fly)
- $48,752
- Comps found
- 8
Show comp detail 8 sales within ~0.75 mi
| Address | Dist | Beds/Ba | Sqft | Sold | Price | $/sf | Match |
|---|---|---|---|---|---|---|---|
| 310 S 2nd St | 0.00mi | 2/1.0 | 1,108 (0%) | 0mo | $60,000 | $54 | 100 |
| 311 S 3rd St | 0.05mi | 2/1.0 | 1,100 (-1%) | 21mo | $25,000 | $23 | 79 |
| 202 S 1st St | 0.14mi | 1/1.0 (-1) | 1,025 (-8%) | 5mo | $13,500 | $13 | 72 |
| 113 N 1st St | 0.30mi | 2/1.0 | 1,030 (-7%) | 4mo | $45,000 | $44 | 71 |
| 210 N 2nd St | 0.34mi | 2/1.0 | 1,008 (-9%) | 2mo | $15,505 | $15 | 67 |
| 205 N 3rd St | 0.33mi | 2/1.0 | 1,093 (-1%) | 20mo | $35,000 | $32 | 66 |
| 302 S 2nd St | 0.05mi | 3/1.0 (+1) | 1,026 (-7%) | 19mo | $99,000 | $96 | 65 |
| 302 S 1st St | 0.09mi | 3/1.0 (+1) | 1,056 (-5%) | 24mo | $51,000 | $48 | 63 |
Match score weights: distance 35% · size 25% · config 20% · recency 20%. Top-matched comps best support the ARV.
Projected returns pro-forma
3.0% appreciation · 3.0% rent growth · sell at horizon
- IRR
- 29.2%
- Equity multiple
- 2.66×
- Total profit
- $30,123
- Equity at exit
- $29,227
- IRR
- 29.7%
- Equity multiple
- 5.18×
- Total profit
- $75,991
- Equity at exit
- $45,042
Cash invested: $18,200 (down + closing). Projections, not guarantees.
Landlord ↔ Tenant lean methodology
- Overall (STATE)
- 43 Moderately Tenant-Leaning
- State Illinois
- 43 Moderately Tenant-Leaning · D+7
- County
- — inherits STATE
- City
- — inherits STATE
ZIP-level market 62633
- Active inventory
- 2
- Price-to-rent
- 5.6×
Monthly cashflow live
- Estimated rent
- $973 medium interval (Pro) →
- Mortgage (P&I)
- −$341
- Tax from tax record
- −$51 /mo · $607/yr
- Insurance
- −$27
- HOA
- −$0
- Vacancy / Maint / Mgmt
- −$204
- Net cashflow
- $350
Break-even live
Sensitivity live
| Price | -10% $387 | -5% $368 | +0% $350 | +5% $332 | +10% $313 |
|---|---|---|---|---|---|
| Rent | -10% $273 | -5% $312 | +0% $350 | +5% $389 | +10% $427 |
| Rate | -1.0pp $383 | -0.5pp $367 | base $350 | +0.5pp $333 | +1.0pp $316 |
UW: 25.0% down · 7.5% · 30yr · 1.5% tax · 5.0% vac · 8.0% maint · 8.0% mgmt
Financing live
Cash to close
- Down payment
- $16,250
- Closing costs
- $1,950
- Reserves months
- —
- Total cash needed
- —
Loan-product check · same deal, 3 products live
Conventional
25% down · 7.5% · 30yr
- Down + closing
- —
- Monthly P&I
- —
- Monthly cashflow
- —
- DSCR
- —
- Eligible?
- —
Personal DTI + credit; lowest rate.
DSCR
20% down · 8.5% · 30yr
- Down + closing
- —
- Monthly P&I
- —
- Monthly cashflow
- —
- DSCR
- —
- Eligible?
- —
No personal income docs; deal must DSCR.
Hard money
10% down · 12.0% · 12mo
- Down + closing
- —
- Monthly P&I
- —
- Monthly cashflow
- —
- DSCR
- —
- Eligible?
- —
Short-term bridge; refi at stabilization.
Listing history 3 events
-
2026-04-28status Pending
-
2026-04-07$65,000 Active
-
2016-09-12soldstatus $27,000
ⓘ Source: listings_history table (triggers on properties + properties_extension) + one-shot
backfill from property_details.listing_events for pre-trigger history.
Tax reassessment forecast IL · Partial reset (capped growth)
- Current annual tax
- $607 · $51/mo
- Projected year-2 tax
- $1,041 · $87/mo
- Expected delta
- +$434/yr (+$36/mo · 71.5%)
ⓘ Screening estimate from a state-policy table — verify with the county assessor before closing.
Climate risk First Street
- Flood 1/10 Low FEMA zone X (unshaded) · 0% chance over 30 yrs
- Wildfire 1/10 Low
- Heat 3/10 Moderate 7 d/yr ≥104°F today · 19 d/yr by 30 yrs out
- Wind 2/10 Low 100% chance of damaging wind over 30 yrs
- Air quality 2/10 Low 1 unhealthy d/yr today · 2 by 30 yrs out
Nearby sold comps map
Loading sold comps map…
Walkable amenities ~0.75 mi
Loading nearby amenities…
Taxation est. · year 1
- Rental income
- $11,676
- − Mortgage interest
- −$3,641
- − Property taxes
- −$607
- − Insurance
- −$325
- − Repairs & maintenance
- −$934
- − Management
- −$934
- − Depreciation
- −$1,891
- Taxable income
- $3,343
- Est. tax owed @ 24.0%
- −$802
- After-tax cash flow
- $3,399/yr
For passive investors: Depreciation is non-cash, so a rental often shows a tax loss while cash-flowing — sheltering income. Rental losses are passive: they offset passive income freely, and up to $25,000/yr can offset ordinary (W-2) income if you actively participate and your MAGI is under $100k (phasing out to $0 by $150k); unused losses carry forward. On sale, claimed depreciation is recaptured at up to 25%, and gains may owe capital-gains tax (a 1031 exchange can defer both). Figures are a year-1 estimate at your 24.0% rate — not tax advice; consult a CPA.
Schools (NCES district)
- District
- Illini Central CUSD 189
- NCES district ID
- 1700113
- Math proficiency
- 11% ▼ -11.00%
- Reading proficiency
- 18% ▼ -18.00%
- Median HH income
- $46,086
- Composite
- 12.95/100
- National rank
- #9574
- State rank
- #514 of 620 in IL
Livability — Easton
- Score
- 58/100
- State rank
- #1138
- US rank
- #21495
Category grades
Schools grade is shown separately in the Schools card above.
Census & demographics
- Census place
- Easton, IL
- Population (ZIP)
- 609
Population outlook (Mason County) Hauer SSP2
- Today (2025)
- 12,087 people
- By 2030
- 11,283 · -6.7%
- By 2040
- 9,766 · -19.2%
- By 2050
- 8,421 · -30.3%
- By 2075
- 5,785 · -52.1%
- By 2100
- 3,888 · -67.8%
Race, ethnicity, and origin ACS 2023
- Neighborhood character
- Predominantly White (99%)
- Race & ethnicity
- White 99%
- Common ancestry
- Romanian 14% Lithuanian 4% Serbian 1%
- Foreign-born
- 0%
Political lean MEDSL · Mason
- 2024 margin
- Solid R (+42.2) · D 27.8% · R 70.1% · Other 2.1%
- 2008→2024 swing
- -48.1pp toward R · 2008: 5.9pp · 2024: -42.2pp
- All cycles
- 2024: R+42.2 2020: R+39.5 2016: R+31.8 2012: R+6.3 2008: D+5.9
Not yet ingested
- Civics
- —
Market trends
- HPI YoY
- —
- Current HPI
- —
- Rent YoY
- —
- Metro
- —
- State GDP YoY
- ▲ 1.59%
- F500 in state
- 60
Industry mix (Fortune 500 HQ in IL)
| Industry | F500 HQs | Revenue |
|---|---|---|
| Insurance | 4 | $201B |
|
||
| Consumer Goods | 4 | $87B |
|
||
| Industrial Machinery | 3 | $64B |
|
||
| Healthcare | 2 | $55B |
|
||
| Retail / Pharmacy | 1 | $148B |
|
||
| Agriculture / Food | 1 | $86B |
|
||
Price history
+140.7% since first listed3 events — show timeline
- 2026-04-28 Pending — RMLSA as Distributed by MLS Grid
- 2026-04-07 Listed $65,000 RMLSA as Distributed by MLS Grid
- 2016-09-12 Sold (Public Records) $27,000 Public Records
Property tax history
+4.7%/yrLatest (2024): $607 · +8.8% YoY. Source: county tax records.
Cash-flow waterfall
monthlySold comps — $/sqft
last 12 mo · ≤1 miLoading sold comps…