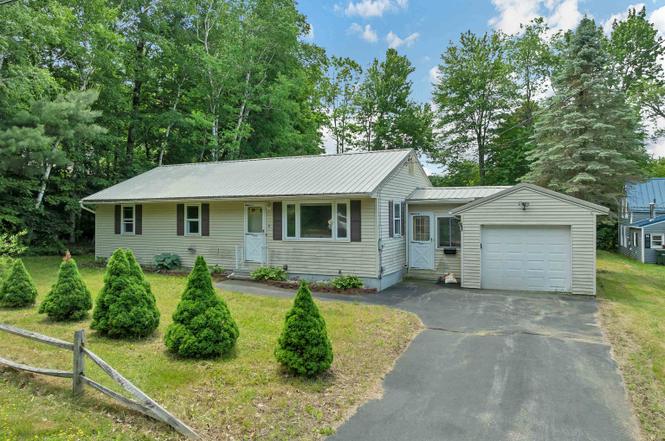
67 Lafayette St · Laconia, NH
Flood risk 4/10 · Minor
- FEMA flood zone
- X
- Chance of flooding over 30 yrs
- 0.22%
- Est. flood insurance / yr
- $473 – $860
Fire risk 1/10 · Minimal
- Est. fire insurance / yr
- $507 – $941
Heat risk 3/10 · Minor
- Hot days now (above 91°F)
- 7 days/yr
- Hot days in 30 yrs
- 16 days/yr
Wind risk 4/10 · Minor
- Chance of severe wind over 30 yrs
- 8.0%
Air-quality risk 2/10 · Minimal
- Unhealthy air days now
- 1 days/yr
- Unhealthy air days in 30 yrs
- 1 days/yr
Risk factors via First Street. Map © Google.
Why this score? — see what drove the D+ grade
The composite is a weighted blend of 9 inputs, each scored 0–100. Each bar is that input's sub-score; the figure is the points it added to the 100-point composite (weight × sub-score).
- ARV discount +15.0/15.0
- Cash flow +12.3/30.0
- Rent growth +5.0/5.0
- 1% rule +4.3/10.0
- Livability +4.0/5.0
- DSCR +3.6/10.0
- Condition / age +2.5/5.0
- Schools +2.4/10.0
- Appreciation +0.0/10.0
$199,000
🖨 Deal sheet (PDF) 📄 Offer letter ✓ Due diligence
Listing remarks MLS
Pride of ownership seen in this ranch home on quiet in-town location. New family room, metal roof, bath, windows, above ground pool. Beautiful yard. Must be seen!
Key facts
- Downtown amenities
- Manageable lot
- Shopping
Tags
Property features AI
Finance
- Other: Taxes TBD
Exterior
- Parking: Detached/attached garage with space for 1 vehicle
- Utilities: Public water; Public sewer; Circuit breaker electrical service; High-speed internet available; Cable available
- Home design: Ranch-style home; Existing construction; Facing direction not specified; Entry level not specified
- Construction: Built in 1986; Vinyl siding; Metal roof
- Exterior features: Level lot; Near shopping, hospital, and schools; Publicly maintained road frontage (97 ft); Paved driveway
Interior
- Bathrooms: One full bathroom
- Heating & cooling: Oil heat
- Interior features: Basement with interior access; Concrete basement and concrete floor; Four total rooms
Neighborhood map
What this means for you Summary
Snapshot
- This is a 2-bed/1.0-bath single-family listed at $199k.
Deal economics
- At list price, monthly cash flow is $-37 ($-441/yr) — negative.
- To cash-flow at today's rent, offer at most $193k (3.3% below list).
- To meet the 1% rule (rent ≥ 1% of price), the offer needs to be $185k (7.1% below list).
- Recommended offer: $185k (7.1% below list) — sets the bar for 1% rule.
- Cap rate 6.1% vs local median 1.8% in Laconia — top-decile yield for the area; either an underpriced asset or a hidden risk that comps aren't pricing in. Stress-test before assuming the spread holds.
Location & tenants
- Location reads 79/100 on livability (#20 in NH, #2,314 nationally) — a middle-class / working-renter tenant base. Strengths: cost of living A+, housing A+, health & safety A+; Watch: commute F.
- Laconia School District (town): math 24% / reading 31% proficiency, ranked #89 of 98 in NH (top 91%) — low school quality limits family demand, transient renter base, plan for 1-2y turnover.
- Zoned schools: Woodland Heights Elementary School (math 17% / reading 32%, grade F, #230 of 263 statewide, top 91%, 304 students, 65% FRL); Laconia Middle School (math 28% / reading 29%, grade F, #75 of 96 statewide, top 78%, 408 students, 47% FRL); Laconia High School (math 32% / reading 37%, grade F, #73 of 90 statewide, top 83%, 590 students, 39% FRL) — zoned schools at 50% FRL track the district average.
- Market conditions: Rents rising fast (+21.6%/yr); 188 active listings in the ZIP; 6 comparable units currently listed for rent nearby; rentals lingering (median 46d on market — plan ~5-8 weeks vacancy on turnover, expect pricing pressure); 100% of comp listings sitting > 30 days — soft ceiling on asking rent; 301 units permitted in Belknap County in 2024 (32 in 5+ unit buildings).
- This rent runs 30% of the median local income ($73k/yr) — at the standard rent-burdened threshold; future hikes will face affordability resistance.
Forward outlook
- Local home prices are declining (-3.0%/yr); year-one equity from $1k of loan paydown is wiped out by about $6k of value loss. Plan a longer hold.
- Belknap County population projected at -10% by 2050 — secular population decline; favor cash flow + early exit over multi-decade hold.
Negotiation context
- Only 1 days on market — expect competitive offers; lowballing is unlikely to land.
- 3 sale attempts since 29y ago with the ask held roughly flat each time — persistent listings suggest the price (not the market) is what's stuck; bring a comps-based counter.
- Current owner paid $170k; 17% above their basis — modest negotiation headroom, anchor on the comps not their cost.
Questions for the listing agent
- What do current leases actually rent for vs. the listed asking? Can we see a recent rent roll and the last 12 months of T-12 income?
- Is there a deadline driving the sale (1031 exchange, divorce, estate, relocation)? That informs how much negotiation room exists.
- Schools are D-rated, which usually means shorter tenancies and higher turnover. Who's the typical renter profile here, and what's been the actual vacancy rate?
- The area grade is low — what's the realistic commute time and amenity access for the typical tenant pool here? Any planned neighborhood developments (good or bad) we should know about?
- What's the average days-on-market for RENTAL listings here right now (not sales)? A rising rental-DOM trend means longer vacancies and softer asking-rent achievability than the comps imply.
- What's the recent tenant-quality profile in this submarket — average credit score on applications, eviction rate, late-payment / NSF rate, and stable-employment percentage? A property-management company in the area should have these aggregated.
- How much new for-sale + rental construction is in the pipeline within 1–3 miles? Heavy new supply typically softens prices + rents 12–24 months out; constrained supply supports both.
Investment metrics
- 1% rule
- 0.93% ✗
- Cap rate
- 6.07%
- Cash-on-cash
- -0.79%
- DSCR
- 0.96
- GRM
- 9.0
CMA / ARV
- ARV (on-the-fly)
- $311,472
- Comps found
- 12
Show comp detail 12 sales within ~0.75 mi
| Address | Dist | Beds/Ba | Sqft | Sold | Price | $/sf | Match |
|---|---|---|---|---|---|---|---|
| 45 Lafayette St | 0.06mi | 3/1.0 (+1) | 1,038 (+3%) | 1mo | $375,000 | $361 | 86 |
| 60 Fairview St | 0.17mi | 1/1.0 (-1) | 960 (-5%) | 2mo | $370,000 | $385 | 78 |
| 64 Warren St | 0.11mi | 2/2.0 | 1,062 (+5%) | 15mo | $375,000 | $353 | 69 |
| 27 Spruce St | 0.37mi | 3/1.0 (+1) | 1,080 (+7%) | 1mo | $375,000 | $347 | 65 |
| 56 Fairview St | 0.17mi | 3/1.5 (+1) | 1,117 (+11%) | 8mo | $315,000 | $282 | 61 |
| 10 Carver St | 0.54mi | 3/1.0 (+1) | 988 (-2%) | 19mo | $290,000 | $294 | 51 |
| 73 Webster St | 0.62mi | 3/1.0 (+1) | 936 (-7%) | 4mo | $289,000 | $309 | 51 |
| 83 Webster St | 0.64mi | 3/1.5 (+1) | 1,008 (0%) | 15mo | $277,000 | $275 | 50 |
| 33 S Main St | 0.68mi | 3/1.0 (+1) | 960 (-5%) | 7mo | $329,000 | $343 | 50 |
| 74 Morrill St | 0.67mi | 1/1.0 (-1) | 1,063 (+6%) | 7mo | $250,000 | $235 | 48 |
| 48 Joliet St | 0.32mi | 3/1.5 (+1) | 1,150 (+14%) | 10mo | $320,000 | $278 | 46 |
| 19 Overland St | 0.60mi | 3/2.0 (+1) | 1,159 (+15%) | 11mo | $355,000 | $306 | 29 |
Match score weights: distance 35% · size 25% · config 20% · recency 20%. Top-matched comps best support the ARV.
Projected returns pro-forma
-3.0% appreciation · 8.0% rent growth · sell at horizon
- IRR
- -11.6%
- Equity multiple
- 0.56×
- Total profit
- $-24,711
- Equity at exit
- $29,672
- IRR
- 4.1%
- Equity multiple
- 1.37×
- Total profit
- $20,369
- Equity at exit
- $17,206
Cash invested: $55,720 (down + closing). Projections, not guarantees.
Landlord ↔ Tenant lean methodology
- Overall (STATE)
- 56 Moderately Landlord-Leaning
- State New Hampshire
- 56 Moderately Landlord-Leaning · D+1
- County
- — inherits STATE
- City
- — inherits STATE
ZIP-level market 03246
- Home prices YoY
- -19.8%
- Rents YoY
- 21.6%
- Active inventory
- 188
- Price-to-rent
- 9.0×
Monthly cashflow live
- Estimated rent
- $1,849 high interval (Pro) →
- Mortgage (P&I)
- −$1,044
- Tax from tax record
- −$371 /mo · $4,455/yr
- Insurance
- −$83
- HOA
- −$0
- Vacancy / Maint / Mgmt
- −$388
- Net cashflow
- $-37
Break-even live
Sensitivity live
| Price | -10% $76 | -5% $20 | +0% $-37 | +5% $-93 | +10% $-149 |
|---|---|---|---|---|---|
| Rent | -10% $-183 | -5% $-110 | +0% $-37 | +5% $36 | +10% $109 |
| Rate | -1.0pp $63 | -0.5pp $14 | base $-37 | +0.5pp $-88 | +1.0pp $-141 |
UW: 25.0% down · 7.5% · 30yr · 1.5% tax · 5.0% vac · 8.0% maint · 8.0% mgmt
Financing live
Cash to close
- Down payment
- $49,750
- Closing costs
- $5,970
- Reserves months
- —
- Total cash needed
- —
Loan-product check · same deal, 3 products live
Conventional
25% down · 7.5% · 30yr
- Down + closing
- —
- Monthly P&I
- —
- Monthly cashflow
- —
- DSCR
- —
- Eligible?
- —
Personal DTI + credit; lowest rate.
DSCR
20% down · 8.5% · 30yr
- Down + closing
- —
- Monthly P&I
- —
- Monthly cashflow
- —
- DSCR
- —
- Eligible?
- —
No personal income docs; deal must DSCR.
Hard money
10% down · 12.0% · 12mo
- Down + closing
- —
- Monthly P&I
- —
- Monthly cashflow
- —
- DSCR
- —
- Eligible?
- —
Short-term bridge; refi at stabilization.
Rent comps 6 comps
| Address | Beds | Baths | Sqft | Rent | $/sqft | DOM | Units | Dist |
|---|---|---|---|---|---|---|---|---|
| 43 Avery St Unit 2 Laconia, NH | 2.0 | 1.0 | 1100 | $2,000 | $1.82 | 45d | 1 | 0.33mi |
| 24 Baldwin St Unit 3 Laconia, NH | 2.0 | 1.0 | 780 | $1,650 | $2.12 | 45d | 1 | 0.40mi |
| 53 Messer St Unit C Laconia, NH | 1.0 | 1.0 | 700 | $1,750 | $2.50 | 45d | 1 | 0.68mi |
| 386 Union Ave Unit 3 Laconia, NH | 3.0 | 2.0 | 1288 | $2,500 | $1.94 | 45d | 1 | 0.79mi |
| 10 Dyer St Laconia, NH | 2.0 | 1.0 | 700 | $1,795 | $2.56 | 45d | 1 | 0.96mi |
| 23 Chester Ct Laconia, NH | 3.0 | 1.0 | 1013 | $1,900 | $1.88 | 45d | 1 | 0.97mi |
Listing history 3 events
-
2026-06-16status $199,000 Pending 1 DOM
-
2026-06-16remarks 699-char remark
-
2026-06-16$199,000 Active 1 DOM
ⓘ Source: listings_history table (triggers on properties + properties_extension) + one-shot
backfill from property_details.listing_events for pre-trigger history.
Tax reassessment forecast NH · Partial reset (capped growth)
- Current annual tax
- $4,455 · $371/mo
- Projected year-2 tax
- $4,455 · $371/mo
- Expected delta
- $0/yr ($0/mo · 0.0%)
ⓘ Screening estimate from a state-policy table — verify with the county assessor before closing.
Climate risk First Street
- Flood 4/10 Moderate FEMA zone X · 22% chance over 30 yrs
- Wildfire 1/10 Low
- Heat 3/10 Moderate 7 d/yr ≥91°F today · 16 d/yr by 30 yrs out
- Wind 4/10 Moderate 8% chance of damaging wind over 30 yrs
- Air quality 2/10 Low 1 unhealthy d/yr today · 1 by 30 yrs out
Nearby sold comps map
Loading sold comps map…
Walkable amenities ~0.75 mi
Loading nearby amenities…
Taxation est. · year 1
- Rental income
- $22,192
- − Mortgage interest
- −$11,147
- − Property taxes
- −$4,455
- − Insurance
- −$995
- − Repairs & maintenance
- −$1,775
- − Management
- −$1,775
- − Depreciation
- −$5,789
- Taxable loss
- −$3,745
- Est. tax savings @ 24.0%
- +$899
- After-tax cash flow
- $458/yr
For passive investors: Depreciation is non-cash, so a rental often shows a tax loss while cash-flowing — sheltering income. Rental losses are passive: they offset passive income freely, and up to $25,000/yr can offset ordinary (W-2) income if you actively participate and your MAGI is under $100k (phasing out to $0 by $150k); unused losses carry forward. On sale, claimed depreciation is recaptured at up to 25%, and gains may owe capital-gains tax (a 1031 exchange can defer both). Figures are a year-1 estimate at your 24.0% rate — not tax advice; consult a CPA.
Schools (NCES district)
- District
- Laconia School District
- NCES district ID
- 3304140
- Math proficiency
- 24% ▼ -8.00%
- Reading proficiency
- 31% ▼ -7.00%
- Median HH income
- $49,155
- Composite
- 24.03/100
- National rank
- #7770
- State rank
- #89 of 98 in NH
Livability — Laconia
- Score
- 79/100
- State rank
- #20
- US rank
- #2314
Category grades
Schools grade is shown separately in the Schools card above.
Census & demographics
- Census place
- Laconia, NH
- County
- Belknap County · 17,103 people
- City population
- 17,103
- Metro
- Laconia, NH
- Population (ZIP)
- 17,103
- Household income
- $73,241
- Rent vs Own
- Severe rent burden
- 722.0
Population outlook (Belknap County) Hauer SSP2
- Today (2025)
- 60,702 people
- By 2030
- 60,353 · -0.6%
- By 2040
- 58,264 · -4.0%
- By 2050
- 54,533 · -10.2%
- By 2075
- 45,622 · -24.8%
- By 2100
- 33,772 · -44.4%
Race, ethnicity, and origin ACS 2023
- Neighborhood character
- Predominantly White (90%)
- Race & ethnicity
- White 90% Two or more races 4% Hispanic / Latino 3% Asian 1%
- Common ancestry
- Lithuanian 17% Slovak 2% Romanian 2%
- Foreign-born
- 3% · Canada
- Languages at home
- 95% English-only · Spanish 2% French/Haitian/Cajun 2% Other Indo-European 1%
Political lean MEDSL · Belknap
- 2024 margin
- R (+13.1) · D 43.1% · R 56.1%
- 2008→2024 swing
- -14.2pp toward R · 2008: 1.2pp · 2024: -13.1pp
- All cycles
- 2024: R+13.1 2020: R+10.4 2016: R+16.8 2012: R+5.0 2008: D+1.2
Not yet ingested
- Civics
- —
Market trends
- HPI YoY
- ▼ -96.22%
- Current HPI
- 389.8118
- Rent YoY
- ▲ 21.59%
- Metro
- Laconia, NH
- State GDP YoY
- —
- F500 in state
- 0
Price history
+149.1% since first listed6 events — show timeline
- 2026-06-15 Listed $199,000 PrimeMLS
- 2009-11-09 Sold (MLS) $170,000 PrimeMLS
- 2009-06-25 Listed $174,900 PrimeMLS
- 1997-10-31 Sold (Public Records) $78,500 Public Records
- 1997-10-31 Sold (MLS) $78,500 PrimeMLS
- 1997-09-25 Listed $79,900 PrimeMLS
Property tax history
+2.1%/yrLatest (2025): $4,455 · +3.9% YoY. Source: county tax records.
Cash-flow waterfall
monthlySold comps — $/sqft
last 12 mo · ≤1 miLoading sold comps…