 Duplex
11075 Dell Ave · Forestville, CA
Flood risk 9/10 · Severe
- FEMA flood zone
- X (unshaded)
- Chance of flooding over 30 yrs
- 0.99%
- Est. flood insurance / yr
- $507 – $1,088
Fire risk 5/10 · Moderate
- Est. fire insurance / yr
- $659 – $1,223
Heat risk 3/10 · Minor
- Hot days now (above 89°F)
- 7 days/yr
- Hot days in 30 yrs
- 18 days/yr
Wind risk 1/10 · Minimal
- Chance of severe wind over 30 yrs
- —
Air-quality risk 7/10 · Major
- Unhealthy air days now
- 12 days/yr
- Unhealthy air days in 30 yrs
- 13 days/yr
Risk factors via First Street. Map © Google.
Why this score? — see what drove the F grade
The composite is a weighted blend of 9 inputs, each scored 0–100. Each bar is that input's sub-score; the figure is the points it added to the 100-point composite (weight × sub-score).
- Cash flow +10.8/30.0
- ARV discount +7.5/15.0
- Schools +3.4/10.0
- DSCR +3.1/10.0
- Livability +2.9/5.0
- Rent growth +2.5/5.0
- Condition / age +2.5/5.0
- 1% rule +2.3/10.0
- Appreciation +0.0/10.0
$499,000
🖨 Deal sheet (PDF) 📄 Offer letter ✓ Due diligence
Multi-family units
County records classify this as Multi-Family (2-4 Unit). Listing-text estimate: 2 units. confirmed
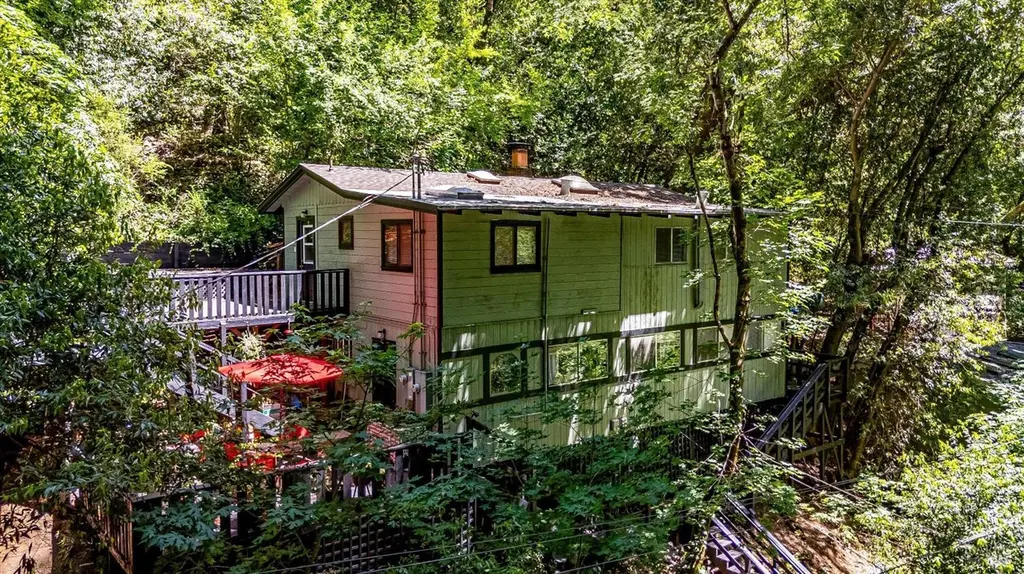
Listing remarks
Spacious duplex retreat near the Russian River! The vacant upper owner's unit features 3 bedrooms and 1 bath, with soaring open-beam ceilings, a light-filled great room concept, and expansive decks surrounded by mature trees for a peaceful indoor-outdoor lifestyle. The lower 1-bedroom, 1-bath unit is currently tenant-occupied and generates $1,460.70 per month in rental income. Ideally located approximately 0.30 miles from the Forest Hills-Hacienda Bridge and close to Mother's Beach, offering easy access to river recreation, kayaking, swimming, and scenic wine country destinations. Conveniently located near popular Russian River wineries, dining, and outdoor activities.
Key facts
- Expansive decks
- Great room concept
- Duplex retreat
Tags
Property features AI
Finance
- HOA & community: No association
Exterior
- Parking: No garage; 2 parking spaces (unassigned)
- Security: Carbon monoxide detector; Smoke detector; Double-strapped water heater
- Utilities: Propane tank (leased); Septic system
- Home design: Residential property with 2 houses on the lot; Updated/remodeled condition; Two stories; Second unit / ADU with private entry
- Construction: Composition roof
- Exterior features: Uncovered deck; Secluded lot
Interior
- Kitchen: Quartz counters; Breakfast area; Kitchen/family room combo; Dishwasher; Free-standing gas range; Free-standing refrigerator
- Bedrooms: 4 bedrooms; Primary bedroom includes a closet; Main and lower levels both include bedrooms
- Flooring: Wood flooring
- Bathrooms: 2 total bathrooms, both full; Quartz counters in bathrooms; Tub with shower over in bathrooms
- Heating & cooling: Wall furnace heating; Fireplace heating; No central cooling
- Interior features: Cathedral ceiling; Open beam ceiling; Brick fireplace in the living room; 1 fireplace total; 9 total rooms; Great room; Dining/Living combo; Breakfast nook
- Laundry & utility: Washer and dryer included; Laundry located inside
Neighborhood map
What this means for you Summary
Snapshot
- This is a 2 × 2-bed/1.0-bath units multifamily listed at $499k.
Deal economics
- At list price, monthly cash flow is $-299 ($-4k/yr) — negative. Per door: $-150/mo.
- To cash-flow at today's rent, offer at most $446k (10.6% below list).
- To meet the 1% rule (rent ≥ 1% of price), the offer needs to be $362k (27.4% below list).
- Recommended offer: $362k (27.4% below list) — sets the bar for 1% rule.
- Cap rate 5.7% vs local median 1.6% in Forestville — top-decile yield for the area; either an underpriced asset or a hidden risk that comps aren't pricing in. Stress-test before assuming the spread holds.
Location & tenants
- Location reads 58/100 on livability (#671 in CA) — a working-class tenant base; expect higher turnover. Strengths: crime A+, employment A+; Watch: health & safety D, amenities F, commute F.
- Forestville Union Elementary (rural): math 35% / reading 35% proficiency, ranked #854 of 1,400 in CA (top 61%) — families likely to look elsewhere, expect single-tenant / working-renter base with shorter leases.
- Zoned schools: Forestville Elementary (54 students, 30% FRL); Forestville Academy (170 students, 40% FRL, charter) — zoned schools at 35% FRL track the district average.
- Market conditions: 39 active listings in the ZIP; 1 comparable units currently listed for rent nearby; 1,039 units permitted in Sonoma County in 2024 (185 in 5+ unit buildings).
Forward outlook
- Local home prices are declining (-3.0%/yr); year-one equity from $3k of loan paydown is wiped out by about $15k of value loss. Plan a longer hold.
- Sonoma County population projected at +8% by 2050 — modest demand growth; plan on rents tracking national, not racing it.
Negotiation context
- It's been on market 25 days — a 2% lower offer ($492k) is reasonable based on typical stale-listing flexibility.
- Current owner paid $309k; list at $499k implies a 61% gain — meaningful room to come down on a strong offer.
Risks & watch-outs
- Watch-outs: flood insurance adds $66/mo; built in 1953 — expect roof / HVAC / electrical / plumbing capex.
- Climate carrying-cost: severe flood risk; moderate wildfire risk — expect insurance premiums to compound above CPI over the hold.
Questions for the listing agent
- What do current leases actually rent for vs. the listed asking? Can we see a recent rent roll and the last 12 months of T-12 income?
- Can we see the unit-by-unit rent roll, current vacancy, and any below-market leases? What's the average tenancy length?
- What capital expenditures (roof, boiler, parking lot, exteriors) have been made in the last 5 years, and what's planned in the next 2?
- Built in 1953 — when were the roof, HVAC, electrical panel, plumbing, and water heater last replaced?
- What's the actual annual flood-insurance premium (NFIP or private), and is the property in a SFHA with mandatory coverage?
- Is there a deadline driving the sale (1031 exchange, divorce, estate, relocation)? That informs how much negotiation room exists.
- The area grade is low — what's the realistic commute time and amenity access for the typical tenant pool here? Any planned neighborhood developments (good or bad) we should know about?
- What's the average days-on-market for RENTAL listings here right now (not sales)? A rising rental-DOM trend means longer vacancies and softer asking-rent achievability than the comps imply.
- What's the recent tenant-quality profile in this submarket — average credit score on applications, eviction rate, late-payment / NSF rate, and stable-employment percentage? A property-management company in the area should have these aggregated.
- How much new apartment / multifamily construction is in the pipeline within 1–3 miles? Heavy new supply (>2% of stock underway) typically softens rents 12–24 months out; light construction supports rent growth.
Investment metrics
- 1% rule
- 0.73% ✗
- Cap rate
- 5.73%
- Cash-on-cash
- -2.00%
- DSCR
- 0.91
- GRM
- 11.5
CMA / ARV
No comps found within radius.
Projected returns pro-forma
-3.0% appreciation · 3.0% rent growth · sell at horizon
- IRR
- -20.6%
- Equity multiple
- 0.28×
- Total profit
- $-100,029
- Equity at exit
- $74,403
- IRR
- -13.9%
- Equity multiple
- 0.20×
- Total profit
- $-112,124
- Equity at exit
- $43,144
Cash invested: $139,720 (down + closing). Projections, not guarantees.
Landlord ↔ Tenant lean methodology
- Overall (STATE)
- 18 Strongly Tenant-Friendly
- State California
- 18 Strongly Tenant-Friendly · D+13
- County
- — inherits STATE
- City
- — inherits STATE
ZIP-level market 95436
- Active inventory
- 39
- Price-to-rent
- 22.9×
Monthly cashflow live
- Estimated rent
- $3,624 medium interval (Pro) →
- Mortgage (P&I)
- −$2,617
- Tax from tax record
- −$271 /mo · $3,250/yr
- Insurance
- −$208
- Flood insurance flood zone
- −$66 /mo · $798/yr
- HOA
- −$0
- Vacancy / Maint / Mgmt
- −$761
- Net cashflow
- $-299
Break-even live
Sensitivity live
| Price | -10% $-17 | -5% $-158 | +0% $-299 | +5% $-440 | +10% $-582 |
|---|---|---|---|---|---|
| Rent | -10% $-585 | -5% $-442 | +0% $-299 | +5% $-156 | +10% $-13 |
| Rate | -1.0pp $-48 | -0.5pp $-172 | base $-299 | +0.5pp $-428 | +1.0pp $-560 |
2-unit breakdown (identical units grouped — click to expand)
| Units | Beds | Baths | Est. rent |
|---|---|---|---|
| 2× units | 2 | 1 | $3,624 |
| #1 | 2 | 1 | $1,812 |
| #2 | 2 | 1 | $1,812 |
| Total (2 units) | $3,624 | ||
UW: 25.0% down · 7.5% · 30yr · 1.5% tax · 5.0% vac · 8.0% maint · 8.0% mgmt
Financing live
Cash to close
- Down payment
- $124,750
- Closing costs
- $14,970
- Reserves months
- —
- Total cash needed
- —
Loan-product check · same deal, 3 products live
Conventional
25% down · 7.5% · 30yr
- Down + closing
- —
- Monthly P&I
- —
- Monthly cashflow
- —
- DSCR
- —
- Eligible?
- —
Personal DTI + credit; lowest rate.
DSCR
20% down · 8.5% · 30yr
- Down + closing
- —
- Monthly P&I
- —
- Monthly cashflow
- —
- DSCR
- —
- Eligible?
- —
No personal income docs; deal must DSCR.
Hard money
10% down · 12.0% · 12mo
- Down + closing
- —
- Monthly P&I
- —
- Monthly cashflow
- —
- DSCR
- —
- Eligible?
- —
Short-term bridge; refi at stabilization.
Rent comps 1 comps
| Address | Beds | Baths | Sqft | Rent | $/sqft | DOM | Units | Dist |
|---|---|---|---|---|---|---|---|---|
| 11075 Dell Ave Unit 1 Forestville, CA | 3.0 | 1.0 | 900 | $2,995 | $3.33 | 15d | 1 | 0.03mi |
Listing history 21 events
-
2026-06-21days on market $499,000 Active 25 DOM
-
2026-06-18days on market $499,000 Active 22 DOM
-
2026-06-17days on market $499,000 Active 21 DOM
-
2026-06-16days on market $499,000 Active 20 DOM
-
2026-06-15days on market $499,000 Active 19 DOM
-
2026-06-14days on market $499,000 Active 17 DOM
-
2026-06-13days on market $499,000 Active 16 DOM
-
2026-06-10days on market $499,000 Active 14 DOM
-
2026-06-09days on market $499,000 Active 13 DOM
-
2026-06-08days on market $499,000 Active 12 DOM
-
2026-06-07days on market $499,000 Active 11 DOM
-
2026-06-03days on market $499,000 Active 7 DOM
-
2026-06-02days on market $499,000 Active 6 DOM
-
2026-06-01days on market $499,000 Active 5 DOM
-
2026-05-31days on market $499,000 Active 4 DOM
-
2026-05-30days on market $499,000 Active 3 DOM
-
2026-05-27$499,000 Active
-
2003-08-06soldstatus $309,000
-
1997-09-22soldstatus $132,000
-
1996-12-18soldstatus $129,000
-
1990-02-07soldstatus $93,000
ⓘ Source: listings_history table (triggers on properties + properties_extension) + one-shot
backfill from property_details.listing_events for pre-trigger history.
Tax reassessment forecast CA · Resets to sale price
- Current annual tax
- $3,250 · $271/mo
- Projected year-2 tax
- $3,792 · $316/mo
- Expected delta
- +$542/yr (+$45/mo · 16.7%)
ⓘ Screening estimate from a state-policy table — verify with the county assessor before closing.
Climate risk First Street
- Flood 9/10 Extreme FEMA zone X (unshaded) · 99% chance over 30 yrs
- Wildfire 5/10 Major
- Heat 3/10 Moderate 7 d/yr ≥89°F today · 18 d/yr by 30 yrs out
- Wind 1/10 Low
- Air quality 7/10 Severe 12 unhealthy d/yr today · 13 by 30 yrs out
Nearby sold comps map
Loading sold comps map…
Walkable amenities ~0.75 mi
Loading nearby amenities…
Taxation est. · year 1
- Rental income
- $43,488
- − Mortgage interest
- −$27,952
- − Property taxes
- −$3,250
- − Insurance
- −$3,292
- − Repairs & maintenance
- −$3,479
- − Management
- −$3,479
- − Depreciation
- −$14,516
- Taxable loss
- −$12,481
- Est. tax savings @ 24.0%
- +$2,995
- After-tax cash flow
- $-593/yr
For passive investors: Depreciation is non-cash, so a rental often shows a tax loss while cash-flowing — sheltering income. Rental losses are passive: they offset passive income freely, and up to $25,000/yr can offset ordinary (W-2) income if you actively participate and your MAGI is under $100k (phasing out to $0 by $150k); unused losses carry forward. On sale, claimed depreciation is recaptured at up to 25%, and gains may owe capital-gains tax (a 1031 exchange can defer both). Figures are a year-1 estimate at your 24.0% rate — not tax advice; consult a CPA.
Schools (NCES district)
- District
- Forestville Union Elementary
- NCES district ID
- 0614010
- Math proficiency
- 35% ▲ 10.00%
- Reading proficiency
- 35% ▼ -5.00%
- Median HH income
- $58,534
- Composite
- 33.79/100
- National rank
- #10392
- State rank
- #854 of 1400 in CA
Livability — Forestville
- Score
- 58/100
- State rank
- #671
- US rank
- #20686
Category grades
Schools grade is shown separately in the Schools card above.
Census & demographics
- City population
- 5,999
- Population (ZIP)
- 5,999
Population outlook (Sonoma County) Hauer SSP2
- Today (2025)
- 539,935 people
- By 2030
- 554,870 · +2.8%
- By 2040
- 573,262 · +6.2%
- By 2050
- 580,715 · +7.6%
- By 2075
- 579,229 · +7.3%
- By 2100
- 547,835 · +1.5%
Race, ethnicity, and origin ACS 2023
- Neighborhood character
- Diverse neighborhood (Simpson 0.56)
- Race & ethnicity
- White 65% Two or more races 19% Hispanic / Latino 11% Black 3% Asian 2% Pacific Islander 1%
- Hispanic origin (detail)
- Mexican 8%
- Common ancestry
- Italian 10% Lithuanian 5% Scotch-Irish 4%
- Foreign-born
- 9% · Canada
- Languages at home
- 89% English-only · Spanish 6% Other Indo-European 2% German/W. Germanic 1%
Political lean MEDSL · Sonoma
- 2024 margin
- Solid D (+46.2) · D 71.4% · R 25.2% · Other 3.3%
- 2008→2024 swing
- -3.4pp toward R · 2008: 49.6pp · 2024: 46.2pp
- All cycles
- 2024: D+46.2 2020: D+51.5 2016: D+47.9 2012: D+44.9 2008: D+49.6
Not yet ingested
- Civics
- —
Market trends
- HPI YoY
- ▼ -510.63%
- Current HPI
- 258.3391
- Rent YoY
- —
- Metro
- —
- State GDP YoY
- ▲ 3.21%
- F500 in state
- 116
Industry mix (Fortune 500 HQ in CA)
| Industry | F500 HQs | Revenue |
|---|---|---|
| Technology | 27 | $1,492B |
|
||
| Financial Services | 3 | $174B |
|
||
| Retail | 3 | $44B |
|
||
| Insurance | 3 | $26B |
|
||
| Media / Entertainment | 2 | $115B |
|
||
| Pharmaceuticals / Biotech | 2 | $62B |
|
||
Price history
+436.6% since first listed5 events — show timeline
- 2026-05-27 Listed $499,000 BAREIS
- 2003-08-06 Sold (Public Records) $309,000 Public Records
- 1997-09-22 Sold (Public Records) $132,000 Public Records
- 1996-12-18 Sold (Public Records) $129,000 Public Records
- 1990-02-07 Sold (Public Records) $93,000 Public Records
Property tax history
-1.9%/yrLatest (2025): $3,250 · +0.6% YoY. Source: county tax records.
Cash-flow waterfall
monthlySold comps — $/sqft
last 12 mo · ≤1 miLoading sold comps…