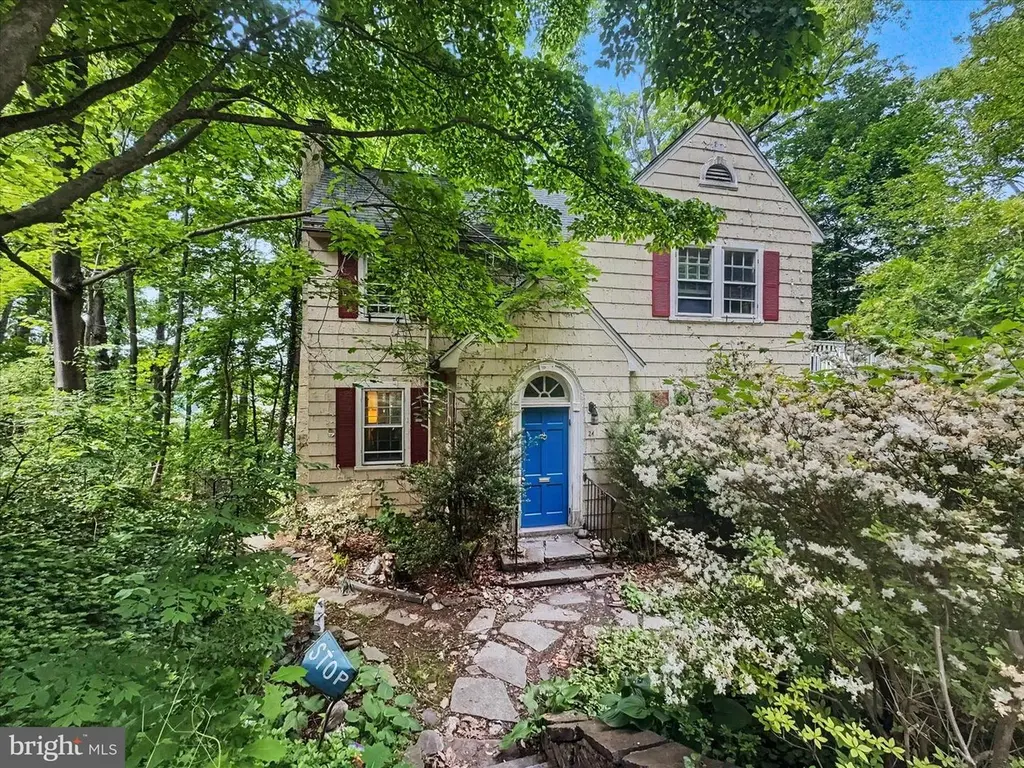
24 Merrymount Rd · Baltimore, MD
Flood risk 1/10 · Minimal
- FEMA flood zone
- X (unshaded)
- Chance of flooding over 30 yrs
- 0.0%
- Est. flood insurance / yr
- $473 – $860
Fire risk 3/10 · Minor
- Est. fire insurance / yr
- $755 – $1,403
Heat risk 6/10 · Moderate
- Hot days now (above 103°F)
- 6 days/yr
- Hot days in 30 yrs
- 13 days/yr
Wind risk 6/10 · Moderate
- Chance of severe wind over 30 yrs
- 27.0%
Air-quality risk 4/10 · Minor
- Unhealthy air days now
- 3 days/yr
- Unhealthy air days in 30 yrs
- 6 days/yr
Risk factors via First Street. Map © Google.
Why this score? — see what drove the D- grade
The composite is a weighted blend of 9 inputs, each scored 0–100. Each bar is that input's sub-score; the figure is the points it added to the 100-point composite (weight × sub-score).
- Cash flow +10.4/30.0
- ARV discount +7.5/15.0
- 1% rule +5.6/10.0
- Livability +3.8/5.0
- DSCR +3.0/10.0
- Condition / age +2.5/5.0
- Rent growth +1.6/5.0
- Schools +1.0/10.0
- Appreciation +0.0/10.0
$250,000
🖨 Deal sheet 📄 Offer letter ✓ Due diligence
Listing remarks
Prime Investment Opportunity: Historic Charm in Roland Park Cash Buyers and Visionary Investors: This is the opportunity you’ve been waiting for. Situated in the prestigious Roland Park neighborhood, this 1924 detached cottage offers the perfect bones for a custom renovation. While the home requires interior rehabilitation and exterior paint, the heavy lifting on the exterior envelope has already begun. You can move forward with confidence knowing the main roof was replaced in 2022 and the flat roof in 2025. The Property Highlights Historic Character: Original architectural details, including a cozy wood-burning fireplace and classic 1920s proportions. More than 1,897 finished square
Key facts
- Mature surroundings
- Rear deck
- Fireplace
Tags
Property features AI
Finance
- Other: Fee simple ownership; Below-grade unfinished area noted (733); Above-grade finished area noted (assessor)
- HOA & community: HOA fee of $80 (frequency unknown)
Exterior
- Parking: On-street parking
- Utilities: Natural gas hot water; Public water; Public sewer
- Home design: Detached structure
- Construction: Shingle siding construction; Other type foundation; Built year recorded by assessor
- Exterior features: Shingle siding; Other above- and below-grade structures; Property located within city limits
Interior
- Bedrooms: Three bedrooms on the first upper level; One bedroom on the main level
- Bathrooms: Two full bathrooms (all upper levels); One half bathroom (main level)
- Interior features: One wood-burning fireplace; Finished upper levels; Finished below-grade area
Neighborhood map
What this means for you Summary
Snapshot
- This is a 4-bed/2.5-bath single-family listed at $250k.
Deal economics
- At list price, monthly cash flow is $-131 ($-2k/yr) — negative.
- To cash-flow at today's rent, offer at most $227k (9.3% below list).
- Meets the 1% rule at list price ($3k rent vs $250k).
- Recommended offer: $227k (9.3% below list) — sets the bar for cash-flow.
Location & tenants
- Location reads 76/100 on livability (#90 in MD, #3,396 nationally) — a middle-class / working-renter tenant base. Strengths: amenities A+, commute A+, housing A+; Watch: schools D, crime F.
- Baltimore City Public Schools (urban): math 7% / reading 16% proficiency, ranked #24 of 24 in MD (top 100%) — low school quality limits family demand, transient renter base, plan for 1-2y turnover; 79% free/reduced lunch — lower-income household profile, screen leases tightly.
- Market conditions: Rents falling (-3.5%/yr); 41 active listings in the ZIP; 8 comparable units currently listed for rent nearby; rentals at typical pace (median 18d on market — plan ~3-4 weeks tenant-placement turnaround); high-income renter base; 1,273 units permitted in Baltimore city in 2024 (1,104 in 5+ unit buildings).
Forward outlook
- Local home prices are declining (-3.0%/yr); year-one equity from $2k of loan paydown is wiped out by about $8k of value loss. Plan a longer hold.
- Baltimore County population projected to shrink 4% by 2050 — rents likely to lag national; underwrite the cash flow, not the appreciation.
Negotiation context
- It's been on market 17 days — a 2% lower offer ($246k) is reasonable based on typical stale-listing flexibility.
- 5 sale attempts since 26y ago with the ask held roughly flat each time — persistent listings suggest the price (not the market) is what's stuck; bring a comps-based counter.
Risks & watch-outs
- Watch-outs: property tax is 3.5% of price; built in 1924 — expect roof / HVAC / electrical / plumbing capex.
- Climate carrying-cost: major wind risk, 27% chance of damaging wind over 30y; extreme-heat days projected 6→13/yr by 2055 (HVAC capex compounding) — expect insurance premiums to compound above CPI over the hold.
Questions for the listing agent
- What do current leases actually rent for vs. the listed asking? Can we see a recent rent roll and the last 12 months of T-12 income?
- Built in 1924 — when were the roof, HVAC, electrical panel, plumbing, and water heater last replaced?
- Property tax is high relative to price — has the assessment been appealed recently, and will the sale trigger a re-assessment?
- What does the HOA fee cover, when was the last increase, and are there any pending special assessments or reserve-fund shortfalls?
- Is there a deadline driving the sale (1031 exchange, divorce, estate, relocation)? That informs how much negotiation room exists.
- Schools are D-rated, which usually means shorter tenancies and higher turnover. Who's the typical renter profile here, and what's been the actual vacancy rate?
- Crime grade is F in this area — have there been break-ins, vandalism, or insurance claims at this property in the last 3 years? What carrier currently insures it and at what premium?
- The area grade is low — what's the realistic commute time and amenity access for the typical tenant pool here? Any planned neighborhood developments (good or bad) we should know about?
- What's the average days-on-market for RENTAL listings here right now (not sales)? A rising rental-DOM trend means longer vacancies and softer asking-rent achievability than the comps imply.
- What's the recent tenant-quality profile in this submarket — average credit score on applications, eviction rate, late-payment / NSF rate, and stable-employment percentage? A property-management company in the area should have these aggregated.
- How much new for-sale + rental construction is in the pipeline within 1–3 miles? Heavy new supply typically softens prices + rents 12–24 months out; constrained supply supports both.
Investment metrics
- 1% rule
- 1.06% ✓
- Cap rate
- 5.66%
- Cash-on-cash
- -2.25%
- DSCR
- 0.90
- GRM
- 7.9
CMA / ARV
- ARV (median comp)
- $536,091
- List price
- $250,000
- Delta
- -6.92%
- Verdict
- FAIR
- Comps
- 20 within 1.0 mi
Show comp detail 4 sales within ~0.75 mi
| Address | Dist | Beds/Ba | Sqft | Sold | Price | $/sf | Match |
|---|---|---|---|---|---|---|---|
| 5509 Mattfeldt Ave | 0.20mi | 4/3.5 | 1,900 (+0%) | 17mo | $459,000 | $242 | 72 |
| 702 Gilmarys Rd | 0.64mi | 4/2.5 | 1,922 (+1%) | 13mo | $697,000 | $363 | 57 |
| 1122 Bellemore Rd | 0.56mi | 4/3.5 | 1,798 (-5%) | 11mo | $631,000 | $351 | 52 |
| 5937 Falls Rd | 0.68mi | 4/1.5 | 1,692 (-11%) | 14mo | $312,000 | $184 | 35 |
Match score weights: distance 35% · size 25% · config 20% · recency 20%. Top-matched comps best support the ARV.
Projected returns pro-forma
-3.0% appreciation · 0.0% rent growth · sell at horizon
- IRR
- -24.4%
- Equity multiple
- 0.20×
- Total profit
- $-56,293
- Equity at exit
- $37,276
- IRR
- -37.9%
- Equity multiple
- -0.26×
- Total profit
- $-88,394
- Equity at exit
- $21,615
Cash invested: $70,000 (down + closing). Projections, not guarantees.
Landlord ↔ Tenant lean methodology
- Overall (CITY)
- 12 Strongly Tenant-Friendly
- State Maryland
- 27 Tenant-Leaning · D+14
- County
- — inherits STATE
- City Baltimore
- 12 Strongly Tenant-Friendly · D+58
ZIP-level market 21210
- Rents YoY
- -3.5%
- Active inventory
- 41
- Price-to-rent
- 7.9×
Monthly cashflow live
- Estimated rent
- $2,650 high interval (Pro) →
- Mortgage (P&I)
- −$1,311
- Tax from tax record
- −$729 /mo · $8,752/yr
- Insurance
- −$104
- HOA
- −$80
- Vacancy / Maint / Mgmt
- −$556
- Net cashflow
- $-131
Break-even live
UW: 25.0% down · 7.5% · 30yr · 1.5% tax · 5.0% vac · 8.0% maint · 8.0% mgmt
Financing live
Cash to close
- Down payment
- $62,500
- Closing costs
- $7,500
- Reserves months
- —
- Total cash needed
- —
Loan-product check · same deal, 3 products live
Conventional
25% down · 7.5% · 30yr
- Down + closing
- —
- Monthly P&I
- —
- Monthly cashflow
- —
- DSCR
- —
- Eligible?
- —
Personal DTI + credit; lowest rate.
DSCR
20% down · 8.5% · 30yr
- Down + closing
- —
- Monthly P&I
- —
- Monthly cashflow
- —
- DSCR
- —
- Eligible?
- —
No personal income docs; deal must DSCR.
Hard money
10% down · 12.0% · 12mo
- Down + closing
- —
- Monthly P&I
- —
- Monthly cashflow
- —
- DSCR
- —
- Eligible?
- —
Short-term bridge; refi at stabilization.
Rent comps 8 comps
| Address | Beds | Baths | Sqft | Rent | $/sqft | DOM | Units | Dist |
|---|---|---|---|---|---|---|---|---|
| 1190 W Northern Pkwy Baltimore, MD | 1.0–3.0 | 1.0–2.0 | 1265 | $2,370 | $1.87 | 2d | 10 | 0.12mi |
| 2001 W Cold Spring Ln Baltimore, MD | 1.0–3.0 | 1.0–2.0 | 1154 | $3,505 | $3.04 | 2d | 31 | 1.21mi |
| 4429 Newport Ave Baltimore, MD | 3.0 | 2.0 | 1248 | $2,400 | $1.92 | 44d | 1 | 1.27mi |
| 100 E Melrose Ave Baltimore, MD | 2.0–3.0 | 2.0–2.5 | 1750 | $3,345 | $1.91 | 4d | 2 | 1.35mi |
| 4319 Medfield Ave Baltimore, MD | 3.0 | 2.5 | 1800 | $3,100 | $1.72 | 44d | 1 | 1.47mi |
| 4322 Roland Heights Ave Baltimore, MD | 3.0 | 3.0 | 1800 | $3,000 | $1.67 | 44d | 1 | 1.49mi |
| 4320 Roland Heights Ave Baltimore, MD | 3.0 | 2.5 | 1800 | $3,300 | $1.83 | 18d | 1 | 1.49mi |
| 6617 Bonnie Ridge Dr Baltimore, MD | 1.0–3.0 | 1.0–2.0 | 1060 | $2,497 | $2.36 | 2d | 70 | 1.49mi |
HOA detail
- Monthly dues
- $80 · $960/yr
Listing history 21 events
-
2026-06-18days on market $250,000 Active 17 DOM
-
2026-06-17days on market $250,000 Active 16 DOM
-
2026-06-16days on market $250,000 Active 15 DOM
-
2026-06-15days on market $250,000 Active 14 DOM
-
2026-06-13days on market $250,000 Active 12 DOM
-
2026-06-09days on market $250,000 Active 8 DOM
-
2026-06-08days on market $250,000 Active 7 DOM
-
2026-06-07days on market $250,000 Active 6 DOM
-
2026-06-04days on market $250,000 Active 3 DOM
-
2026-06-03days on market $250,000 Active 2 DOM
-
2026-06-02pricestatus $250,000 Active 1 DOM
-
2026-05-15$499,000 Active 1609-char remark
-
2005-11-17historical
-
2005-09-06
-
2005-09-06historical
-
2005-07-10
-
2000-04-24soldstatus $265,000
-
2000-04-21soldstatus $265,000
-
2000-02-25historical
-
2000-01-07$265,000
-
1989-09-25soldstatus $225,000
ⓘ Source: listings_history table (triggers on properties + properties_extension) + one-shot
backfill from property_details.listing_events for pre-trigger history.
Tax reassessment forecast MD · Partial reset (capped growth)
- Current annual tax
- $8,752 · $729/mo
- Projected year-2 tax
- $8,752 · $729/mo
- Expected delta
- $0/yr ($0/mo · 0.0%)
ⓘ Screening estimate from a state-policy table — verify with the county assessor before closing.
Climate risk First Street
- Flood 1/10 Low FEMA zone X (unshaded) · 0% chance over 30 yrs
- Wildfire 3/10 Moderate
- Heat 6/10 Major 6 d/yr ≥103°F today · 13 d/yr by 30 yrs out
- Wind 6/10 Major 27% chance of damaging wind over 30 yrs
- Air quality 4/10 Moderate 3 unhealthy d/yr today · 6 by 30 yrs out
Nearby sold comps map
Loading sold comps map…
Walkable amenities ~0.75 mi
Loading nearby amenities…
Taxation est. · year 1
- Rental income
- $31,795
- − Mortgage interest
- −$14,004
- − Property taxes
- −$8,752
- − Insurance
- −$1,250
- − Repairs & maintenance
- −$2,544
- − Management
- −$2,544
- − HOA
- −$960
- − Depreciation
- −$7,273
- Taxable loss
- −$5,530
- Est. tax savings @ 24.0%
- +$1,327
- After-tax cash flow
- $-248/yr
For passive investors: Depreciation is non-cash, so a rental often shows a tax loss while cash-flowing — sheltering income. Rental losses are passive: they offset passive income freely, and up to $25,000/yr can offset ordinary (W-2) income if you actively participate and your MAGI is under $100k (phasing out to $0 by $150k); unused losses carry forward. On sale, claimed depreciation is recaptured at up to 25%, and gains may owe capital-gains tax (a 1031 exchange can defer both). Figures are a year-1 estimate at your 24.0% rate — not tax advice; consult a CPA.
Schools (NCES district)
- District
- Baltimore City Public Schools
- NCES district ID
- 2400090
- Math proficiency
- 7% ▼ -9.00%
- Reading proficiency
- 16% ▼ -5.00%
- Median HH income
- $42,108
- Composite
- 10.08/100
- National rank
- #9805
- State rank
- #24 of 24 in MD
Livability — Baltimore
- Score
- 76/100
- State rank
- #90
- US rank
- #3396
Category grades
Schools grade is shown separately in the Schools card above.
Census & demographics
- Census place
- Baltimore, MD
- County
- Baltimore City · 558,601 people
- City population
- 588,727
- Metro
- Baltimore-Columbia-Towson, MD
- Population (ZIP)
- 14,134
- Household income
- $112,428
- Rent vs Own
- Severe rent burden
- 442.0
Population outlook (Baltimore County) Hauer SSP2
- Today (2025)
- 624,249 people
- By 2030
- 621,541 · -0.4%
- By 2040
- 609,756 · -2.3%
- By 2050
- 597,249 · -4.3%
- By 2075
- 552,236 · -11.5%
- By 2100
- 513,934 · -17.7%
Race, ethnicity, and origin ACS 2023
- Neighborhood character
- Diverse neighborhood (Simpson 0.61)
- Race & ethnicity
- White 58% Black 15% Hispanic / Latino 13% Asian 11% Two or more races 10%
- Hispanic origin (detail)
- Mexican 3% Puerto Rican 4%
- Common ancestry
- Romanian 3% Lithuanian 3% Slovak 2%
- Foreign-born
- 13% · China, Canada, South Korea
- Languages at home
- 82% English-only · Spanish 5% Chinese 4% Other Indo-European 3%
Political lean MEDSL · Baltimore
- 2024 margin
- Solid D (+73.0) · D 85.2% · R 12.2% · Other 2.6%
- 2008→2024 swing
- -2.5pp toward R · 2008: 75.5pp · 2024: 73.0pp
- All cycles
- 2024: D+73.0 2020: D+76.6 2016: D+74.6 2012: D+76.4 2008: D+75.5
Not yet ingested
- Civics
- —
Market trends
- HPI YoY
- ▼ -243.71%
- Current HPI
- 274.8752
- Rent YoY
- ▼ -3.55%
- Metro
- Baltimore-Columbia-Towson, MD
- State GDP YoY
- ▲ 2.97%
- F500 in state
- 12
Industry mix (Fortune 500 HQ in MD)
| Industry | F500 HQs | Revenue |
|---|---|---|
| Aerospace / Defense | 1 | $71B |
|
||
| Utilities | 1 | $25B |
|
||
| Hotels | 1 | $24B |
|
||
| Consumer Goods | 1 | $7B |
|
||
| Real Estate | 1 | $6B |
|
||
| Chemicals | 1 | $2B |
|
||
Price history
+11.1% since first listed12 events — show timeline
- 2026-06-01 Listed $250,000 BRIGHT MLS
- 2026-05-21 Listing Removed — BRIGHT MLS
- 2026-05-15 Listed $499,000 BRIGHT MLS
- 2005-11-17 Delisted — MRIS
- 2005-09-06 Delisted — MRIS
- 2005-09-06 Listed — MRIS
- 2005-07-10 Listed — MRIS
- 2000-04-24 Sold (Public Records) $265,000 Public Records
- 2000-04-21 Sold (MLS) $265,000 MRIS
- 2000-02-25 Delisted — MRIS
- 2000-01-07 Listed $265,000 MRIS
- 1989-09-25 Sold (Public Records) $225,000 Public Records
Property tax history
-1.8%/yrLatest (2025): $8,752 · +2.0% YoY. Source: county tax records.
Cash-flow waterfall
monthlySold comps — $/sqft
last 12 mo · ≤1 miLoading sold comps…