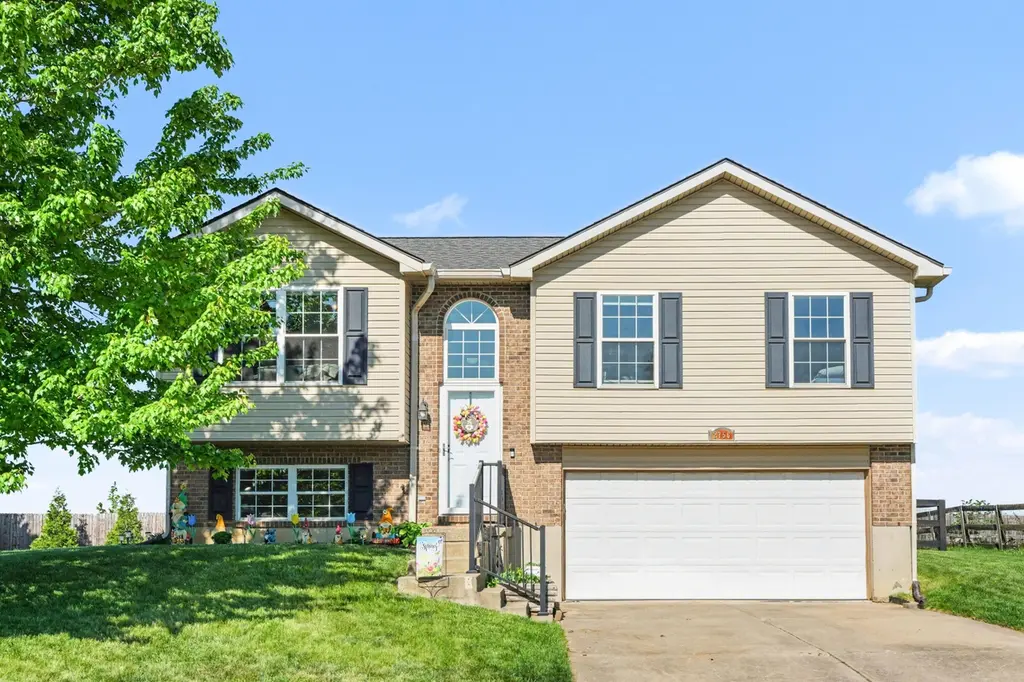
2756 Berwood Ln · Hebron, KY
Flood risk 1/10 · Minimal
- FEMA flood zone
- X (unshaded)
- Chance of flooding over 30 yrs
- 0.0%
- Est. flood insurance / yr
- $473 – $860
Fire risk 1/10 · Minimal
- Est. fire insurance / yr
- $839 – $1,559
Heat risk 4/10 · Minor
- Hot days now (above 101°F)
- 7 days/yr
- Hot days in 30 yrs
- 19 days/yr
Wind risk 2/10 · Minimal
- Chance of severe wind over 30 yrs
- 1.0%
Air-quality risk 2/10 · Minimal
- Unhealthy air days now
- 1 days/yr
- Unhealthy air days in 30 yrs
- 2 days/yr
Risk factors via First Street. Map © Google.
Why this score? — see what drove the F grade
The composite is a weighted blend of 9 inputs, each scored 0–100. Each bar is that input's sub-score; the figure is the points it added to the 100-point composite (weight × sub-score).
- Cash flow +8.9/30.0
- ARV discount +4.1/15.0
- Schools +4.1/10.0
- Livability +4.0/5.0
- DSCR +2.5/10.0
- Rent growth +2.5/5.0
- Condition / age +2.5/5.0
- 1% rule +1.9/10.0
- Appreciation +0.0/10.0
$290,000
🖨 Deal sheet (PDF) 📄 Offer letter ✓ Due diligence
Listing remarks MLS
Custom Built Home! Updated Thruout! Lg 4 Bdrm 3 Bath! Fenced Private Lot! New Carpet, Paint, Flooring & Appliances, Oversized Family Rm, W/FPL & Vaulted Ceilings, Oversized 2 Car Gar. Minutes to Interstate!
Key facts
- 0.23 acre lot
- 2 garage spots
- Built 1998
Neighborhood map
What this means for you Summary
Snapshot
- This is a 3-bed/2.5-bath single-family listed at $290k.
Deal economics
- At list price, monthly cash flow is $-234 ($-3k/yr) — negative.
- To cash-flow at today's rent, offer at most $249k (14.3% below list).
- To meet the 1% rule (rent ≥ 1% of price), the offer needs to be $200k (31.0% below list).
- Recommended offer: $200k (31.0% below list) — sets the bar for 1% rule.
- Cap rate 5.3% vs local median 3.8% in Hebron — top-decile yield for the area; either an underpriced asset or a hidden risk that comps aren't pricing in. Stress-test before assuming the spread holds.
Location & tenants
- Location reads 80/100 on livability (#69 in KY, #1,700 nationally) — a professional / high-income tenant draw. Strengths: crime A+, employment A+, cost of living A+; Watch: amenities F, commute F.
- Boone County (suburban): math 43% / reading 49% proficiency, ranked #12 of 165 in KY (top 7%) — families likely to look elsewhere, expect single-tenant / working-renter base with shorter leases.
- Zoned schools: Chester Goodridge Elementary School (math 39% / reading 51%, grade D-, #143 of 676 statewide, top 22%, 633 students, 45% FRL); Conner Middle School (math 50% / reading 62%, grade B-, #6 of 217 statewide, top 2%, 896 students, 35% FRL); Conner High School (math 47% / reading 51%, grade D, #15 of 254 statewide, top 6%, 1,443 students, 33% FRL).
- Market conditions: 202 active listings in the ZIP; 2 comparable units currently listed for rent nearby; high-income renter base; 1,430 units permitted in Boone County in 2024 (928 in 5+ unit buildings).
- This rent is only 17% of the median local income ($137k/yr) — well below the 30% rent-burden line; pricing power to push rent on renewal without tenant pushback.
Forward outlook
- Local home prices are declining (-3.0%/yr); year-one equity from $2k of loan paydown is wiped out by about $9k of value loss. Plan a longer hold.
- Boone County population projected at +24% by 2050 — long-run rental-demand tailwind backs the buy-and-hold thesis.
Negotiation context
- Only 1 days on market — expect competitive offers; lowballing is unlikely to land.
- 4 sale attempts since 27y ago with the ask held roughly flat each time — persistent listings suggest the price (not the market) is what's stuck; bring a comps-based counter.
- Current owner paid $133k; list at $290k implies a 118% gain — meaningful room to come down on a strong offer.
Questions for the listing agent
- What do current leases actually rent for vs. the listed asking? Can we see a recent rent roll and the last 12 months of T-12 income?
- Is there a deadline driving the sale (1031 exchange, divorce, estate, relocation)? That informs how much negotiation room exists.
- Schools are A-rated — typically a magnet for longer-tenancy family renters. What's the average tenant stay here, and is there a school-zone premium baked into asking?
- The area grade is low — what's the realistic commute time and amenity access for the typical tenant pool here? Any planned neighborhood developments (good or bad) we should know about?
- What's the average days-on-market for RENTAL listings here right now (not sales)? A rising rental-DOM trend means longer vacancies and softer asking-rent achievability than the comps imply.
- What's the recent tenant-quality profile in this submarket — average credit score on applications, eviction rate, late-payment / NSF rate, and stable-employment percentage? A property-management company in the area should have these aggregated.
- How much new for-sale + rental construction is in the pipeline within 1–3 miles? Heavy new supply typically softens prices + rents 12–24 months out; constrained supply supports both.
Investment metrics
- 1% rule
- 0.69% ✗
- Cap rate
- 5.32%
- Cash-on-cash
- -3.46%
- DSCR
- 0.85
- GRM
- 12.1
CMA / ARV
- ARV (on-the-fly)
- $269,876
- Comps found
- 12
Show comp detail 12 sales within ~0.75 mi
| Address | Dist | Beds/Ba | Sqft | Sold | Price | $/sf | Match |
|---|---|---|---|---|---|---|---|
| 2756 Berwood Ln | 0.00mi | 4/2.5 (+1) | 1,007 (0%) | 1mo | $300,000 | $298 | 94 |
| 2759 Ridgefield Dr | 0.15mi | 3/2.5 | 1,018 (+1%) | 7mo | $236,000 | $232 | 86 |
| 2780 Berwood Ln | 0.06mi | 3/2.5 | 1,026 (+2%) | 11mo | $285,000 | $278 | 85 |
| 2772 Berwood Ln | 0.04mi | 3/3.0 | 1,052 (+4%) | 8mo | $285,000 | $271 | 82 |
| 1774 Asbury Way | 0.13mi | 3/2.0 | 987 (-2%) | 11mo | $265,000 | $268 | 80 |
| 2620 Berwood Ln | 0.20mi | 3/2.5 | 1,028 (+2%) | 14mo | $245,000 | $238 | 76 |
| 1852 Princess Ct | 0.33mi | 3/2.0 | 1,023 (+2%) | 7mo | $272,000 | $266 | 74 |
| 2521 Hilliard Dr | 0.31mi | 3/2.0 | 1,023 (+2%) | 13mo | $275,000 | $269 | 70 |
| 1789 Nicole Lauren Ln | 0.60mi | 3/2.0 | 1,024 (+2%) | 1mo | $315,000 | $308 | 66 |
| 1769 Elijah Creek Rd | 0.18mi | 3/2.0 | 1,052 (+4%) | 20mo | $255,000 | $242 | 66 |
| 2509 Hilliard Dr | 0.29mi | 3/2.5 | 1,080 (+7%) | 14mo | $270,000 | $250 | 62 |
| 2867 Donjoy Dr | 0.36mi | 3/2.5 | 1,062 (+6%) | 21mo | $285,000 | $268 | 57 |
Match score weights: distance 35% · size 25% · config 20% · recency 20%. Top-matched comps best support the ARV.
Projected returns pro-forma
-3.0% appreciation · 3.0% rent growth · sell at horizon
- IRR
- -22.2%
- Equity multiple
- 0.24×
- Total profit
- $-62,011
- Equity at exit
- $43,240
- IRR
- -16.3%
- Equity multiple
- 0.09×
- Total profit
- $-73,576
- Equity at exit
- $25,074
Cash invested: $81,200 (down + closing). Projections, not guarantees.
Landlord ↔ Tenant lean methodology
- Overall (STATE)
- 83 Strongly Landlord-Friendly
- State Kentucky
- 83 Strongly Landlord-Friendly · R+16
- County
- — inherits STATE
- City
- — inherits STATE
ZIP-level market 41048
- Home prices YoY
- -31.1%
- Active inventory
- 202
- Price-to-rent
- 12.1×
Monthly cashflow live
- Estimated rent
- $2,001 medium interval (Pro) →
- Mortgage (P&I)
- −$1,521
- Tax from tax record
- −$173 /mo · $2,079/yr
- Insurance
- −$121
- HOA
- −$0
- Vacancy / Maint / Mgmt
- −$420
- Net cashflow
- $-234
Break-even live
Sensitivity live
| Price | -10% $-70 | -5% $-152 | +0% $-234 | +5% $-317 | +10% $-399 |
|---|---|---|---|---|---|
| Rent | -10% $-392 | -5% $-313 | +0% $-234 | +5% $-155 | +10% $-76 |
| Rate | -1.0pp $-88 | -0.5pp $-161 | base $-234 | +0.5pp $-310 | +1.0pp $-386 |
UW: 25.0% down · 7.5% · 30yr · 1.5% tax · 5.0% vac · 8.0% maint · 8.0% mgmt
Financing live
Cash to close
- Down payment
- $72,500
- Closing costs
- $8,700
- Reserves months
- —
- Total cash needed
- —
Loan-product check · same deal, 3 products live
Conventional
25% down · 7.5% · 30yr
- Down + closing
- —
- Monthly P&I
- —
- Monthly cashflow
- —
- DSCR
- —
- Eligible?
- —
Personal DTI + credit; lowest rate.
DSCR
20% down · 8.5% · 30yr
- Down + closing
- —
- Monthly P&I
- —
- Monthly cashflow
- —
- DSCR
- —
- Eligible?
- —
No personal income docs; deal must DSCR.
Hard money
10% down · 12.0% · 12mo
- Down + closing
- —
- Monthly P&I
- —
- Monthly cashflow
- —
- DSCR
- —
- Eligible?
- —
Short-term bridge; refi at stabilization.
Rent comps 2 comps
| Address | Beds | Baths | Sqft | Rent | $/sqft | DOM | Units | Dist |
|---|---|---|---|---|---|---|---|---|
| 3465 Hebron Station Dr Hebron, KY | 1.0–2.0 | 1.0–2.0 | 819 | $1,510 | $1.84 | 4d | 20 | 0.75mi |
| 2375 S Park Dr Hebron, KY | 2.0 | 1.0 | 821 | $1,267 | $1.54 | 3d | 3 | 1.31mi |
Listing history 11 events
-
2026-04-21status Pending
-
2026-04-20$290,000 Active
-
2010-03-19soldstatus $132,900
-
2010-03-11soldstatus $132,900 214-char remark
Show marketing remark (214 chars)
Custom Built Home! Updated Thruout! Lg 4 Bdrm 3 Bath! Fenced Private Lot! New Carpet, Paint, Flooring & Appliances, Oversized Family Rm, W/FPL & Vaulted Ceilings, Oversized 2 Car Gar. Minutes to Interstate!
-
2010-01-30$136,900 214-char remark
Show marketing remark (214 chars)
Custom Built Home! Updated Thruout! Lg 4 Bdrm 3 Bath! Fenced Private Lot! New Carpet, Paint, Flooring & Appliances, Oversized Family Rm, W/FPL & Vaulted Ceilings, Oversized 2 Car Gar. Minutes to Interstate!
-
2009-09-29soldstatus $90,000 234-char remark
Show marketing remark (234 chars)
Large bi level on corner lot. 2.5 baths. FR convert to 2 BD rm and garage has bedroom. Lender owned. BOA preapproval required with all financed deals. Free credit report and appraisal with boa financing. Proof of fund with cash offers
-
2009-09-11$86,900 234-char remark
Show marketing remark (234 chars)
Large bi level on corner lot. 2.5 baths. FR convert to 2 BD rm and garage has bedroom. Lender owned. BOA preapproval required with all financed deals. Free credit report and appraisal with boa financing. Proof of fund with cash offers
-
1999-12-28soldstatus $114,000
-
1999-12-15soldstatus $114,000
-
1999-08-18$114,700
-
1996-01-30soldstatus $98,115
ⓘ Source: listings_history table (triggers on properties + properties_extension) + one-shot
backfill from property_details.listing_events for pre-trigger history.
Tax reassessment forecast KY · Resets to sale price
- Current annual tax
- $2,079 · $173/mo
- Projected year-2 tax
- $2,494 · $208/mo
- Expected delta
- +$415/yr (+$35/mo · 20.0%)
ⓘ Screening estimate from a state-policy table — verify with the county assessor before closing.
Climate risk First Street
- Flood 1/10 Low FEMA zone X (unshaded) · 0% chance over 30 yrs
- Wildfire 1/10 Low
- Heat 4/10 Moderate 7 d/yr ≥101°F today · 19 d/yr by 30 yrs out
- Wind 2/10 Low 100% chance of damaging wind over 30 yrs
- Air quality 2/10 Low 1 unhealthy d/yr today · 2 by 30 yrs out
Nearby sold comps map
Loading sold comps map…
Walkable amenities ~0.75 mi
Loading nearby amenities…
Taxation est. · year 1
- Rental income
- $24,006
- − Mortgage interest
- −$16,245
- − Property taxes
- −$2,079
- − Insurance
- −$1,450
- − Repairs & maintenance
- −$1,921
- − Management
- −$1,921
- − Depreciation
- −$8,436
- Taxable loss
- −$8,044
- Est. tax savings @ 24.0%
- +$1,931
- After-tax cash flow
- $-883/yr
For passive investors: Depreciation is non-cash, so a rental often shows a tax loss while cash-flowing — sheltering income. Rental losses are passive: they offset passive income freely, and up to $25,000/yr can offset ordinary (W-2) income if you actively participate and your MAGI is under $100k (phasing out to $0 by $150k); unused losses carry forward. On sale, claimed depreciation is recaptured at up to 25%, and gains may owe capital-gains tax (a 1031 exchange can defer both). Figures are a year-1 estimate at your 24.0% rate — not tax advice; consult a CPA.
Schools (NCES district)
- District
- Boone County
- NCES district ID
- 2100510
- Math proficiency
- 43% ▼ -10.00%
- Reading proficiency
- 49% ▼ -12.00%
- Median HH income
- $68,096
- Composite
- 41.18/100
- National rank
- #3550
- State rank
- #12 of 165 in KY
Livability — Hebron
- Score
- 80/100
- State rank
- #69
- US rank
- #1700
Category grades
Schools grade is shown separately in the Schools card above.
Census & demographics
- Census place
- Hebron, KY
- County
- Boone County · 99,563 people
- City population
- 16,211
- Metro
- Cincinnati, OH-KY-IN
- Population (ZIP)
- 16,211
- Household income
- $137,398
- Rent vs Own
- Severe rent burden
- 169.0
Population outlook (Boone County) Hauer SSP2
- Today (2025)
- 144,066 people
- By 2030
- 152,005 · +5.5%
- By 2040
- 166,776 · +15.8%
- By 2050
- 178,974 · +24.2%
- By 2075
- 204,515 · +42.0%
- By 2100
- 215,306 · +49.4%
Race, ethnicity, and origin ACS 2023
- Neighborhood character
- Predominantly White (86%)
- Race & ethnicity
- White 86% Hispanic / Latino 7% Two or more races 6% Asian 2% Black 2%
- Hispanic origin (detail)
- Mexican 3% Puerto Rican 2%
- Common ancestry
- Slovak 2% Lithuanian 2% Scottish 2%
- Foreign-born
- 6% · Canada
- Languages at home
- 91% English-only · Spanish 5% Other Indo-European 1% German/W. Germanic 1%
Political lean MEDSL · Boone
- 2024 margin
- Solid R (+37.2) · D 30.6% · R 67.8% · Other 1.7%
- 2008→2024 swing
- -2.7pp toward R · 2008: -34.5pp · 2024: -37.2pp
- All cycles
- 2024: R+37.2 2020: R+35.7 2016: R+41.8 2012: R+38.7 2008: R+34.5
Not yet ingested
- Civics
- —
Market trends
- HPI YoY
- ▼ -85.70%
- Current HPI
- 189.8568
- Rent YoY
- —
- Metro
- Cincinnati, OH-KY-IN
- State GDP YoY
- ▲ 1.81%
- F500 in state
- 4
Industry mix (Fortune 500 HQ in KY)
| Industry | F500 HQs | Revenue |
|---|---|---|
| Healthcare | 1 | $118B |
|
||
| Food / Beverage | 1 | $7B |
|
||
Price history
+195.6% since first listed11 events — show timeline
- 2026-04-21 Pending — NKMLS
- 2026-04-20 Listed $290,000 NKMLS
- 2010-03-19 Sold (Public Records) $132,900 Public Records
- 2010-03-11 Sold (MLS) $132,900 NKMLS
- 2010-01-30 Listed $136,900 NKMLS
- 2009-09-29 Sold (MLS) $90,000 NKMLS
- 2009-09-11 Listed $86,900 NKMLS
- 1999-12-28 Sold (Public Records) $114,000 Public Records
- 1999-12-15 Sold (MLS) $114,000 NKMLS
- 1999-08-18 Listed $114,700 NKMLS
- 1996-01-30 Sold (Public Records) $98,115 Public Records
Property tax history
+3.6%/yrLatest (2025): $2,079 · +1.8% YoY. Source: county tax records.
Cash-flow waterfall
monthlySold comps — $/sqft
last 12 mo · ≤1 miLoading sold comps…