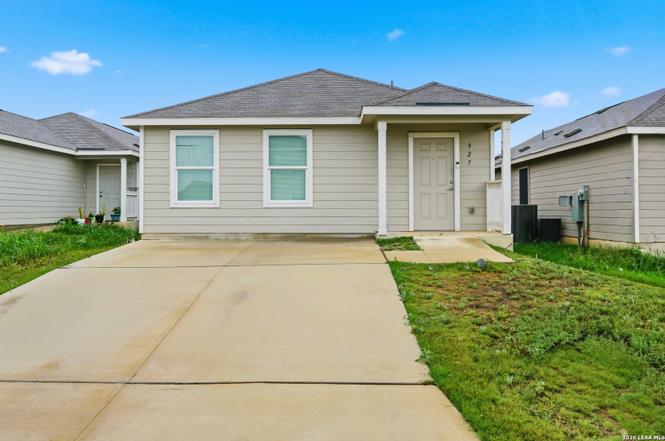
927 Magrum Way · San Antonio, TX
Flood risk No data
- FEMA flood zone
- —
- Chance of flooding over 30 yrs
- —
- Est. flood insurance / yr
- —
Fire risk No data
- Est. fire insurance / yr
- —
Heat risk No data
- Hot days now (above threshold)
- —
- Hot days in 30 yrs
- —
Wind risk No data
- Chance of severe wind over 30 yrs
- —
Air-quality risk No data
- Unhealthy air days now
- —
- Unhealthy air days in 30 yrs
- —
Risk factors via First Street. Map © Google.
Why this score? — see what drove the D+ grade
The composite is a weighted blend of 9 inputs, each scored 0–100. Each bar is that input's sub-score; the figure is the points it added to the 100-point composite (weight × sub-score).
- ARV discount +15.0/15.0
- Cash flow +10.6/30.0
- Appreciation +6.0/10.0
- 1% rule +4.6/10.0
- Livability +4.0/5.0
- Condition / age +4.0/5.0
- DSCR +3.1/10.0
- Schools +1.8/10.0
- Rent growth +0.7/5.0
$164,990
🖨 Deal sheet 📄 Offer letter ✓ Due diligence
Listing remarks MLS
This Cambria single-story home has a smart layout that offers convenience and seamless living. An open concept layout is situated among the modern kitchen, dining area and family room to allow for easy multitasking. Two secondary bedrooms are found by the front door, while the owner's suite is tucked into the back corner for maximum privacy with a full bathroom. Prices and features may vary and are subject to change. Photos are for illustrative purposes only. Estimated COE Nov 2023!
Key facts
- 4,791 sq ft lot
- Community pool
- Built 2023
Property features AI
Finance
- Financial info: Down payment resources available
- HOA & community: Mandatory HOA; Annual HOA fee ($350) with a $400 association transfer fee; Subdivision: Mission Del Lago
Exterior
- Parking: Garage/driveway parking (details not specified)
- Utilities: City water and sewer (SAWS); Electric service by CPS; Gas service by CPS; Garbage service by city; Spectrum Internet available; Low-flow toilet (green feature)
- Home design: Pre-owned single-family home built by Lennar (approx. 3 years old); Slab foundation; Composition roof
- Construction: Built by Lennar; Cement fiber exterior; Composition roof; Slab foundation
- Exterior features: Cement fiber exterior; Neighborhood amenities include pool, tennis, golf course, clubhouse, park/playground and sports court
Interior
- Kitchen: Stove/Range; Refrigerator; Dishwasher; Disposal; Ice maker connection; Vent fan
- Bedrooms: Master bedroom on lower level with walk-in closet and full bath; Second bedroom; Third bedroom; Master bedroom approx. 13 x 14; Bedrooms 2 and 3 approx. 10 x 12
- Flooring: Carpeting; Vinyl flooring
- Bathrooms: Two full bathrooms; Master bath with tub/shower combination (approx. 5 x 5)
- Heating & cooling: Central heating (natural gas); Central air conditioning
- Interior features: Open floor plan with living/dining combination; Eat-in kitchen with breakfast bar; Utility room inside; Ground level / no steps; Cable TV and high-speed internet available; Smoke alarm; All window coverings remain; Walk-in closets; Laundry room
- Laundry & utility: Washer connection; Dryer connection; Electric water heater
Neighborhood map
What this means for you Summary
Snapshot
- This is a 3-bed/2.0-bath single-family listed at $165k. Condition is rated good.
Deal economics
- At list price, monthly cash flow is $-80 ($-962/yr) — negative.
- To cash-flow at today's rent, offer at most $151k (8.6% below list).
- To meet the 1% rule (rent ≥ 1% of price), the offer needs to be $159k (3.7% below list).
- Recommended offer: $151k (8.6% below list) — sets the bar for cash-flow.
- Cap rate 5.7% vs local median 3.8% in San Antonio — top-decile yield for the area; either an underpriced asset or a hidden risk that comps aren't pricing in. Stress-test before assuming the spread holds.
Location & tenants
- Location reads 80/100 on livability (#31 in TX, #1,616 nationally) — a professional / high-income tenant draw. Strengths: amenities A+, commute A+, cost of living A+; Watch: crime F.
- Southside ISD (rural): math 16% / reading 25% proficiency, ranked #771 of 826 in TX (top 93%) — low school quality limits family demand, transient renter base, plan for 1-2y turnover; 76% free/reduced lunch — lower-income household profile, screen leases tightly.
- Zoned schools: Julian C Gallardo El (math 13% / reading 22%, grade F, #3,805 of 4,322 statewide, top 89%, 544 students, 87% FRL); Southside H S (math 18% / reading 25%, grade F, #1,377 of 1,632 statewide, top 85%, 1,685 students, 85% FRL).
- Market conditions: Rents falling (-7.2%/yr); 369 active listings in the ZIP; 23 comparable units currently listed for rent nearby; rentals at typical pace (median 22d on market — plan ~3-4 weeks tenant-placement turnaround); 8,308 units permitted in Bexar County in 2024 (2,506 in 5+ unit buildings).
Forward outlook
- In year one you build about $4k of equity ($1k loan paydown + $3k appreciation (2.0% local appreciation)).
- Bexar County population projected at +50% by 2050 — long-run rental-demand tailwind backs the buy-and-hold thesis.
- By year 8, paydown + projected appreciation supports a ~$34k cash-out refi (75% LTV) — recoverable capital for the next deal without selling this one.
Negotiation context
- It's been on market 55 days — a 3% lower offer ($160k) is reasonable based on typical stale-listing flexibility.
- 2 sale attempts since 3y ago with the ask held roughly flat each time — persistent listings suggest the price (not the market) is what's stuck; bring a comps-based counter.
Risks & watch-outs
- Watch-outs: property tax is 2.7% of price.
Questions for the listing agent
- What do current leases actually rent for vs. the listed asking? Can we see a recent rent roll and the last 12 months of T-12 income?
- It's been on market 55 days. Have you received any prior offers? Is the seller open to a 9% concession, seller financing, or rate buy-down credit?
- Property tax is high relative to price — has the assessment been appealed recently, and will the sale trigger a re-assessment?
- What does the HOA fee cover, when was the last increase, and are there any pending special assessments or reserve-fund shortfalls?
- Is there a deadline driving the sale (1031 exchange, divorce, estate, relocation)? That informs how much negotiation room exists.
- Crime grade is F in this area — have there been break-ins, vandalism, or insurance claims at this property in the last 3 years? What carrier currently insures it and at what premium?
- The area grade is low — what's the realistic commute time and amenity access for the typical tenant pool here? Any planned neighborhood developments (good or bad) we should know about?
- What's the average days-on-market for RENTAL listings here right now (not sales)? A rising rental-DOM trend means longer vacancies and softer asking-rent achievability than the comps imply.
- What's the recent tenant-quality profile in this submarket — average credit score on applications, eviction rate, late-payment / NSF rate, and stable-employment percentage? A property-management company in the area should have these aggregated.
- How much new for-sale + rental construction is in the pipeline within 1–3 miles? Heavy new supply typically softens prices + rents 12–24 months out; constrained supply supports both.
Investment metrics
- 1% rule
- 0.96% ✗
- Cap rate
- 5.71%
- Cash-on-cash
- -2.08%
- DSCR
- 0.91
- GRM
- 8.6
CMA / ARV
- ARV (median comp)
- $201,579
- List price
- $164,990
- Delta
- -18.15%
- Verdict
- UNDERPRICED
- Comps
- 20 within 1.0 mi
Show comp detail 12 sales within ~0.75 mi
| Address | Dist | Beds/Ba | Sqft | Sold | Price | $/sf | Match |
|---|---|---|---|---|---|---|---|
| 12060 Overton | 0.46mi | 3/2.0 | 1,450 (0%) | 2mo | $225,000 | $155 | 76 |
| 1526 Amie Blf | 0.58mi | 3/2.0 | 1,402 (-3%) | 3mo | $193,999 | $138 | 65 |
| 13234 Club House Blvd | 0.50mi | 4/2.0 (+1) | 1,377 (-5%) | 1mo | $246,675 | $179 | 63 |
| 1764 Charlie Cv | 0.58mi | 3/2.0 | 1,402 (-3%) | 7mo | $190,899 | $136 | 62 |
| 751 Vermilion | 0.69mi | 3/2.0 | 1,454 (+0%) | 8mo | $234,999 | $162 | 61 |
| 711 Cook Bnd | 0.40mi | 3/2.0 | 1,276 (-12%) | 4mo | $154,000 | $121 | 58 |
| 1760 Charlie Cv | 0.58mi | 4/2.0 (+1) | 1,575 (+9%) | 4mo | $209,999 | $133 | 50 |
| 1514 Amie Blf | 0.58mi | 4/2.0 (+1) | 1,575 (+9%) | 6mo | $207,999 | $132 | 48 |
| 1617 Amie Blf | 0.58mi | 4/2.0 (+1) | 1,575 (+9%) | 6mo | $222,999 | $142 | 48 |
| 1827 Charlie Cv | 0.58mi | 4/2.0 (+1) | 1,575 (+9%) | 7mo | $201,999 | $128 | 48 |
| 1843 Charlie Cv | 0.58mi | 4/2.0 (+1) | 1,575 (+9%) | 8mo | $198,999 | $126 | 47 |
| 1815 Charlie Cv | 0.58mi | 4/2.0 (+1) | 1,600 (+10%) | 8mo | $197,999 | $124 | 44 |
Match score weights: distance 35% · size 25% · config 20% · recency 20%. Top-matched comps best support the ARV.
Projected returns pro-forma
2.03% appreciation · 0.0% rent growth · sell at horizon
- IRR
- 0.8%
- Equity multiple
- 1.04×
- Total profit
- $1,929
- Equity at exit
- $65,330
- IRR
- 3.2%
- Equity multiple
- 1.42×
- Total profit
- $19,555
- Equity at exit
- $94,272
Cash invested: $46,197 (down + closing). Projections, not guarantees.
Landlord ↔ Tenant lean methodology
- Overall (STATE)
- 87 Strongly Landlord-Friendly
- State Texas
- 87 Strongly Landlord-Friendly · R+5
- County
- — inherits STATE
- City
- — inherits STATE
ZIP-level market 78221
- Home prices YoY
- 0.8%
- Rents YoY
- -7.2%
- Active inventory
- 369
- Price-to-rent
- 8.6×
Monthly cashflow live
- Estimated rent
- $1,590 high interval (Pro) →
- Mortgage (P&I)
- −$865
- Tax from tax record
- −$373 /mo · $4,475/yr
- Insurance
- −$69
- HOA
- −$29
- Vacancy / Maint / Mgmt
- −$334
- Net cashflow
- $-80
Break-even live
UW: 25.0% down · 7.5% · 30yr · 1.5% tax · 5.0% vac · 8.0% maint · 8.0% mgmt
Financing live
Cash to close
- Down payment
- $41,248
- Closing costs
- $4,950
- Reserves months
- —
- Total cash needed
- —
Loan-product check · same deal, 3 products live
Conventional
25% down · 7.5% · 30yr
- Down + closing
- —
- Monthly P&I
- —
- Monthly cashflow
- —
- DSCR
- —
- Eligible?
- —
Personal DTI + credit; lowest rate.
DSCR
20% down · 8.5% · 30yr
- Down + closing
- —
- Monthly P&I
- —
- Monthly cashflow
- —
- DSCR
- —
- Eligible?
- —
No personal income docs; deal must DSCR.
Hard money
10% down · 12.0% · 12mo
- Down + closing
- —
- Monthly P&I
- —
- Monthly cashflow
- —
- DSCR
- —
- Eligible?
- —
Short-term bridge; refi at stabilization.
Rent comps 23 comps
| Address | Beds | Baths | Sqft | Rent | $/sqft | DOM | Units | Dist |
|---|---|---|---|---|---|---|---|---|
| 907 Stricker Path San Antonio, TX | 3.0 | 2.0 | 1129 | $1,500 | $1.33 | 23d | 1 | 0.03mi |
| 1019 Magrum Way San Antonio, TX | 3.0 | 2.0 | 1300 | $1,445 | $1.11 | 10d | 1 | 0.07mi |
| 1115 Janzen Rd San Antonio, TX | 3.0 | 2.0 | 1300 | $1,595 | $1.23 | 43d | 1 | 0.09mi |
| 1019 Snedeker Dr San Antonio, TX | 3.0 | 2.0 | 1200 | $1,449 | $1.21 | 23d | 1 | 0.12mi |
| 1038 Janzen Rd San Antonio, TX | 3.0 | 2.0 | 1125 | $1,725 | $1.53 | 21d | 1 | 0.12mi |
| 13222 Dutra Rd San Antonio, TX | 3.0 | 2.0 | 1266 | $1,595 | $1.26 | 23d | 1 | 0.13mi |
| 13806 S Strange Way San Antonio, TX | 4.0 | 2.0 | 1668 | $1,795 | $1.08 | 23d | 1 | 0.35mi |
| 1343 Art Wall Way San Antonio, TX | 3.0 | 2.0 | 1440 | $1,395 | $0.97 | 43d | 1 | 0.37mi |
| 12055 Links Pkwy San Antonio, TX | 3.0 | 2.0 | 1479 | $1,625 | $1.10 | 23d | 1 | 0.41mi |
| 12030 Picard Bnd San Antonio, TX | 3.0 | 2.0 | 1450 | $1,495 | $1.03 | 3d | 1 | 0.46mi |
| 742 Haas Way San Antonio, TX | 4.0 | 2.0 | 1699 | $2,100 | $1.24 | 17d | 1 | 0.51mi |
| 718 Albatross Way San Antonio, TX | 3.0 | 2.0 | 1436 | $1,650 | $1.15 | 12d | 1 | 0.52mi |
| 11963 Sand Wedge Way San Antonio, TX | 3.0 | 3.5 | 1474 | $1,575 | $1.07 | 4d | 1 | 0.52mi |
| 934 Cook Bnd San Antonio, TX | 4.0 | 2.0 | 1627 | $1,445 | $0.89 | 23d | 1 | 0.55mi |
| 12015 Still Pass San Antonio, TX | 4.0 | 2.0 | 1635 | $1,600 | $0.98 | 20d | 1 | 0.55mi |
| 1003 Beck Rd San Antonio, TX | 3.0 | 2.0 | 1213 | $1,490 | $1.23 | 4d | 1 | 0.58mi |
| 1030 Snedeker DR San Antonio, TX | 4.0 | 2.0 | 1500 | $1,499 | $1.00 | 23d | 1 | 0.58mi |
| 1327 Mission Grande Unit 710 San Antonio, TX | 2.0 | 2.0 | 945 | $1,081 | $1.14 | 2d | 1 | 0.73mi |
| 12910 Clubhouse Blvd San Antonio, TX | 1.0–3.0 | 1.0–2.0 | 920 | $1,384 | $1.50 | 1d | 27 | 0.92mi |
| 2203 Cielo Rio, Lot 102 San Antonio, TX | 2.0–4.0 | 2.0–2.5 | 1574 | $2,360 | $1.50 | 1d | 152 | 1.07mi |
| 11426 Four Iron Way San Antonio, TX | 4.0 | 2.5 | 1814 | $1,695 | $0.93 | 4d | 1 | 1.19mi |
| 1711 Cody Clf San Antonio, TX | 3.0 | 2.5 | 1689 | $1,695 | $1.00 | 23d | 1 | 1.20mi |
| 1119 Jordan Xing San Antonio, TX | 3.0 | 2.0 | 1276 | $1,795 | $1.41 | 43d | 1 | 1.34mi |
HOA detail
- Monthly dues
- $29 · $348/yr
Listing history 21 events
-
2026-06-17status $164,990 Pending 55 DOM
-
2026-06-17days on market $164,990 Active Option 55 DOM
-
2026-06-16days on market $164,990 Active Option 54 DOM
-
2026-06-15days on market $164,990 Active Option 53 DOM
-
2026-06-13days on market $164,990 Active Option 51 DOM
-
2026-06-13days on market $164,990 Active Option 50 DOM
-
2026-06-09days on market $164,990 Active Option 47 DOM
-
2026-06-08days on market $164,990 Active Option 46 DOM
-
2026-06-07days on market $164,990 Active Option 45 DOM
-
2026-06-04days on market $164,990 Active Option 42 DOM
-
2026-06-03days on market $164,990 Active Option 41 DOM
-
2026-06-02statusdays on market $164,990 Active Option 40 DOM
-
2026-06-01days on market $164,990 Price Change 39 DOM
-
2026-05-31days on market $164,990 Price Change 38 DOM
-
2026-05-14price $169,990 553-char remark
-
2026-04-23$170,000 New 553-char remark
-
2023-11-30soldstatus Sold 491-char remark
Show marketing remark (491 chars)
This Cambria single-story home has a smart layout that offers convenience and seamless living. An open concept layout is situated among the modern kitchen, dining area and family room to allow for easy multitasking. Two secondary bedrooms are found by the front door, while the owner's suite is tucked into the back corner for maximum privacy with a full bathroom. Prices and features may vary and are subject to change. Photos are for illustrative purposes only. Estimated COE Nov 2023!
-
2023-11-14status Pending 491-char remark
Show marketing remark (491 chars)
This Cambria single-story home has a smart layout that offers convenience and seamless living. An open concept layout is situated among the modern kitchen, dining area and family room to allow for easy multitasking. Two secondary bedrooms are found by the front door, while the owner's suite is tucked into the back corner for maximum privacy with a full bathroom. Prices and features may vary and are subject to change. Photos are for illustrative purposes only. Estimated COE Nov 2023!
-
2023-11-05price $191,999 491-char remark
Show marketing remark (491 chars)
This Cambria single-story home has a smart layout that offers convenience and seamless living. An open concept layout is situated among the modern kitchen, dining area and family room to allow for easy multitasking. Two secondary bedrooms are found by the front door, while the owner's suite is tucked into the back corner for maximum privacy with a full bathroom. Prices and features may vary and are subject to change. Photos are for illustrative purposes only. Estimated COE Nov 2023!
-
2023-10-29price $194,499 491-char remark
Show marketing remark (491 chars)
This Cambria single-story home has a smart layout that offers convenience and seamless living. An open concept layout is situated among the modern kitchen, dining area and family room to allow for easy multitasking. Two secondary bedrooms are found by the front door, while the owner's suite is tucked into the back corner for maximum privacy with a full bathroom. Prices and features may vary and are subject to change. Photos are for illustrative purposes only. Estimated COE Nov 2023!
-
2023-10-19$196,999 New 491-char remark
Show marketing remark (491 chars)
This Cambria single-story home has a smart layout that offers convenience and seamless living. An open concept layout is situated among the modern kitchen, dining area and family room to allow for easy multitasking. Two secondary bedrooms are found by the front door, while the owner's suite is tucked into the back corner for maximum privacy with a full bathroom. Prices and features may vary and are subject to change. Photos are for illustrative purposes only. Estimated COE Nov 2023!
ⓘ Source: listings_history table (triggers on properties + properties_extension) + one-shot
backfill from property_details.listing_events for pre-trigger history.
Tax reassessment forecast TX · Resets to sale price
- Current annual tax
- $4,475 · $373/mo
- Projected year-2 tax
- $4,475 · $373/mo
- Expected delta
- $0/yr ($0/mo · 0.0%)
ⓘ Screening estimate from a state-policy table — verify with the county assessor before closing.
Nearby sold comps map
Loading sold comps map…
Walkable amenities ~0.75 mi
Loading nearby amenities…
Taxation est. · year 1
- Rental income
- $19,074
- − Mortgage interest
- −$9,242
- − Property taxes
- −$4,475
- − Insurance
- −$825
- − Repairs & maintenance
- −$1,526
- − Management
- −$1,526
- − HOA
- −$348
- − Depreciation
- −$4,800
- Taxable loss
- −$3,668
- Est. tax savings @ 24.0%
- +$880
- After-tax cash flow
- $-82/yr
For passive investors: Depreciation is non-cash, so a rental often shows a tax loss while cash-flowing — sheltering income. Rental losses are passive: they offset passive income freely, and up to $25,000/yr can offset ordinary (W-2) income if you actively participate and your MAGI is under $100k (phasing out to $0 by $150k); unused losses carry forward. On sale, claimed depreciation is recaptured at up to 25%, and gains may owe capital-gains tax (a 1031 exchange can defer both). Figures are a year-1 estimate at your 24.0% rate — not tax advice; consult a CPA.
Condition & rehab AI · 12 photos
This well-maintained single-story home offers a clean, comfortable feel with modern updates and a smart layout.
Value-add opportunities
- Resale Paint exterior trim — Enhances curb appeal and value
- Rental Clean gutters — Keeps property in good condition and reduces maintenance costs
Renovation cost estimate screening
Value-add ROI direction
- Resale Paint exterior trim — Enhances curb appeal and value ↑
- Rental Clean gutters — Keeps property in good condition and reduces maintenance costs ↑
ⓘ Cost ranges are severity-bucket heuristics (US national rule-of-thumb). Get contractor quotes + a written scope before underwriting a rehab budget.
Schools (NCES district)
- District
- Southside ISD
- NCES district ID
- 4840920
- Math proficiency
- 16% ▼ -15.00%
- Reading proficiency
- 25% ▼ -2.00%
- Median HH income
- $43,526
- Composite
- 17.68/100
- National rank
- #9027
- State rank
- #771 of 826 in TX
Livability — San Antonio
- Score
- 80/100
- State rank
- #31
- US rank
- #1616
Category grades
Schools grade is shown separately in the Schools card above.
Census & demographics
- Census place
- San Antonio, TX
- County
- Bexar County · 1,990,555 people
- City population
- 1,806,925
- Metro
- San Antonio-New Braunfels, TX
- Population (ZIP)
- 42,178
- Household income
- $63,811
- Rent vs Own
- Severe rent burden
- 1180.0
Population outlook (Bexar County) Hauer SSP2
- Today (2025)
- 2,336,851 people
- By 2030
- 2,560,728 · +9.6%
- By 2040
- 3,020,569 · +29.3%
- By 2050
- 3,493,522 · +49.5%
- By 2075
- 4,668,459 · +99.8%
- By 2100
- 5,533,242 · +136.8%
Race, ethnicity, and origin ACS 2023
- Neighborhood character
- Predominantly Hispanic (89%)
- Race & ethnicity
- Hispanic / Latino 89% Two or more races 28% White 9% Native American 2%
- Hispanic origin (detail)
- Mexican 74%
- Common ancestry
- Lithuanian 1% Romanian 1%
- Foreign-born
- 16% · Canada
- Languages at home
- 45% English-only · Spanish 54%
Political lean MEDSL · Bexar
- 2024 margin
- Lean D (+9.8) · D 54.3% · R 44.6% · Other 1.1%
- 2008→2024 swing
- +4.2pp toward D · 2008: 5.6pp · 2024: 9.8pp
- All cycles
- 2024: D+9.8 2020: D+18.2 2016: D+13.5 2012: D+4.6 2008: D+5.6
Not yet ingested
- Civics
- —
Market trends
- HPI YoY
- ▲ 2.03%
- Current HPI
- 251.1635
- Rent YoY
- ▼ -7.21%
- Metro
- San Antonio-New Braunfels, TX
- State GDP YoY
- ▲ 3.95%
- F500 in state
- 110
Industry mix (Fortune 500 HQ in TX)
| Industry | F500 HQs | Revenue |
|---|---|---|
| Energy | 16 | $1,198B |
|
||
| Technology | 5 | $198B |
|
||
| Engineering / Construction | 4 | $72B |
|
||
| Energy Services | 3 | $60B |
|
||
| Utilities | 3 | $41B |
|
||
| Healthcare | 2 | $330B |
|
||
Price history
-16.2% since first listed10 events — show timeline
- 2026-06-17 Pending — LERA
- 2026-06-02 Contingent — LERA
- 2026-05-25 Price Changed $164,990 LERA
- 2026-05-14 Price Changed $169,990 LERA
- 2026-04-23 Listed $170,000 LERA
- 2023-11-30 Sold (MLS) — LERA
- 2023-11-14 Pending — LERA
- 2023-11-05 Price Changed $191,999 LERA
- 2023-10-29 Price Changed $194,499 LERA
- 2023-10-19 Listed $196,999 LERA
Property tax history
-4.7%/yrLatest (2025): $4,475 · -4.7% YoY. Source: county tax records.
Cash-flow waterfall
monthlySold comps — $/sqft
last 12 mo · ≤1 miLoading sold comps…