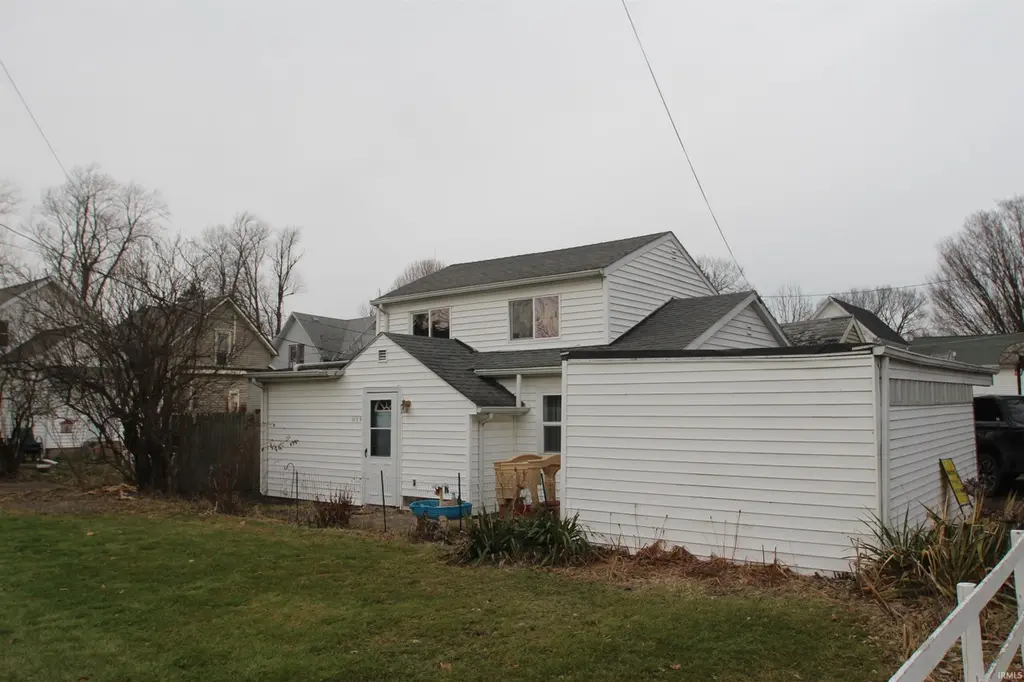
113 1/2 S Morton St · Kendallville, IN
Flood risk 1/10 · Minimal
- FEMA flood zone
- X (unshaded)
- Chance of flooding over 30 yrs
- 0.0%
- Est. flood insurance / yr
- $507 – $1,088
Fire risk 1/10 · Minimal
- Est. fire insurance / yr
- $717 – $1,331
Heat risk 2/10 · Minimal
- Hot days now (above 99°F)
- 7 days/yr
- Hot days in 30 yrs
- 16 days/yr
Wind risk 2/10 · Minimal
- Chance of severe wind over 30 yrs
- —
Air-quality risk 2/10 · Minimal
- Unhealthy air days now
- 1 days/yr
- Unhealthy air days in 30 yrs
- 1 days/yr
Risk factors via First Street. Map © Google.
Why this score? — see what drove the B- grade
The composite is a weighted blend of 9 inputs, each scored 0–100. Each bar is that input's sub-score; the figure is the points it added to the 100-point composite (weight × sub-score).
- Cash flow +26.0/30.0
- ARV discount +15.0/15.0
- DSCR +8.8/10.0
- 1% rule +6.9/10.0
- Livability +3.3/5.0
- Schools +2.8/10.0
- Rent growth +2.5/5.0
- Condition / age +2.2/5.0
- Appreciation +0.0/10.0
$90,000
🖨 Deal sheet (PDF) 📄 Offer letter ✓ Due diligence
Listing remarks MLS
Updated clean 3 bedroom , 1 bath home in downtown Kendallville. Close to Sunset Park and the Kendallville Elks golf course.
Key facts
- Sunset park
- 1,742 sq ft lot
- Garage
Tags
Neighborhood map
What this means for you Summary
Snapshot
- This is a 3-bed/1.0-bath single-family listed at $90k. Condition is rated fair.
Deal economics
- At list price, monthly cash flow is $225 ($3k/yr) — positive.
- The deal already cash-flows at list — no discount required.
- Meets the 1% rule at list price ($1k rent vs $90k).
- Recommended offer: $79k (12.0% below list) — sets the bar for market timing.
- Cap rate 9.3% vs local median 3.6% in Kendallville — top-decile yield for the area; either an underpriced asset or a hidden risk that comps aren't pricing in. Stress-test before assuming the spread holds.
Location & tenants
- Location reads 66/100 on livability (#305 in IN) — a middle-class / working-renter tenant base. Strengths: cost of living A+, housing A+, crime A-; Watch: employment D+, amenities F, commute F.
- East Noble School Corporation (town): math 32% / reading 32% proficiency, ranked #216 of 301 in IN (top 72%) — families likely to look elsewhere, expect single-tenant / working-renter base with shorter leases.
- Zoned schools: North Side Elementary School (math 32% / reading 27%, grade F, #697 of 994 statewide, top 73%, 293 students, 64% FRL); East Noble Middle School (math 27% / reading 29%, grade F, #226 of 330 statewide, top 69%, 796 students, 54% FRL); East Noble High School (math 38% / reading 52%, grade D-, #166 of 369 statewide, top 45%, 1,054 students, 43% FRL).
- Market conditions: 102 active listings in the ZIP; 5 comparable units currently listed for rent nearby; rentals lingering (median 46d on market — plan ~5-8 weeks vacancy on turnover, expect pricing pressure); 80% of comp listings sitting > 30 days — soft ceiling on asking rent; 131 units permitted in Noble County in 2024 (0 in 5+ unit buildings).
Forward outlook
- Local home prices are declining (-3.0%/yr); year-one equity from $622 of loan paydown is wiped out by about $3k of value loss. Plan a longer hold.
- Noble County population projected to shrink 8% by 2050 — rents likely to lag national; underwrite the cash flow, not the appreciation.
Negotiation context
- It's been on market 129 days — a 12% lower offer ($79k) is reasonable based on typical stale-listing flexibility.
- 5 sale attempts since 3y ago; this cycle's ask has dropped $10k (10%) from the opening price — seller is motivated, your offer sets the floor, not the list.
Risks & watch-outs
- Watch-outs: built in 1910 — expect roof / HVAC / electrical / plumbing capex.
Questions for the listing agent
- It's been on market 129 days. Have you received any prior offers? Is the seller open to a 12% concession, seller financing, or rate buy-down credit?
- Have any recent inspections been done? Can we get a copy of the seller's disclosures and any deferred-maintenance estimates?
- Built in 1910 — when were the roof, HVAC, electrical panel, plumbing, and water heater last replaced?
- Why hasn't it sold? Are there any deal-killer items the seller is aware of (foundation, flood, title, zoning, code violations)?
- Is there a deadline driving the sale (1031 exchange, divorce, estate, relocation)? That informs how much negotiation room exists.
- Schools are D-rated, which usually means shorter tenancies and higher turnover. Who's the typical renter profile here, and what's been the actual vacancy rate?
- What's the average days-on-market for RENTAL listings here right now (not sales)? A rising rental-DOM trend means longer vacancies and softer asking-rent achievability than the comps imply.
- What's the recent tenant-quality profile in this submarket — average credit score on applications, eviction rate, late-payment / NSF rate, and stable-employment percentage? A property-management company in the area should have these aggregated.
- How much new for-sale + rental construction is in the pipeline within 1–3 miles? Heavy new supply typically softens prices + rents 12–24 months out; constrained supply supports both.
Investment metrics
- 1% rule
- 1.19% ✓
- Cap rate
- 9.29%
- Cash-on-cash
- 10.72%
- DSCR
- 1.48
- GRM
- 7.0
CMA / ARV
- ARV (median comp)
- $163,331
- List price
- $90,000
- Delta
- -44.90%
- Verdict
- UNDERPRICED
- Comps
- 20 within 1.0 mi
Show comp detail 12 sales within ~0.75 mi
| Address | Dist | Beds/Ba | Sqft | Sold | Price | $/sf | Match |
|---|---|---|---|---|---|---|---|
| 215 S Morton St | 0.09mi | 2/1.0 (-1) | 983 (+2%) | 1mo | $139,000 | $141 | 86 |
| 702 W Rush St | 0.22mi | 3/1.0 | 985 (+3%) | 9mo | $169,000 | $172 | 78 |
| 608 N Main St | 0.56mi | 3/1.0 | 936 (-2%) | 8mo | $155,000 | $166 | 64 |
| 207 E Lisle St | 0.62mi | 2/1.0 (-1) | 926 (-4%) | 1mo | $138,900 | $150 | 60 |
| 116 S Summit St | 0.50mi | 3/1.0 | 892 (-7%) | 12mo | $150,000 | $168 | 55 |
| 118 E Grove Street St | 0.47mi | 2/1.0 (-1) | 1,013 (+6%) | 12mo | $124,905 | $123 | 54 |
| 326 E Lisle St | 0.74mi | 3/1.0 | 1,008 (+5%) | 7mo | $172,000 | $171 | 52 |
| 205 E High St | 0.69mi | 3/1.0 | 912 (-5%) | 12mo | $155,000 | $170 | 50 |
| 120 E High St | 0.62mi | 2/1.0 (-1) | 1,056 (+10%) | 4mo | $162,000 | $153 | 46 |
| 210 E North St | 0.71mi | 2/1.0 (-1) | 998 (+4%) | 11mo | $140,000 | $140 | 46 |
| 558 N Riley St | 0.74mi | 2/1.0 (-1) | 858 (-11%) | 3mo | $125,000 | $146 | 40 |
| 702 S Oak St | 0.64mi | 2/1.0 (-1) | 832 (-13%) | 6mo | $150,000 | $180 | 38 |
Match score weights: distance 35% · size 25% · config 20% · recency 20%. Top-matched comps best support the ARV.
Projected returns pro-forma
-3.0% appreciation · 3.0% rent growth · sell at horizon
- IRR
- -0.2%
- Equity multiple
- 0.99×
- Total profit
- $-234
- Equity at exit
- $13,419
- IRR
- 9.4%
- Equity multiple
- 1.73×
- Total profit
- $18,319
- Equity at exit
- $7,782
Cash invested: $25,200 (down + closing). Projections, not guarantees.
Landlord ↔ Tenant lean methodology
- Overall (STATE)
- 90 Strongly Landlord-Friendly
- State Indiana
- 90 Strongly Landlord-Friendly · R+11
- County
- — inherits STATE
- City
- — inherits STATE
ZIP-level market 46755
- Home prices YoY
- -12.8%
- Active inventory
- 102
- Price-to-rent
- 7.0×
Monthly cashflow live
- Estimated rent
- $1,072 high interval (Pro) →
- Mortgage (P&I)
- −$472
- Tax est. 1.5%
- −$112 /mo · $1,350/yr
- Insurance
- −$38
- HOA
- −$0
- Vacancy / Maint / Mgmt
- −$225
- Net cashflow
- $225
Break-even live
Sensitivity live
| Price | -10% $287 | -5% $256 | +0% $225 | +5% $194 | +10% $163 |
|---|---|---|---|---|---|
| Rent | -10% $140 | -5% $183 | +0% $225 | +5% $267 | +10% $310 |
| Rate | -1.0pp $270 | -0.5pp $248 | base $225 | +0.5pp $202 | +1.0pp $178 |
UW: 25.0% down · 7.5% · 30yr · 1.5% tax · 5.0% vac · 8.0% maint · 8.0% mgmt
Financing live
Cash to close
- Down payment
- $22,500
- Closing costs
- $2,700
- Reserves months
- —
- Total cash needed
- —
Loan-product check · same deal, 3 products live
Conventional
25% down · 7.5% · 30yr
- Down + closing
- —
- Monthly P&I
- —
- Monthly cashflow
- —
- DSCR
- —
- Eligible?
- —
Personal DTI + credit; lowest rate.
DSCR
20% down · 8.5% · 30yr
- Down + closing
- —
- Monthly P&I
- —
- Monthly cashflow
- —
- DSCR
- —
- Eligible?
- —
No personal income docs; deal must DSCR.
Hard money
10% down · 12.0% · 12mo
- Down + closing
- —
- Monthly P&I
- —
- Monthly cashflow
- —
- DSCR
- —
- Eligible?
- —
Short-term bridge; refi at stabilization.
Rent comps 5 comps
| Address | Beds | Baths | Sqft | Rent | $/sqft | DOM | Units | Dist |
|---|---|---|---|---|---|---|---|---|
| 636 Berry Ln Kendallville, IN | 2.0 | 1.0 | 750 | $772 | $1.03 | 23d | 3 | 0.52mi |
| 707 Lake Ave Kendallville, IN | 2.0 | 1.0 | 750 | $915 | $1.22 | 45d | 1 | 0.92mi |
| 506 Seagraves Ave Kendallville, IN | 2.0 | 1.0 | 1054 | $1,500 | $1.42 | 45d | 1 | 0.98mi |
| 504 Seagraves Ave Kendallville, IN | 2.0 | 1.0 | 1054 | $1,400 | $1.33 | 45d | 1 | 0.99mi |
| 1214 Garden St Kendallville, IN | 2.0 | 1.0 | 864 | $950 | $1.10 | 45d | 1 | 0.99mi |
Listing history 22 events
-
2026-06-12statusdays on market $90,000 Pending 129 DOM
-
2026-06-09days on market $90,000 Active 126 DOM
-
2026-06-08days on market $90,000 Active 125 DOM
-
2026-06-07days on market $90,000 Active 124 DOM
-
2026-06-04days on market $90,000 Active 120 DOM
-
2026-06-03days on market $90,000 Active 119 DOM
-
2026-05-31days on market $90,000 Active 122 DOM
-
2026-05-19status Pending 123-char remark
Show marketing remark (123 chars)
Updated clean 3 bedroom , 1 bath home in downtown Kendallville. Close to Sunset Park and the Kendallville Elks golf course.
-
2026-04-28price $90,000 123-char remark
Show marketing remark (123 chars)
Updated clean 3 bedroom , 1 bath home in downtown Kendallville. Close to Sunset Park and the Kendallville Elks golf course.
-
2026-03-16price $95,000 123-char remark
Show marketing remark (123 chars)
Updated clean 3 bedroom , 1 bath home in downtown Kendallville. Close to Sunset Park and the Kendallville Elks golf course.
-
2026-02-23price $97,000 123-char remark
Show marketing remark (123 chars)
Updated clean 3 bedroom , 1 bath home in downtown Kendallville. Close to Sunset Park and the Kendallville Elks golf course.
-
2026-01-19$100,000 Active 123-char remark
Show marketing remark (123 chars)
Updated clean 3 bedroom , 1 bath home in downtown Kendallville. Close to Sunset Park and the Kendallville Elks golf course.
-
2025-11-14price $100,000
-
2025-08-11price $110,000
-
2025-07-18$120,000 Active
-
2024-02-08price $89,900
-
2023-12-31status Active
-
2023-11-19price $91,900
-
2023-09-28price $96,900
-
2023-09-14status Active
-
2023-08-17historical Active Under Contract
-
2023-07-21$99,900 Active
ⓘ Source: listings_history table (triggers on properties + properties_extension) + one-shot
backfill from property_details.listing_events for pre-trigger history.
Climate risk First Street
- Flood 1/10 Low FEMA zone X (unshaded) · 0% chance over 30 yrs
- Wildfire 1/10 Low
- Heat 2/10 Low 7 d/yr ≥99°F today · 16 d/yr by 30 yrs out
- Wind 2/10 Low
- Air quality 2/10 Low 1 unhealthy d/yr today · 1 by 30 yrs out
Nearby sold comps map
Loading sold comps map…
Walkable amenities ~0.75 mi
Loading nearby amenities…
Taxation est. · year 1
- Rental income
- $12,866
- − Mortgage interest
- −$5,041
- − Property taxes
- −$1,350
- − Insurance
- −$450
- − Repairs & maintenance
- −$1,029
- − Management
- −$1,029
- − Depreciation
- −$2,618
- Taxable income
- $1,348
- Est. tax owed @ 24.0%
- −$324
- After-tax cash flow
- $2,377/yr
For passive investors: Depreciation is non-cash, so a rental often shows a tax loss while cash-flowing — sheltering income. Rental losses are passive: they offset passive income freely, and up to $25,000/yr can offset ordinary (W-2) income if you actively participate and your MAGI is under $100k (phasing out to $0 by $150k); unused losses carry forward. On sale, claimed depreciation is recaptured at up to 25%, and gains may owe capital-gains tax (a 1031 exchange can defer both). Figures are a year-1 estimate at your 24.0% rate — not tax advice; consult a CPA.
Condition & rehab AI · 1 photo
This single-family home in Kendallville requires moderate renovations to improve its exterior, interior, and landscaping, significantly enhancing its resale and rental value.
Repairs flagged
- Major exterior siding — Significant wear and tear
- Major roof — No visible damage, but age is implied
- Major landscaping — Overgrown yard, unkempt appearance
Value-add opportunities
- Both landscaping and curb appeal — Improves aesthetic and first impression
- Both exterior siding and roof — Enhances curb appeal and structural integrity
- Both interior paint and flooring — Updates interior and enhances living space
Renovation cost estimate screening
| Repair item | Severity | Est. cost |
|---|---|---|
| exterior siding · Significant wear and tear | Major | $15,000–50,000 |
| roof · No visible damage, but age is implied | Major | $15,000–50,000 |
| landscaping · Overgrown yard, unkempt appearance | Major | $15,000–50,000 |
| Total estimated repair cost · 3 items | $45,000–150,000 |
Value-add ROI direction
- Both landscaping and curb appeal — Improves aesthetic and first impression ↑
- Both exterior siding and roof — Enhances curb appeal and structural integrity ↑
- Both interior paint and flooring — Updates interior and enhances living space ↑
ⓘ Cost ranges are severity-bucket heuristics (US national rule-of-thumb). Get contractor quotes + a written scope before underwriting a rehab budget.
Schools (NCES district)
- District
- East Noble School Corporation
- NCES district ID
- 1802970
- Math proficiency
- 32% ▼ -8.00%
- Reading proficiency
- 32% ▼ -8.00%
- Median HH income
- $47,954
- Composite
- 27.67/100
- National rank
- #6916
- State rank
- #216 of 301 in IN
Livability — Kendallville
- Score
- 66/100
- State rank
- #305
- US rank
- #12100
Category grades
Schools grade is shown separately in the Schools card above.
Census & demographics
- Census place
- Kendallville, IN
- City population
- 15,528
- Population (ZIP)
- 15,528
Population outlook (Noble County) Hauer SSP2
- Today (2025)
- 48,321 people
- By 2030
- 47,945 · -0.8%
- By 2040
- 46,521 · -3.7%
- By 2050
- 44,501 · -7.9%
- By 2075
- 38,962 · -19.4%
- By 2100
- 31,846 · -34.1%
Race, ethnicity, and origin ACS 2023
- Neighborhood character
- Predominantly White (88%)
- Race & ethnicity
- White 88% Hispanic / Latino 8% Two or more races 6% Asian 1%
- Hispanic origin (detail)
- Mexican 6%
- Common ancestry
- Italian 11% Romanian 4% Lithuanian 2%
- Foreign-born
- 7% · Canada, Vietnam
- Languages at home
- 90% English-only · Spanish 5% Arabic 4%
Political lean MEDSL · Noble
- 2024 margin
- Solid R (+51.4) · D 23.5% · R 74.9% · Other 1.5%
- 2008→2024 swing
- -36.0pp toward R · 2008: -15.4pp · 2024: -51.4pp
- All cycles
- 2024: R+51.4 2020: R+49.7 2016: R+49.1 2012: R+33.6 2008: R+15.4
Not yet ingested
- Civics
- —
Market trends
- HPI YoY
- ▼ -36.00%
- Current HPI
- 245.3292
- Rent YoY
- —
- Metro
- —
- State GDP YoY
- ▲ 2.90%
- F500 in state
- 18
Industry mix (Fortune 500 HQ in IN)
| Industry | F500 HQs | Revenue |
|---|---|---|
| Industrial Machinery | 2 | $37B |
|
||
| Healthcare | 1 | $177B |
|
||
| Pharmaceuticals | 1 | $45B |
|
||
| Metals / Steel | 1 | $18B |
|
||
| Agriculture | 1 | $17B |
|
||
| Packaging | 1 | $12B |
|
||
Price history
-9.9% since first listed15 events — show timeline
- 2026-05-19 Pending — IRMLS
- 2026-04-28 Price Changed $90,000 IRMLS
- 2026-03-16 Price Changed $95,000 IRMLS
- 2026-02-23 Price Changed $97,000 IRMLS
- 2026-01-19 Listed $100,000 IRMLS
- 2025-11-14 Price Changed $100,000 IRMLS
- 2025-08-11 Price Changed $110,000 IRMLS
- 2025-07-18 Listed $120,000 IRMLS
- 2024-02-08 Price Changed $89,900 IRMLS
- 2023-12-31 Relisted — IRMLS
- 2023-11-19 Price Changed $91,900 IRMLS
- 2023-09-28 Price Changed $96,900 IRMLS
- 2023-09-14 Relisted — IRMLS
- 2023-08-17 Contingent — IRMLS
- 2023-07-21 Listed $99,900 IRMLS
Cash-flow waterfall
monthlySold comps — $/sqft
last 12 mo · ≤1 miLoading sold comps…