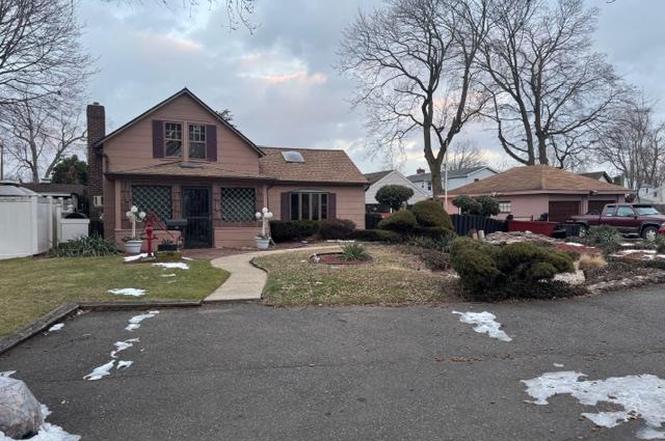
11 Hatcher Ct · North Amityville, NY
Flood risk 1/10 · Minimal
- FEMA flood zone
- X (unshaded)
- Chance of flooding over 30 yrs
- 0.0%
- Est. flood insurance / yr
- $473 – $860
Fire risk 1/10 · Minimal
- Est. fire insurance / yr
- $691 – $1,283
Heat risk 6/10 · Moderate
- Hot days now (above 94°F)
- 7 days/yr
- Hot days in 30 yrs
- 17 days/yr
Wind risk 6/10 · Moderate
- Chance of severe wind over 30 yrs
- 59.0%
Air-quality risk 4/10 · Minor
- Unhealthy air days now
- 5 days/yr
- Unhealthy air days in 30 yrs
- 7 days/yr
Risk factors via First Street. Map © Google.
Why this score? — see what drove the C+ grade
The composite is a weighted blend of 9 inputs, each scored 0–100. Each bar is that input's sub-score; the figure is the points it added to the 100-point composite (weight × sub-score).
- Cash flow +24.6/30.0
- ARV discount +15.0/15.0
- DSCR +8.0/10.0
- 1% rule +5.4/10.0
- Livability +3.2/5.0
- Rent growth +2.5/5.0
- Condition / age +2.5/5.0
- Schools +2.4/10.0
- Appreciation +0.0/10.0
$399,999
🖨 Deal sheet 📄 Offer letter ✓ Due diligence
Listing remarks
Located on a quiet cul-de-sac, 11 Hatcher Ct offers a blend of comfort and convenience. This home features a practical layout with great potential, set in a convenient location close to shopping, dining, and transportation. The home requires some updating and is perfect for buyers ready to bring their ideas and creativity.
Key facts
- 0.38 acre lot
- 2 garage spots
- Built 1927
Neighborhood map
What this means for you Summary
Snapshot
- This is a 4-bed/1.0-bath single-family listed at $400k.
Deal economics
- At list price, monthly cash flow is $829 ($10k/yr) — positive.
- The deal already cash-flows at list — no discount required.
- Meets the 1% rule at list price ($4k rent vs $400k).
- Cap rate 8.8% vs local median 3.8% in North Amityville — top-decile yield for the area; either an underpriced asset or a hidden risk that comps aren't pricing in. Stress-test before assuming the spread holds.
Location & tenants
- Location reads 64/100 on livability (#770 in NY) — a middle-class / working-renter tenant base. Strengths: employment A+, housing A+, commute B; Watch: crime C-, amenities F, cost of living F.
- Amityville Union Free School District (suburban): math 23% / reading 28% proficiency, ranked #579 of 590 in NY (top 98%) — low school quality limits family demand, transient renter base, plan for 1-2y turnover; 62% free/reduced lunch — lower-income household profile, screen leases tightly.
- Zoned schools: Northwest Elementary School (564 students, 62% FRL); Edmund W Miles Middle School (math 10% / reading 30%, grade F, #666 of 729 statewide, top 93%, 599 students, 75% FRL); Amityville Memorial High School (math 68% / reading 34%, grade D+, #969 of 1,100 statewide, top 88%, 968 students, 70% FRL).
- Market conditions: 123 active listings in the ZIP; 3 comparable units currently listed for rent nearby; rentals at typical pace (median 19d on market — plan ~3-4 weeks tenant-placement turnaround); high-income renter base; 1,366 units permitted in Suffolk County in 2024 (216 in 5+ unit buildings).
- This rent runs 43% of the median local income ($117k/yr) — at the standard rent-burdened threshold; future hikes will face affordability resistance.
Forward outlook
- Local home prices are declining (-3.0%/yr); year-one equity from $3k of loan paydown is wiped out by about $12k of value loss. Plan a longer hold.
- Suffolk County population projected to shrink 5% by 2050 — rents likely to lag national; underwrite the cash flow, not the appreciation.
Negotiation context
- Only 11 days on market — expect competitive offers; lowballing is unlikely to land.
Risks & watch-outs
- Watch-outs: built in 1927 — expect roof / HVAC / electrical / plumbing capex.
- Climate carrying-cost: major wind risk, 59% chance of damaging wind over 30y; extreme-heat days projected 7→17/yr by 2055 (HVAC capex compounding) — expect insurance premiums to compound above CPI over the hold.
Questions for the listing agent
- Built in 1927 — when were the roof, HVAC, electrical panel, plumbing, and water heater last replaced?
- Is there a deadline driving the sale (1031 exchange, divorce, estate, relocation)? That informs how much negotiation room exists.
- Schools are D-rated, which usually means shorter tenancies and higher turnover. Who's the typical renter profile here, and what's been the actual vacancy rate?
- What's the average days-on-market for RENTAL listings here right now (not sales)? A rising rental-DOM trend means longer vacancies and softer asking-rent achievability than the comps imply.
- What's the recent tenant-quality profile in this submarket — average credit score on applications, eviction rate, late-payment / NSF rate, and stable-employment percentage? A property-management company in the area should have these aggregated.
- How much new for-sale + rental construction is in the pipeline within 1–3 miles? Heavy new supply typically softens prices + rents 12–24 months out; constrained supply supports both.
Investment metrics
- 1% rule
- 1.04% ✓
- Cap rate
- 8.78%
- Cash-on-cash
- 8.89%
- DSCR
- 1.40
- GRM
- 8.0
CMA / ARV
- ARV (on-the-fly)
- $586,957
- Comps found
- 12
Show comp detail 12 sales within ~0.75 mi
| Address | Dist | Beds/Ba | Sqft | Sold | Price | $/sf | Match |
|---|---|---|---|---|---|---|---|
| 29 Coolidge Ave | 0.11mi | 3/1.0 (-1) | 1,190 (+1%) | 6mo | $409,000 | $344 | 84 |
| 22 Francine Dr N | 0.51mi | 4/3.0 | 1,160 (-2%) | 1mo | $673,000 | $580 | 65 |
| 16 Joyce Ave | 0.40mi | 3/2.0 (-1) | 1,138 (-4%) | 3mo | $629,000 | $553 | 64 |
| 6 Ford Dr W | 0.59mi | 4/1.0 | 1,142 (-3%) | 6mo | $565,000 | $495 | 62 |
| 27 Francine Dr N | 0.59mi | 4/1.0 | 1,162 (-2%) | 10mo | $560,000 | $482 | 61 |
| 85 Williams Ave | 0.45mi | 3/2.0 (-1) | 1,100 (-7%) | 6mo | $598,000 | $544 | 53 |
| 33 Ford Dr S | 0.55mi | 3/1.0 (-1) | 1,304 (+10%) | 0mo | $715,000 | $548 | 52 |
| 283 Washington Ave | 0.47mi | 3/2.0 (-1) | 1,347 (+14%) | 2mo | $450,000 | $334 | 44 |
| 60 Overland Ave | 0.70mi | 3/2.0 (-1) | 1,232 (+4%) | 8mo | $520,000 | $422 | 44 |
| 46 Ford Dr W | 0.62mi | 3/2.0 (-1) | 1,322 (+12%) | 1mo | $640,000 | $484 | 41 |
| 16 Ford Dr W | 0.59mi | 3/2.0 (-1) | 1,053 (-11%) | 10mo | $640,000 | $608 | 37 |
| 1 Somerset Rd W | 0.60mi | 3/2.0 (-1) | 1,007 (-15%) | 8mo | $500,000 | $497 | 32 |
Match score weights: distance 35% · size 25% · config 20% · recency 20%. Top-matched comps best support the ARV.
Projected returns pro-forma
-3.0% appreciation · 3.0% rent growth · sell at horizon
- IRR
- -2.9%
- Equity multiple
- 0.89×
- Total profit
- $-12,120
- Equity at exit
- $59,641
- IRR
- 6.8%
- Equity multiple
- 1.51×
- Total profit
- $56,938
- Equity at exit
- $34,585
Cash invested: $112,000 (down + closing). Projections, not guarantees.
Landlord ↔ Tenant lean methodology
- Overall (STATE)
- 15 Strongly Tenant-Friendly
- State New York
- 15 Strongly Tenant-Friendly · D+10
- County
- — inherits STATE
- City
- — inherits STATE
ZIP-level market 11701
- Active inventory
- 123
- Price-to-rent
- 8.0×
Monthly cashflow live
- Estimated rent
- $4,150 medium interval (Pro) →
- Mortgage (P&I)
- −$2,098
- Tax from tax record
- −$185 /mo · $2,215/yr
- Insurance
- −$167
- HOA
- −$0
- Vacancy / Maint / Mgmt
- −$871
- Net cashflow
- $829
Break-even live
UW: 25.0% down · 7.5% · 30yr · 1.5% tax · 5.0% vac · 8.0% maint · 8.0% mgmt
Financing live
Cash to close
- Down payment
- $100,000
- Closing costs
- $12,000
- Reserves months
- —
- Total cash needed
- —
Loan-product check · same deal, 3 products live
Conventional
25% down · 7.5% · 30yr
- Down + closing
- —
- Monthly P&I
- —
- Monthly cashflow
- —
- DSCR
- —
- Eligible?
- —
Personal DTI + credit; lowest rate.
DSCR
20% down · 8.5% · 30yr
- Down + closing
- —
- Monthly P&I
- —
- Monthly cashflow
- —
- DSCR
- —
- Eligible?
- —
No personal income docs; deal must DSCR.
Hard money
10% down · 12.0% · 12mo
- Down + closing
- —
- Monthly P&I
- —
- Monthly cashflow
- —
- DSCR
- —
- Eligible?
- —
Short-term bridge; refi at stabilization.
Rent comps 3 comps
| Address | Beds | Baths | Sqft | Rent | $/sqft | DOM | Units | Dist |
|---|---|---|---|---|---|---|---|---|
| 366 Broadway Amityville, NY | 3.0 | 1.0–2.5 | 1354 | $5,070 | $3.74 | 1d | 1 | 0.65mi |
| 158 Oldfield Ave Amityville, NY | 3.0 | 2.0 | 1200 | $3,100 | $2.58 | 18d | 1 | 1.17mi |
| 71 Carmans Rd Farmingdale, NY | 4.0 | 2.0 | 1365 | $3,700 | $2.71 | 44d | 1 | 1.38mi |
Listing history 3 events
-
2026-02-27status Pending
-
2026-01-10$399,999 Active
-
2026-01-03historical $399,999
ⓘ Source: listings_history table (triggers on properties + properties_extension) + one-shot
backfill from property_details.listing_events for pre-trigger history.
Tax reassessment forecast NY · Partial reset (capped growth)
- Current annual tax
- $2,215 · $185/mo
- Projected year-2 tax
- $4,487 · $374/mo
- Expected delta
- +$2,273/yr (+$189/mo · 102.6%)
ⓘ Screening estimate from a state-policy table — verify with the county assessor before closing.
Climate risk First Street
- Flood 1/10 Low FEMA zone X (unshaded) · 0% chance over 30 yrs
- Wildfire 1/10 Low
- Heat 6/10 Major 7 d/yr ≥94°F today · 17 d/yr by 30 yrs out
- Wind 6/10 Major 59% chance of damaging wind over 30 yrs
- Air quality 4/10 Moderate 5 unhealthy d/yr today · 7 by 30 yrs out
Nearby sold comps map
Loading sold comps map…
Walkable amenities ~0.75 mi
Loading nearby amenities…
Taxation est. · year 1
- Rental income
- $49,797
- − Mortgage interest
- −$22,406
- − Property taxes
- −$2,215
- − Insurance
- −$2,000
- − Repairs & maintenance
- −$3,984
- − Management
- −$3,984
- − Depreciation
- −$11,636
- Taxable income
- $3,572
- Est. tax owed @ 24.0%
- −$857
- After-tax cash flow
- $9,096/yr
For passive investors: Depreciation is non-cash, so a rental often shows a tax loss while cash-flowing — sheltering income. Rental losses are passive: they offset passive income freely, and up to $25,000/yr can offset ordinary (W-2) income if you actively participate and your MAGI is under $100k (phasing out to $0 by $150k); unused losses carry forward. On sale, claimed depreciation is recaptured at up to 25%, and gains may owe capital-gains tax (a 1031 exchange can defer both). Figures are a year-1 estimate at your 24.0% rate — not tax advice; consult a CPA.
Schools (NCES district)
- District
- Amityville Union Free School District
- NCES district ID
- 3602940
- Math proficiency
- 23% ▼ -12.00%
- Reading proficiency
- 28% ▼ -14.00%
- Median HH income
- $70,995
- Composite
- 24.47/100
- National rank
- #7663
- State rank
- #579 of 590 in NY
Livability — North Amityville
- Score
- 64/100
- State rank
- #770
- US rank
- #14746
Category grades
Schools grade is shown separately in the Schools card above.
Census & demographics
- Census place
- North Amityville, NY
- County
- Suffolk County · 679,920 people
- Metro
- New York-Newark-Jersey City, NY-NJ-PA
- Population (ZIP)
- 29,509
- Household income
- $117,033
- Rent vs Own
- Severe rent burden
- 959.0
Population outlook (Suffolk County) Hauer SSP2
- Today (2025)
- 1,505,262 people
- By 2030
- 1,498,318 · -0.5%
- By 2040
- 1,471,101 · -2.3%
- By 2050
- 1,424,848 · -5.3%
- By 2075
- 1,337,157 · -11.2%
- By 2100
- 1,217,720 · -19.1%
Race, ethnicity, and origin ACS 2023
- Neighborhood character
- Highly diverse neighborhood (Simpson 0.70)
- Race & ethnicity
- White 37% Black 28% Hispanic / Latino 28% Two or more races 12% Asian 2%
- Hispanic origin (detail)
- Puerto Rican 2% Dominican 3%
- Common ancestry
- Hispanic 4% Romanian 2% Slovak 1%
- Foreign-born
- 24% · Canada, Jamaica, China
- Languages at home
- 71% English-only · Spanish 20% French/Haitian/Cajun 3% Other Indo-European 3%
Political lean MEDSL · Suffolk
- 2024 margin
- Lean R (+10.0) · D 45.0% · R 55.0%
- 2008→2024 swing
- -16.0pp toward R · 2008: 6.0pp · 2024: -10.0pp
- All cycles
- 2024: R+10.0 2020: R+0.0 2016: R+8.2 2012: D+2.9 2008: D+6.0
Not yet ingested
- Civics
- —
Market trends
- HPI YoY
- ▼ -345.15%
- Current HPI
- 306.4465
- Rent YoY
- —
- Metro
- New York-Newark-Jersey City, NY-NJ-PA
- State GDP YoY
- ▲ 2.60%
- F500 in state
- 92
Industry mix (Fortune 500 HQ in NY)
| Industry | F500 HQs | Revenue |
|---|---|---|
| Financial Services | 10 | $950B |
|
||
| Consumer Goods | 9 | $162B |
|
||
| Insurance | 4 | $225B |
|
||
| Telecommunications | 2 | $144B |
|
||
| Pharmaceuticals | 2 | $112B |
|
||
| Media / Entertainment | 2 | $69B |
|
||
Price history
+0.0% since first listed3 events — show timeline
- 2026-02-27 Pending — OneKey® MLS as Distributed by MLS Grid
- 2026-01-10 Listed $399,999 OneKey® MLS as Distributed by MLS Grid
- 2026-01-03 Coming Soon $399,999 OneKey® MLS as Distributed by MLS Grid
Property tax history
+2.4%/yrLatest (2025): $2,215 · +0.0% YoY. Source: county tax records.
Cash-flow waterfall
monthlySold comps — $/sqft
last 12 mo · ≤1 miLoading sold comps…