49B Wickliffe St · Newark, NJ
Flood risk 6/10 · Moderate
- FEMA flood zone
- X (unshaded)
- Chance of flooding over 30 yrs
- 0.54%
- Est. flood insurance / yr
- $507 – $1,088
Fire risk 1/10 · Minimal
- Est. fire insurance / yr
- $526 – $976
Heat risk 7/10 · Major
- Hot days now (above 99°F)
- 7 days/yr
- Hot days in 30 yrs
- 15 days/yr
Wind risk 6/10 · Moderate
- Chance of severe wind over 30 yrs
- 27.0%
Air-quality risk 4/10 · Minor
- Unhealthy air days now
- 4 days/yr
- Unhealthy air days in 30 yrs
- 5 days/yr
Risk factors via First Street. Map © Google.
Why this score? — see what drove the C- grade
The composite is a weighted blend of 9 inputs, each scored 0–100. Each bar is that input's sub-score; the figure is the points it added to the 100-point composite (weight × sub-score).
- Cash flow +20.0/30.0
- ARV discount +7.5/15.0
- DSCR +6.4/10.0
- 1% rule +5.4/10.0
- Appreciation +5.0/10.0
- Livability +3.4/5.0
- Rent growth +2.5/5.0
- Condition / age +2.5/5.0
- Schools +1.4/10.0
$265,000
🖨 Deal sheet 📄 Offer letter ✓ Due diligence
Listing remarks
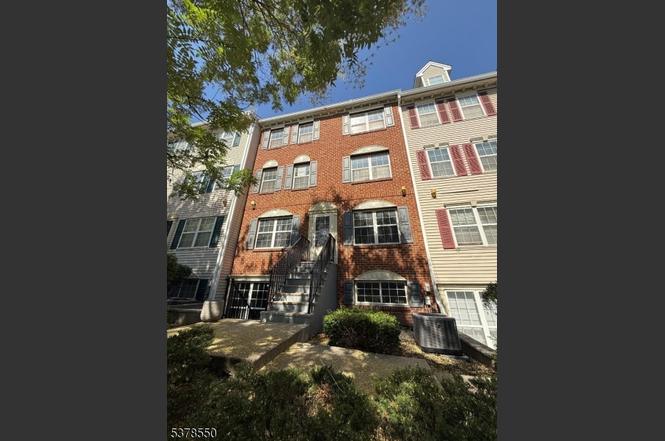
Location Location! This Duplex condominium is waiting for your finishing touches! Located on a desirable block in Newark, NJ, close to schools and transportation, this Duplex style condo offers 2 BR 1BA with a spacious Living room/Dining room! Perfect starter condo or investment property for cash flows! Bring your vision to life! The property being marketed may be subject to a 3 day First Look Period. REO Management Solutions, LLC and our clients employ the initiative to preserve and promote neighborhood values. upon the expiration of the First Look Period seller will negotiate offers, giving preference to "owner occupants, public entities, or a designated partner of a public entitiy.
Key facts
- Close to schools
- Duplex condominium
- Spacious living room
Tags
Property features AI
Finance
- HOA & community: Pet policy: call
Exterior
- Parking: On-street parking
- Utilities: All utilities underground; Natural gas available (gas in street); Public water; Public sewer
- Home design: Duplex, multi-floor unit
- Construction: Brick siding; Approximate year built
- Exterior features: Curbs and sidewalk; Level lot
Interior
- Kitchen: Galley-style kitchen (not eat-in); Range/oven (gas); Refrigerator
- Bedrooms: Two bedrooms on the second floor
- Flooring: Carpeting
- Bathrooms: One full bathroom
- Heating & cooling: Gas-fired heating (single unit); Central air conditioning (single unit)
- Interior features: Carbon monoxide detector; Range/oven (gas); Refrigerator
- Laundry & utility: Second-floor laundry room
Neighborhood map
What this means for you Summary
Snapshot
- This is a 2-bed/1.0-bath condo listed at $265k.
Deal economics
- At list price, monthly cash flow is $327 ($4k/yr) — positive.
- The deal already cash-flows at list — no discount required.
- Meets the 1% rule at list price ($3k rent vs $265k).
- Recommended offer: $241k (9.0% below list) — sets the bar for market timing.
- Cap rate 7.8% vs local median 3.0% in Newark — top-decile yield for the area; either an underpriced asset or a hidden risk that comps aren't pricing in. Stress-test before assuming the spread holds.
Location & tenants
- Location reads 67/100 on livability (#343 in NJ) — a middle-class / working-renter tenant base. Strengths: commute A+, amenities A-; Watch: schools D+, housing D+, crime F.
- Newark Public School District (urban): math 9% / reading 26% proficiency, ranked #452 of 472 in NJ (top 96%) — low school quality limits family demand, transient renter base, plan for 1-2y turnover; 79% free/reduced lunch — lower-income household profile, screen leases tightly.
- Market conditions: 2 active listings in the ZIP; 40 comparable units currently listed for rent nearby; rentals at typical pace (median 17d on market — plan ~3-4 weeks tenant-placement turnaround); 3,364 units permitted in Essex County in 2024 (2,551 in 5+ unit buildings).
Forward outlook
- In year one you build about $10k of equity ($2k loan paydown + $8k appreciation (3.0% local appreciation)).
- Essex County population projected at +3% by 2050 — modest demand growth; plan on rents tracking national, not racing it.
- At projected returns (3.0% appreciation + 3.0% rent growth), your $74k cash investment doubles in ~5 years — after that, you're playing with house money.
- By year 4, paydown + projected appreciation supports a ~$33k cash-out refi (75% LTV) — recoverable capital for the next deal without selling this one.
Negotiation context
- It's been on market 97 days — a 9% lower offer ($241k) is reasonable based on typical stale-listing flexibility.
- 3 sale attempts with the ask held roughly flat each time — persistent listings suggest the price (not the market) is what's stuck; bring a comps-based counter.
- Current owner paid $64k; list at $265k implies a 316% gain — meaningful room to come down on a strong offer.
Risks & watch-outs
- Climate carrying-cost: major flood risk; major wind risk, 27% chance of damaging wind over 30y; extreme-heat days projected 7→15/yr by 2055 (HVAC capex compounding) — expect insurance premiums to compound above CPI over the hold.
Questions for the listing agent
- It's been on market 97 days. Have you received any prior offers? Is the seller open to a 9% concession, seller financing, or rate buy-down credit?
- Any open or pending special assessments — roof, HVAC, plumbing, elevator, façade? What's the per-unit balance and payoff schedule, and is the seller paying it off at close or rolling it to the buyer?
- Why hasn't it sold? Are there any deal-killer items the seller is aware of (foundation, flood, title, zoning, code violations)?
- Is there a deadline driving the sale (1031 exchange, divorce, estate, relocation)? That informs how much negotiation room exists.
- Schools are D-rated, which usually means shorter tenancies and higher turnover. Who's the typical renter profile here, and what's been the actual vacancy rate?
- Crime grade is F in this area — have there been break-ins, vandalism, or insurance claims at this property in the last 3 years? What carrier currently insures it and at what premium?
- What's the average days-on-market for RENTAL listings here right now (not sales)? A rising rental-DOM trend means longer vacancies and softer asking-rent achievability than the comps imply.
- What's the recent tenant-quality profile in this submarket — average credit score on applications, eviction rate, late-payment / NSF rate, and stable-employment percentage? A property-management company in the area should have these aggregated.
- How much new apartment / multifamily construction is in the pipeline within 1–3 miles? Heavy new supply (>2% of stock underway) typically softens rents 12–24 months out; light construction supports rent growth.
Investment metrics
- 1% rule
- 1.04% ✓
- Cap rate
- 7.77%
- Cash-on-cash
- 5.29%
- DSCR
- 1.24
- GRM
- 8.0
CMA / ARV
No comps found within radius.
Projected returns pro-forma
3.0% appreciation · 3.0% rent growth · sell at horizon
- IRR
- 12.5%
- Equity multiple
- 1.71×
- Total profit
- $52,822
- Equity at exit
- $119,155
- IRR
- 14.5%
- Equity multiple
- 3.14×
- Total profit
- $158,959
- Equity at exit
- $183,633
Cash invested: $74,200 (down + closing). Projections, not guarantees.
Landlord ↔ Tenant lean methodology
- Overall (CITY)
- 0 Strongly Tenant-Friendly
- State New Jersey
- 21 Tenant-Leaning · D+6
- County
- — inherits STATE
- City Newark
- 0 Strongly Tenant-Friendly · D+59
ZIP-level market 07103-3500
- Active inventory
- 2
- Price-to-rent
- 8.0×
Monthly cashflow live
- Estimated rent
- $2,769 high interval (Pro) →
- Mortgage (P&I)
- −$1,390
- Tax from tax record
- −$360 /mo · $4,319/yr
- Insurance
- −$110
- HOA
- −$0
- Vacancy / Maint / Mgmt
- −$581
- Net cashflow
- $327
Break-even live
UW: 25.0% down · 7.5% · 30yr · 1.5% tax · 5.0% vac · 8.0% maint · 8.0% mgmt
Financing live
Cash to close
- Down payment
- $66,250
- Closing costs
- $7,950
- Reserves months
- —
- Total cash needed
- —
Loan-product check · same deal, 3 products live
Conventional
25% down · 7.5% · 30yr
- Down + closing
- —
- Monthly P&I
- —
- Monthly cashflow
- —
- DSCR
- —
- Eligible?
- —
Personal DTI + credit; lowest rate.
DSCR
20% down · 8.5% · 30yr
- Down + closing
- —
- Monthly P&I
- —
- Monthly cashflow
- —
- DSCR
- —
- Eligible?
- —
No personal income docs; deal must DSCR.
Hard money
10% down · 12.0% · 12mo
- Down + closing
- —
- Monthly P&I
- —
- Monthly cashflow
- —
- DSCR
- —
- Eligible?
- —
Short-term bridge; refi at stabilization.
Rent comps 40 comps
| Address | Beds | Baths | Sqft | Rent | $/sqft | DOM | Units | Dist |
|---|---|---|---|---|---|---|---|---|
| 3 Ashby Ln Newark, NJ | 3.0 | 2.0 | 1350 | $4,200 | $3.11 | 24d | 1 | 0.12mi |
| 24 Jones St Newark, NJ | 1.0 | 1.0 | 818 | $2,206 | $2.70 | 24d | 3 | 0.34mi |
| 332 New St Newark, NJ | 1.0 | 1.0 | 700 | $1,500 | $2.14 | 24d | 1 | 0.35mi |
| 50 Sussex Ave Newark, NJ | 2.0 | 1.0–2.0 | 730 | $3,500 | $4.79 | 16d | 1 | 0.41mi |
| 379 New St Newark, NJ | 2.0 | 1.0 | 861 | $2,200 | $2.56 | 24d | 1 | 0.46mi |
| 58 Norfolk St Newark, NJ | 1.0–2.0 | 1.0–2.0 | 712 | $2,800 | $3.93 | 1d | 21 | 0.48mi |
| 50 Norfolk St Newark, NJ | 1.0–2.0 | 1.0–2.0 | 905 | $2,600 | $2.87 | 1d | 2 | 0.48mi |
| 303 Washington St Newark, NJ | 1.0 | 1.0 | 850 | $2,500 | $2.94 | 4d | 1 | 0.50mi |
| 155 Washington St Newark, NJ | 3.0 | 1.0–2.0 | 666 | $3,121 | $4.69 | 1d | 16 | 0.51mi |
| 14 Summit St Unit Main Newark, NJ | 3.0 | 2.0 | 1500 | $3,051 | $2.03 | 17d | 1 | 0.51mi |
| 144 Washington St Unit A Newark, NJ | 3.0 | 1.0 | 1100 | $3,050 | $2.77 | 24d | 1 | 0.54mi |
| 121 Arlington St Newark, NJ | 2.0 | 2.5 | 1400 | $3,000 | $2.14 | 24d | 1 | 0.54mi |
| 45 William St Newark, NJ | 2.0 | 1.0–2.0 | 792 | $3,100 | $3.91 | 10d | 4 | 0.54mi |
| 17 Livingston St Newark, NJ | 1.0 | 1.0 | 795 | $2,195 | $2.76 | 21d | 2 | 0.55mi |
| 44 Irvine Turner Blvd Newark, NJ | 2.0 | 1.0–2.0 | 800 | $2,900 | $3.62 | 3d | 16 | 0.56mi |
| 19 Livingston St Unit 2-2 Newark, NJ | 2.0 | 2.0 | 1100 | $2,550 | $2.32 | 24d | 1 | 0.56mi |
| 19 Livingston St Unit 1 Newark, NJ | 1.0 | 1.0 | 750 | $2,195 | $2.93 | 24d | 1 | 0.56mi |
| 91 Halsey St Newark, NJ | 2.0 | 1.0 | 1072 | $2,650 | $2.47 | 1d | 2 | 0.57mi |
| 254 Orange St Newark, NJ | 1.0–3.0 | 1.0–2.0 | 683 | $2,574 | $3.77 | 2d | 15 | 0.59mi |
| 81 Halsey St Newark, NJ | 2.0 | 1.0 | 700 | $2,500 | $3.57 | 20d | 1 | 0.59mi |
| 64 1st St Unit 3 Newark, NJ | 3.0 | 1.5 | 999 | $2,500 | $2.50 | 24d | 1 | 0.62mi |
| 289 Halsey St Newark, NJ | 1.0–2.0 | 1.0 | 768 | $2,454 | $3.19 | 2d | 2 | 0.63mi |
| 270 Hunterdon St Unit 1 Newark, NJ | 3.0 | 2.0 | 1050 | $2,600 | $2.48 | 7d | 1 | 0.63mi |
| 15 William St Newark, NJ | 1.0 | 1.0 | 747 | $2,325 | $3.11 | 1d | 3 | 0.64mi |
| 7 Hudson St Unit 2 Newark, NJ | 3.0 | 1.0 | 1400 | $2,500 | $1.79 | 21d | 1 | 0.66mi |
| 6 Hecker St Unit A Newark, NJ | 3.0 | 1.0 | 1296 | $2,550 | $1.97 | 17d | 1 | 0.68mi |
| 605-607 Broad St Unit 304 Newark, NJ | 1.0 | 1.0 | 750 | $2,000 | $2.67 | 2d | 1 | 0.69mi |
| 605 Broad St Newark, NJ | 1.0 | 1.0 | 650 | $2,050 | $3.15 | 1d | 2 | 0.70mi |
| 11 Clinton St Newark, NJ | 1.0–2.0 | 1.0 | 874 | $2,500 | $2.86 | 1d | 9 | 0.70mi |
| 605 Broad St Newark, NJ | 1.0 | 1.0 | 650 | $2,050 | $3.15 | 7d | 1 | 0.70mi |
| 1180 Raymond Blvd Newark, NJ | 1.0 | 1.0–2.0 | 767 | $2,520 | $3.28 | 1d | 11 | 0.70mi |
| 10 Central Ave Newark, NJ | 2.0 | 1.0–2.0 | 1010 | $3,275 | $3.24 | 3d | 20 | 0.71mi |
| 10 Central Ave Newark, NJ | 1.0 | 1.0 | 750 | $2,300 | $3.07 | 24d | 1 | 0.71mi |
| 10 Commerce Ct Newark, NJ | 1.0–2.0 | 1.0 | 750 | $2,957 | $3.94 | 6d | 48 | 0.73mi |
| 111 Mulberry St Unit 7th Floor Newark, NJ | 2.0 | 1.0 | 1000 | $2,500 | $2.50 | 24d | 1 | 0.77mi |
| 2 Center St Newark, NJ | 2.0 | 1.0–2.0 | 903 | $4,051 | $4.48 | 1d | 11 | 0.79mi |
| 294 S 7th St Unit 2 Newark, NJ | 2.0 | 1.0 | 1400 | $2,050 | $1.46 | 10d | 1 | 0.80mi |
| 306 S 6th St Unit 3 Newark, NJ | 3.0 | 2.0 | 1000 | $2,000 | $2.00 | 24d | 1 | 0.80mi |
| 37 S 7th St Unit 3 Newark, NJ | 3.0 | 2.0 | 1343 | $2,850 | $2.12 | 20d | 1 | 0.80mi |
| 175 1st St Newark, NJ | 1.0–2.0 | 1.0 | 869 | $1,050 | $1.21 | 24d | 1 | 0.80mi |
HOA detail condo
- Monthly dues
- $0 · $0/yr
- Assessments
- None detected in remarks — confirm with the listing agent.
Listing history 9 events
-
2026-06-18days on market $265,000 Active 97 DOM
-
2026-06-17days on market $265,000 Active 96 DOM
-
2026-06-16days on market $265,000 Active 95 DOM
-
2026-06-15days on market $265,000 Active 94 DOM
-
2026-06-13days on market $265,000 Active 92 DOM
-
2026-06-13days on market $265,000 Active 91 DOM
-
2026-06-09days on market $265,000 Active 88 DOM
-
2026-06-08remarks 694-char remark
-
2026-06-08$265,000 Active 87 DOM
ⓘ Source: listings_history table (triggers on properties + properties_extension) + one-shot
backfill from property_details.listing_events for pre-trigger history.
Tax reassessment forecast NJ · Partial reset (capped growth)
- Current annual tax
- $4,319 · $360/mo
- Projected year-2 tax
- $5,459 · $455/mo
- Expected delta
- +$1,140/yr (+$95/mo · 26.4%)
ⓘ Screening estimate from a state-policy table — verify with the county assessor before closing.
Climate risk First Street
- Flood 6/10 Major FEMA zone X (unshaded) · 54% chance over 30 yrs
- Wildfire 1/10 Low
- Heat 7/10 Severe 7 d/yr ≥99°F today · 15 d/yr by 30 yrs out
- Wind 6/10 Major 27% chance of damaging wind over 30 yrs
- Air quality 4/10 Moderate 4 unhealthy d/yr today · 5 by 30 yrs out
Nearby sold comps map
Loading sold comps map…
Walkable amenities ~0.75 mi
Loading nearby amenities…
Taxation est. · year 1
- Rental income
- $33,224
- − Mortgage interest
- −$14,844
- − Property taxes
- −$4,319
- − Insurance
- −$1,325
- − Repairs & maintenance
- −$2,658
- − Management
- −$2,658
- − Depreciation
- −$7,709
- Taxable loss
- −$289
- Est. tax savings @ 24.0%
- +$69
- After-tax cash flow
- $3,996/yr
For passive investors: Depreciation is non-cash, so a rental often shows a tax loss while cash-flowing — sheltering income. Rental losses are passive: they offset passive income freely, and up to $25,000/yr can offset ordinary (W-2) income if you actively participate and your MAGI is under $100k (phasing out to $0 by $150k); unused losses carry forward. On sale, claimed depreciation is recaptured at up to 25%, and gains may owe capital-gains tax (a 1031 exchange can defer both). Figures are a year-1 estimate at your 24.0% rate — not tax advice; consult a CPA.
Schools (NCES district)
- District
- Newark Public School District
- NCES district ID
- 3411340
- Math proficiency
- 9% ▼ -17.00%
- Reading proficiency
- 26% ▼ -10.00%
- Median HH income
- $33,891
- Composite
- 14.24/100
- National rank
- #9449
- State rank
- #452 of 472 in NJ
Livability — Newark
- Score
- 67/100
- State rank
- #343
- US rank
- #11138
Category grades
Schools grade is shown separately in the Schools card above.
Census & demographics
- Census place
- Newark, NJ
Population outlook (Essex County) Hauer SSP2
- Today (2025)
- 825,042 people
- By 2030
- 834,010 · +1.1%
- By 2040
- 846,221 · +2.6%
- By 2050
- 850,047 · +3.0%
- By 2075
- 837,009 · +1.5%
- By 2100
- 784,345 · -4.9%
Not yet ingested
- Political lean
- —
- Race & ethnicity
- —
- Common origin
- —
- Civics
- —
Market trends
- HPI YoY
- —
- Current HPI
- —
- Rent YoY
- —
- Metro
- —
- State GDP YoY
- ▲ 2.05%
- F500 in state
- 34
Industry mix (Fortune 500 HQ in NJ)
| Industry | F500 HQs | Revenue |
|---|---|---|
| Consumer Goods | 3 | $31B |
|
||
| Pharmaceuticals | 2 | $153B |
|
||
| Technology | 2 | $21B |
|
||
| Insurance | 2 | $20B |
|
||
| Healthcare | 2 | $19B |
|
||
| Financial Services | 1 | $70B |
|
||
Price history
+316.0% since first listed6 events — show timeline
- 2026-06-08 Relisted — GSMLS
- 2026-02-27 Pending — GSMLS
- 2026-02-06 Relisted — GSMLS
- 2025-10-20 Pending — GSMLS
- 2025-08-14 Listed $265,000 GSMLS
- 1994-06-06 Sold (Public Records) $63,700 Public Records
Property tax history
+26.6%/yrLatest (2025): $4,319 · +224.5% YoY. Source: county tax records.
Cash-flow waterfall
monthlySold comps — $/sqft
last 12 mo · ≤1 miLoading sold comps…