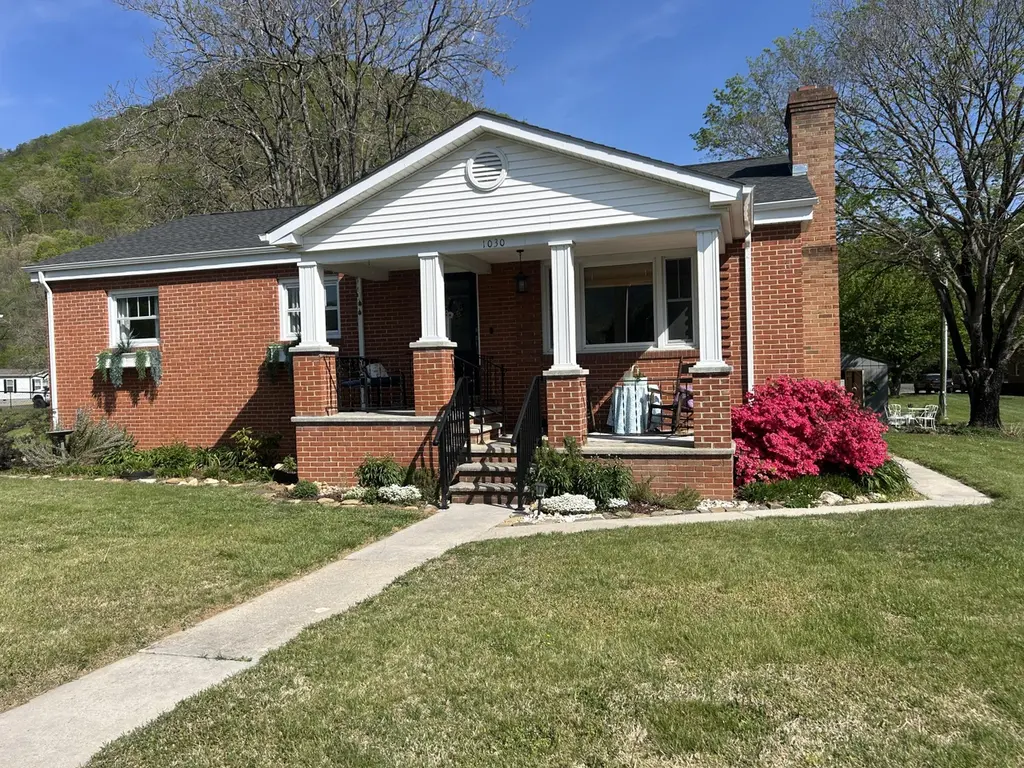
1030 Anderson St · Glasgow, VA
Flood risk No data
- FEMA flood zone
- —
- Chance of flooding over 30 yrs
- —
- Est. flood insurance / yr
- —
Fire risk No data
- Est. fire insurance / yr
- —
Heat risk No data
- Hot days now (above threshold)
- —
- Hot days in 30 yrs
- —
Wind risk No data
- Chance of severe wind over 30 yrs
- —
Air-quality risk No data
- Unhealthy air days now
- —
- Unhealthy air days in 30 yrs
- —
Risk factors via First Street. Map © Google.
Why this score? — see what drove the D grade
The composite is a weighted blend of 9 inputs, each scored 0–100. Each bar is that input's sub-score; the figure is the points it added to the 100-point composite (weight × sub-score).
- Cash flow +17.0/30.0
- Appreciation +6.0/10.0
- DSCR +5.3/10.0
- Schools +4.7/10.0
- 1% rule +3.5/10.0
- Livability +3.0/5.0
- Rent growth +2.5/5.0
- Condition / age +2.5/5.0
- ARV discount +0.0/15.0
$239,000
🖨 Deal sheet (PDF) 📄 Offer letter ✓ Due diligence
Listing remarks
In a world of ''model'' homes, this house is Sally Fields---cute, compact, classy and full of charm. Updated and lovingly restored to highlight all of it's wonderful features, it's a timeless standout. The front porch practically smiles, welcoming you to sit awhile and take in the mountain views or to come on in and surround yourself with comfort. Original, gleaming hardwood floors, a living room with brick fireplace, a spacious and modern kitchen with lovely tilework & butler's pantry, a primary bedroom suite (currently used for a TV/guest room) opening onto a private back porch, dining room w/ wainscotting, a laundry room w/ storage, 2 other good size bedrooms & a big, bold,
Key facts
- Brick fireplace
- Private back porch
- Butler's pantry
Tags
Neighborhood map
What this means for you Summary
Snapshot
- This is a 3-bed/1.0-bath single-family listed at $239k.
Deal economics
- At list price, monthly cash flow is $162 ($2k/yr) — positive.
- The deal already cash-flows at list — no discount required.
- To meet the 1% rule (rent ≥ 1% of price), the offer needs to be $202k (15.4% below list).
- Recommended offer: $202k (15.4% below list) — sets the bar for 1% rule.
Location & tenants
- Location reads 59/100 on livability (#471 in VA) — a working-class tenant base; expect higher turnover. Strengths: crime A+, cost of living A+, housing A+; Watch: health & safety C-, amenities F, commute F.
- Rockbridge County Public School District (town): math 43% / reading 67% proficiency, ranked #80 of 131 in VA (top 61%) — acceptable for families but not a draw, mixed tenant base, ~2y average lease.
- Zoned schools: Natural Bridge Elementary (math 52% / reading 57%, grade C, #650 of 1,108 statewide, top 62%, 221 students, 68% FRL); Maury River Middle (math 38% / reading 63%, grade C, #226 of 342 statewide, top 67%, 502 students, 70% FRL); Rockbridge County High (math 52% / reading 82%, grade B, #185 of 319 statewide, top 61%, 994 students, 66% FRL) — zoned schools average 68% FRL vs 37% district-wide (31 pts higher); higher-poverty schools than district average — tighter screening recommended.
- Market conditions: 14 active listings in the ZIP; 85 units permitted in Rockbridge County in 2024 (0 in 5+ unit buildings).
Forward outlook
- In year one you build about $6k of equity ($2k loan paydown + $5k appreciation (1.9% local appreciation)).
- Rockbridge County population projected at -11% by 2050 — secular population decline; favor cash flow + early exit over multi-decade hold.
- At projected returns (1.9% appreciation + 3.0% rent growth), your $67k cash investment doubles in ~7 years — after that, you're playing with house money.
- By year 6, paydown + projected appreciation supports a ~$34k cash-out refi (75% LTV) — recoverable capital for the next deal without selling this one.
Negotiation context
- Only 7 days on market — expect competitive offers; lowballing is unlikely to land.
Questions for the listing agent
- Built in 1963 — when were the roof, HVAC, electrical panel, plumbing, and water heater last replaced?
- Is there a deadline driving the sale (1031 exchange, divorce, estate, relocation)? That informs how much negotiation room exists.
- Schools are F-rated, which usually means shorter tenancies and higher turnover. Who's the typical renter profile here, and what's been the actual vacancy rate?
- The area grade is low — what's the realistic commute time and amenity access for the typical tenant pool here? Any planned neighborhood developments (good or bad) we should know about?
- What's the average days-on-market for RENTAL listings here right now (not sales)? A rising rental-DOM trend means longer vacancies and softer asking-rent achievability than the comps imply.
- What's the recent tenant-quality profile in this submarket — average credit score on applications, eviction rate, late-payment / NSF rate, and stable-employment percentage? A property-management company in the area should have these aggregated.
- How much new for-sale + rental construction is in the pipeline within 1–3 miles? Heavy new supply typically softens prices + rents 12–24 months out; constrained supply supports both.
Investment metrics
- 1% rule
- 0.85% ✗
- Cap rate
- 7.11%
- Cash-on-cash
- 2.91%
- DSCR
- 1.13
- GRM
- 9.9
CMA / ARV
- ARV (on-the-fly)
- $197,374
- Comps found
- 6
Show comp detail 6 sales within ~0.75 mi
| Address | Dist | Beds/Ba | Sqft | Sold | Price | $/sf | Match |
|---|---|---|---|---|---|---|---|
| 1102 Anderson St | 0.04mi | 3/1.0 | 1,224 (+3%) | 4mo | $203,500 | $166 | 90 |
| 1036 Anderson St | 0.02mi | 3/1.0 | 1,176 (-1%) | 15mo | $157,500 | $134 | 85 |
| 712 Gordon St | 0.42mi | 4/1.0 (+1) | 1,079 (-9%) | 1mo | $115,000 | $107 | 59 |
| 632 Mcculloch St | 0.42mi | 3/1.5 | 1,029 (-14%) | 1mo | $145,000 | $141 | 55 |
| 1451-A Kelvin Grv | 0.30mi | 2/2.0 (-1) | 1,224 (+3%) | 23mo | $210,120 | $172 | 53 |
| 1336 Fitzlee St | 0.40mi | 3/1.0 | 1,040 (-12%) | 9mo | $203,500 | $196 | 53 |
Match score weights: distance 35% · size 25% · config 20% · recency 20%. Top-matched comps best support the ARV.
Projected returns pro-forma
1.9% appreciation · 3.0% rent growth · sell at horizon
- IRR
- 7.1%
- Equity multiple
- 1.38×
- Total profit
- $25,459
- Equity at exit
- $93,046
- IRR
- 10.5%
- Equity multiple
- 2.40×
- Total profit
- $93,701
- Equity at exit
- $133,055
Cash invested: $66,920 (down + closing). Projections, not guarantees.
Landlord ↔ Tenant lean methodology
- Overall (STATE)
- 55 Moderately Landlord-Leaning
- State Virginia
- 55 Moderately Landlord-Leaning · D+2
- County
- — inherits STATE
- City
- — inherits STATE
ZIP-level market 24555
- Home prices YoY
- 1.1%
- Active inventory
- 14
- Price-to-rent
- 9.9×
Monthly cashflow live
- Estimated rent
- $2,022 medium interval (Pro) →
- Mortgage (P&I)
- −$1,253
- Tax from tax record
- −$82 /mo · $986/yr
- Insurance
- −$100
- HOA
- −$0
- Vacancy / Maint / Mgmt
- −$425
- Net cashflow
- $162
Break-even live
Sensitivity live
| Price | -10% $297 | -5% $230 | +0% $162 | +5% $94 | +10% $27 |
|---|---|---|---|---|---|
| Rent | -10% $2 | -5% $82 | +0% $162 | +5% $242 | +10% $322 |
| Rate | -1.0pp $282 | -0.5pp $223 | base $162 | +0.5pp $100 | +1.0pp $37 |
UW: 25.0% down · 7.5% · 30yr · 1.5% tax · 5.0% vac · 8.0% maint · 8.0% mgmt
Financing live
Cash to close
- Down payment
- $59,750
- Closing costs
- $7,170
- Reserves months
- —
- Total cash needed
- —
Loan-product check · same deal, 3 products live
Conventional
25% down · 7.5% · 30yr
- Down + closing
- —
- Monthly P&I
- —
- Monthly cashflow
- —
- DSCR
- —
- Eligible?
- —
Personal DTI + credit; lowest rate.
DSCR
20% down · 8.5% · 30yr
- Down + closing
- —
- Monthly P&I
- —
- Monthly cashflow
- —
- DSCR
- —
- Eligible?
- —
No personal income docs; deal must DSCR.
Hard money
10% down · 12.0% · 12mo
- Down + closing
- —
- Monthly P&I
- —
- Monthly cashflow
- —
- DSCR
- —
- Eligible?
- —
Short-term bridge; refi at stabilization.
Listing history 2 events
-
2026-04-28status Pending
-
2026-04-17$239,000 Active
ⓘ Source: listings_history table (triggers on properties + properties_extension) + one-shot
backfill from property_details.listing_events for pre-trigger history.
Tax reassessment forecast VA · Resets to sale price
- Current annual tax
- $986 · $82/mo
- Projected year-2 tax
- $1,960 · $163/mo
- Expected delta
- +$974/yr (+$81/mo · 98.8%)
ⓘ Screening estimate from a state-policy table — verify with the county assessor before closing.
Nearby sold comps map
Loading sold comps map…
Walkable amenities ~0.75 mi
Loading nearby amenities…
Taxation est. · year 1
- Rental income
- $24,261
- − Mortgage interest
- −$13,388
- − Property taxes
- −$986
- − Insurance
- −$1,195
- − Repairs & maintenance
- −$1,941
- − Management
- −$1,941
- − Depreciation
- −$6,953
- Taxable loss
- −$2,142
- Est. tax savings @ 24.0%
- +$514
- After-tax cash flow
- $2,459/yr
For passive investors: Depreciation is non-cash, so a rental often shows a tax loss while cash-flowing — sheltering income. Rental losses are passive: they offset passive income freely, and up to $25,000/yr can offset ordinary (W-2) income if you actively participate and your MAGI is under $100k (phasing out to $0 by $150k); unused losses carry forward. On sale, claimed depreciation is recaptured at up to 25%, and gains may owe capital-gains tax (a 1031 exchange can defer both). Figures are a year-1 estimate at your 24.0% rate — not tax advice; consult a CPA.
Schools (NCES district)
- District
- Rockbridge County Public School District
- NCES district ID
- 5103370
- Math proficiency
- 43% ▼ -41.00%
- Reading proficiency
- 67% ▼ -12.00%
- Median HH income
- $48,021
- Composite
- 46.65/100
- National rank
- #2408
- State rank
- #80 of 131 in VA
Livability — Glasgow
- Score
- 59/100
- State rank
- #471
- US rank
- #20232
Category grades
Schools grade is shown separately in the Schools card above.
Census & demographics
- Census place
- Glasgow, VA
- Population (ZIP)
- 2,220
Population outlook (Rockbridge County) Hauer SSP2
- Today (2025)
- 22,549 people
- By 2030
- 22,381 · -0.7%
- By 2040
- 21,488 · -4.7%
- By 2050
- 20,054 · -11.1%
- By 2075
- 16,228 · -28.0%
- By 2100
- 11,598 · -48.6%
Race, ethnicity, and origin ACS 2023
- Neighborhood character
- Predominantly White (80%)
- Race & ethnicity
- White 80% Black 13% Two or more races 7%
- Common ancestry
- Serbian 5% Lithuanian 4% Italian 2%
- Foreign-born
- 0% · Canada
- Languages at home
- 96% English-only · Spanish 4%
Political lean MEDSL · Rockbridge
- 2024 margin
- Solid R (+33.8) · D 32.6% · R 66.4%
- 2008→2024 swing
- -20.2pp toward R · 2008: -13.6pp · 2024: -33.8pp
- All cycles
- 2024: R+33.8 2020: R+32.4 2016: R+29.6 2012: R+17.8 2008: R+13.6
Not yet ingested
- Civics
- —
Market trends
- HPI YoY
- ▲ 1.90%
- Current HPI
- 176.4084
- Rent YoY
- —
- Metro
- —
- State GDP YoY
- ▲ 2.40%
- F500 in state
- 50
Industry mix (Fortune 500 HQ in VA)
| Industry | F500 HQs | Revenue |
|---|---|---|
| Aerospace / Defense | 4 | $236B |
|
||
| Technology / Defense | 3 | $32B |
|
||
| Financial Services | 2 | $176B |
|
||
| Utilities | 2 | $27B |
|
||
| Insurance | 2 | $25B |
|
||
| Technology | 2 | $15B |
|
||
Price history
2 events — show timeline
- 2026-04-28 Pending — RHR
- 2026-04-17 Listed $239,000 RHR
Property tax history
+3.0%/yrLatest (2025): $986 · +26.5% YoY. Source: county tax records.
Cash-flow waterfall
monthlySold comps — $/sqft
last 12 mo · ≤1 miLoading sold comps…