 Multi-family
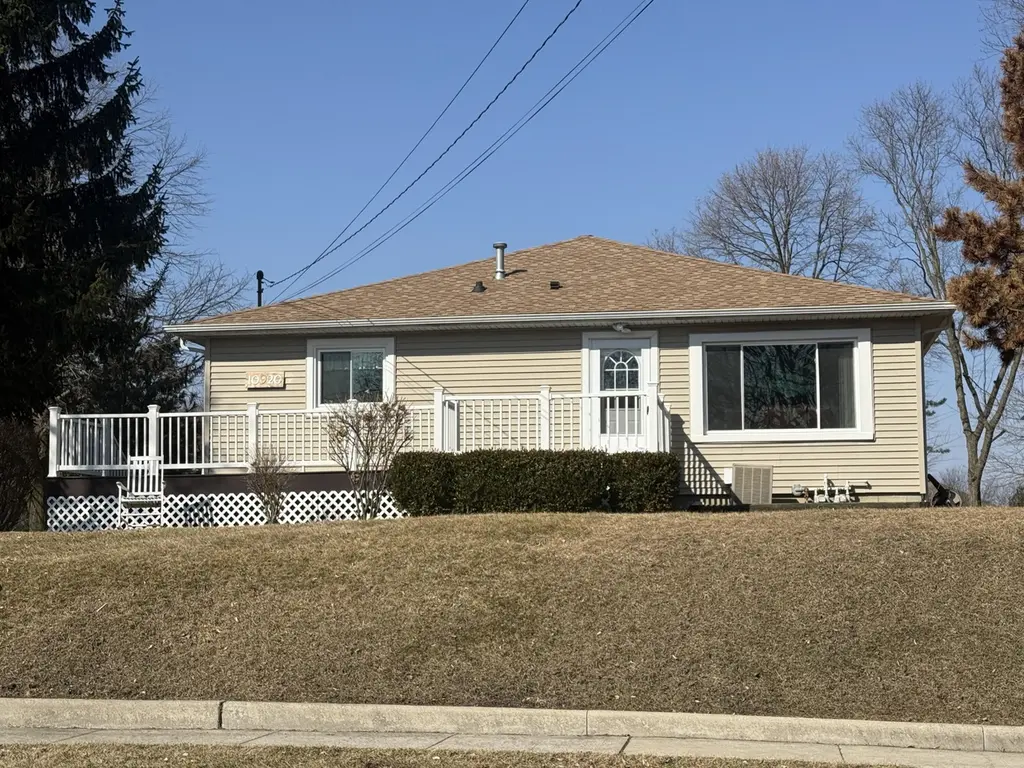
10920 Thielen St · St. John, IN
Flood risk 1/10 · Minimal
- FEMA flood zone
- X (unshaded)
- Chance of flooding over 30 yrs
- 0.0%
- Est. flood insurance / yr
- $473 – $860
Fire risk 1/10 · Minimal
- Est. fire insurance / yr
- $717 – $1,331
Heat risk 2/10 · Minimal
- Hot days now (above 101°F)
- 7 days/yr
- Hot days in 30 yrs
- 16 days/yr
Wind risk 2/10 · Minimal
- Chance of severe wind over 30 yrs
- 0.0%
Air-quality risk 2/10 · Minimal
- Unhealthy air days now
- 2 days/yr
- Unhealthy air days in 30 yrs
- 2 days/yr
Risk factors via First Street. Map © Google.
Why this score? — see what drove the D grade
The composite is a weighted blend of 9 inputs, each scored 0–100. Each bar is that input's sub-score; the figure is the points it added to the 100-point composite (weight × sub-score).
- Cash flow +11.6/30.0
- ARV discount +10.7/15.0
- Schools +4.5/10.0
- DSCR +3.4/10.0
- 1% rule +3.3/10.0
- Rent growth +2.5/5.0
- Livability +2.5/5.0
- Condition / age +2.5/5.0
- Appreciation +0.0/10.0
$385,000
🖨 Deal sheet 📄 Offer letter ✓ Due diligence
Multi-family units
County records classify this as Multi-Family (2-4 Unit). Listing-text estimate: 1 unit. estimate disagrees with records
Listing remarks MLS
Welcome home to this beautifully maintained ranch offering true related living! This home is currently set up as 2 units but can be converted back to one unit. The Front unit offers large sun filled living room, with 2 beddrooms, updated bathroom, spacious kitchen & dining room. With unfinished basement. The separate related living space includes a private entrance, living room, kitchenette, 2 bedrooms & bathroom. Additional highlights 3 car garage & storage shed & large back yard. Convenient location near parks, shopping & restaurants. One level convenience meets flexible living in this move in ready home. Schedule your showing today!
Key facts
- Kitchenette
- Storage shed
- Private entrance
Tags
Neighborhood map
What this means for you Summary
Snapshot
- This is a 4-bed/2.0-bath multifamily listed at $385k.
Deal economics
- At list price, monthly cash flow is $-117 ($-1k/yr) — negative.
- To cash-flow at today's rent, offer at most $364k (5.4% below list).
- To meet the 1% rule (rent ≥ 1% of price), the offer needs to be $320k (16.9% below list).
- Recommended offer: $320k (16.9% below list) — sets the bar for 1% rule.
- Cap rate 5.9% vs local median 3.6% in St. John — top-decile yield for the area; either an underpriced asset or a hidden risk that comps aren't pricing in. Stress-test before assuming the spread holds.
Location & tenants
- Location reads: area grade D — affects rentability + tenant quality, not the cash-flow math above.
- Lake Central School Corporation (suburban): math 45% / reading 54% proficiency, ranked #41 of 301 in IN (top 14%) — families likely to look elsewhere, expect single-tenant / working-renter base with shorter leases; only 15% free/reduced lunch — higher-income household profile.
- Market conditions: 260 active listings in the ZIP; 1 comparable units currently listed for rent nearby; 1,642 units permitted in Lake County in 2024 (14 in 5+ unit buildings).
Forward outlook
- Local home prices are declining (-3.0%/yr); year-one equity from $3k of loan paydown is wiped out by about $12k of value loss. Plan a longer hold.
- Lake County population projected to shrink 7% by 2050 — rents likely to lag national; underwrite the cash flow, not the appreciation.
Negotiation context
- It's been on market 108 days — a 9% lower offer ($350k) is reasonable based on typical stale-listing flexibility.
- 2 sale attempts since 12y ago with the ask held roughly flat each time — persistent listings suggest the price (not the market) is what's stuck; bring a comps-based counter.
- Current owner paid $146k; list at $385k implies a 163% gain — meaningful room to come down on a strong offer.
Risks & watch-outs
- Watch-outs: built in 1956 — expect roof / HVAC / electrical / plumbing capex.
Questions for the listing agent
- What do current leases actually rent for vs. the listed asking? Can we see a recent rent roll and the last 12 months of T-12 income?
- It's been on market 108 days. Have you received any prior offers? Is the seller open to a 17% concession, seller financing, or rate buy-down credit?
- Built in 1956 — when were the roof, HVAC, electrical panel, plumbing, and water heater last replaced?
- Why hasn't it sold? Are there any deal-killer items the seller is aware of (foundation, flood, title, zoning, code violations)?
- Is there a deadline driving the sale (1031 exchange, divorce, estate, relocation)? That informs how much negotiation room exists.
- The area grade is low — what's the realistic commute time and amenity access for the typical tenant pool here? Any planned neighborhood developments (good or bad) we should know about?
- What's the average days-on-market for RENTAL listings here right now (not sales)? A rising rental-DOM trend means longer vacancies and softer asking-rent achievability than the comps imply.
- What's the recent tenant-quality profile in this submarket — average credit score on applications, eviction rate, late-payment / NSF rate, and stable-employment percentage? A property-management company in the area should have these aggregated.
- How much new apartment / multifamily construction is in the pipeline within 1–3 miles? Heavy new supply (>2% of stock underway) typically softens rents 12–24 months out; light construction supports rent growth.
Investment metrics
- 1% rule
- 0.83% ✗
- Cap rate
- 5.93%
- Cash-on-cash
- -1.30%
- DSCR
- 0.94
- GRM
- 10.0
CMA / ARV
- ARV (median comp)
- $414,415
- List price
- $385,000
- Delta
- -7.10%
- Verdict
- FAIR
- Comps
- 20 within 1.0 mi
Projected returns pro-forma
-3.0% appreciation · 3.0% rent growth · sell at horizon
- IRR
- -18.4%
- Equity multiple
- 0.35×
- Total profit
- $-69,805
- Equity at exit
- $57,405
- IRR
- -10.8%
- Equity multiple
- 0.35×
- Total profit
- $-70,230
- Equity at exit
- $33,288
Cash invested: $107,800 (down + closing). Projections, not guarantees.
Landlord ↔ Tenant lean methodology
- Overall (STATE)
- 90 Strongly Landlord-Friendly
- State Indiana
- 90 Strongly Landlord-Friendly · R+11
- County
- — inherits STATE
- City
- — inherits STATE
ZIP-level market 46373
- Home prices YoY
- -23.8%
- Active inventory
- 260
- Price-to-rent
- 10.0×
Monthly cashflow live
- Estimated rent
- $3,200 medium interval (Pro) →
- Mortgage (P&I)
- −$2,019
- Tax from tax record
- −$466 /mo · $5,588/yr
- Insurance
- −$160
- HOA
- −$0
- Vacancy / Maint / Mgmt
- −$672
- Net cashflow
- $-117
Break-even live
UW: 25.0% down · 7.5% · 30yr · 1.5% tax · 5.0% vac · 8.0% maint · 8.0% mgmt
Financing live
Cash to close
- Down payment
- $96,250
- Closing costs
- $11,550
- Reserves months
- —
- Total cash needed
- —
Loan-product check · same deal, 3 products live
Conventional
25% down · 7.5% · 30yr
- Down + closing
- —
- Monthly P&I
- —
- Monthly cashflow
- —
- DSCR
- —
- Eligible?
- —
Personal DTI + credit; lowest rate.
DSCR
20% down · 8.5% · 30yr
- Down + closing
- —
- Monthly P&I
- —
- Monthly cashflow
- —
- DSCR
- —
- Eligible?
- —
No personal income docs; deal must DSCR.
Hard money
10% down · 12.0% · 12mo
- Down + closing
- —
- Monthly P&I
- —
- Monthly cashflow
- —
- DSCR
- —
- Eligible?
- —
Short-term bridge; refi at stabilization.
Rent comps 1 comps
| Address | Beds | Baths | Sqft | Rent | $/sqft | DOM | Units | Dist |
|---|---|---|---|---|---|---|---|---|
| 10173 Joliet St Saint John, IN | 4.0 | 2.0 | 2413 | $3,200 | $1.33 | 2d | 1 | 0.55mi |
Listing history 10 events
-
2026-06-07status $385,000 Pending 108 DOM
-
2026-06-04days on market $385,000 Active 108 DOM
-
2026-06-03days on market $385,000 Active 107 DOM
-
2026-06-02days on market $385,000 Active 106 DOM
-
2026-06-01days on market $385,000 Active 105 DOM
-
2026-05-31days on market $385,000 Active 104 DOM
-
2026-04-02price $385,000 675-char remark
Show marketing remark (675 chars)
Welcome home to this beautifully maintained ranch offering true related living! This home is currently set up as 2 units but can be converted back to one unit. The Front unit offers large sun filled living room, with 2 beddrooms, updated bathroom, spacious kitchen & dining room. With unfinished basement. The separate related living space includes a private entrance, living room, kitchenette, 2 bedrooms & bathroom. Additional highlights 3 car garage & storage shed & large back yard. Convenient location near parks, shopping & restaurants. One level convenience meets flexible living in this move in ready home. Schedule your showing today!
-
2026-02-16$399,000 Active 675-char remark
Show marketing remark (675 chars)
Welcome home to this beautifully maintained ranch offering true related living! This home is currently set up as 2 units but can be converted back to one unit. The Front unit offers large sun filled living room, with 2 beddrooms, updated bathroom, spacious kitchen & dining room. With unfinished basement. The separate related living space includes a private entrance, living room, kitchenette, 2 bedrooms & bathroom. Additional highlights 3 car garage & storage shed & large back yard. Convenient location near parks, shopping & restaurants. One level convenience meets flexible living in this move in ready home. Schedule your showing today!
-
2015-01-09soldstatus $146,500 678-char remark
Show marketing remark (678 chars)
A great opportunity for related living in this 4 bedroom, 2 bath Ranch home on a beautiful lot near shopping, restaurants, churches, & schools. 2 units both have 2 bedrooms & 1 bath & separate entrances. Unit 1 in front needs work; Unit 2 in back is move in ready. Unit 1 has a basement; Unit 2 has a concrete crawl (only accessed from Unit 1). Both have same address. Separate gas, one electric, & one water. Both Units have decks. There is a 3 car garage & a storage shed. Excellent opportunity to live in one & rent out other or rent out both. There are 3 different parcel numbers; therefore 3 different legals & 3 different tax bills.
-
2014-07-25$159,000 678-char remark
Show marketing remark (678 chars)
A great opportunity for related living in this 4 bedroom, 2 bath Ranch home on a beautiful lot near shopping, restaurants, churches, & schools. 2 units both have 2 bedrooms & 1 bath & separate entrances. Unit 1 in front needs work; Unit 2 in back is move in ready. Unit 1 has a basement; Unit 2 has a concrete crawl (only accessed from Unit 1). Both have same address. Separate gas, one electric, & one water. Both Units have decks. There is a 3 car garage & a storage shed. Excellent opportunity to live in one & rent out other or rent out both. There are 3 different parcel numbers; therefore 3 different legals & 3 different tax bills.
ⓘ Source: listings_history table (triggers on properties + properties_extension) + one-shot
backfill from property_details.listing_events for pre-trigger history.
Tax reassessment forecast IN · Partial reset (capped growth)
- Current annual tax
- $5,588 · $466/mo
- Projected year-2 tax
- $5,588 · $466/mo
- Expected delta
- $0/yr ($0/mo · 0.0%)
ⓘ Screening estimate from a state-policy table — verify with the county assessor before closing.
Climate risk First Street
- Flood 1/10 Low FEMA zone X (unshaded) · 0% chance over 30 yrs
- Wildfire 1/10 Low
- Heat 2/10 Low 7 d/yr ≥101°F today · 16 d/yr by 30 yrs out
- Wind 2/10 Low 0% chance of damaging wind over 30 yrs
- Air quality 2/10 Low 2 unhealthy d/yr today · 2 by 30 yrs out
Nearby sold comps map
Loading sold comps map…
Walkable amenities ~0.75 mi
Loading nearby amenities…
Taxation est. · year 1
- Rental income
- $38,400
- − Mortgage interest
- −$21,566
- − Property taxes
- −$5,588
- − Insurance
- −$1,925
- − Repairs & maintenance
- −$3,072
- − Management
- −$3,072
- − Depreciation
- −$11,200
- Taxable loss
- −$8,023
- Est. tax savings @ 24.0%
- +$1,926
- After-tax cash flow
- $521/yr
For passive investors: Depreciation is non-cash, so a rental often shows a tax loss while cash-flowing — sheltering income. Rental losses are passive: they offset passive income freely, and up to $25,000/yr can offset ordinary (W-2) income if you actively participate and your MAGI is under $100k (phasing out to $0 by $150k); unused losses carry forward. On sale, claimed depreciation is recaptured at up to 25%, and gains may owe capital-gains tax (a 1031 exchange can defer both). Figures are a year-1 estimate at your 24.0% rate — not tax advice; consult a CPA.
Schools (NCES district)
- District
- Lake Central School Corporation
- NCES district ID
- 1805450
- Math proficiency
- 45% ▼ -9.00%
- Reading proficiency
- 54% ▼ -11.00%
- Median HH income
- $75,957
- Composite
- 44.82/100
- National rank
- #2736
- State rank
- #41 of 301 in IN
Livability — St. John
No livability data for this city. (Only ~50 U.S. cities are tracked.)
Census & demographics
- Census place
- St. John, IN
- City population
- 18,509
- Population (ZIP)
- 18,509
Population outlook (Lake County) Hauer SSP2
- Today (2025)
- 484,026 people
- By 2030
- 478,091 · -1.2%
- By 2040
- 462,974 · -4.3%
- By 2050
- 449,894 · -7.1%
- By 2075
- 436,169 · -9.9%
- By 2100
- 426,607 · -11.9%
Race, ethnicity, and origin ACS 2023
- Neighborhood character
- Predominantly White (82%)
- Race & ethnicity
- White 82% Hispanic / Latino 9% Two or more races 5% Black 3% Asian 2%
- Hispanic origin (detail)
- Mexican 7% Puerto Rican 1%
- Common ancestry
- Romanian 21% Iranian 6% Lithuanian 2%
- Foreign-born
- 6% · Canada
- Languages at home
- 89% English-only · Spanish 5% Russian/Polish/Slavic 4% Other Indo-European 1%
Political lean MEDSL · Lake
- 2024 margin
- Lean D (+5.6) · D 52.1% · R 46.5% · Other 1.5%
- 2008→2024 swing
- -28.6pp toward R · 2008: 34.3pp · 2024: 5.6pp
- All cycles
- 2024: D+5.6 2020: D+15.1 2016: D+20.6 2012: D+31.0 2008: D+34.3
Not yet ingested
- Civics
- —
Market trends
- HPI YoY
- ▼ -69.86%
- Current HPI
- 224.1176
- Rent YoY
- —
- Metro
- —
- State GDP YoY
- ▲ 2.90%
- F500 in state
- 18
Industry mix (Fortune 500 HQ in IN)
| Industry | F500 HQs | Revenue |
|---|---|---|
| Industrial Machinery | 2 | $37B |
|
||
| Healthcare | 1 | $177B |
|
||
| Pharmaceuticals | 1 | $45B |
|
||
| Metals / Steel | 1 | $18B |
|
||
| Agriculture | 1 | $17B |
|
||
| Packaging | 1 | $12B |
|
||
Price history
+142.1% since first listed4 events — show timeline
- 2026-04-02 Price Changed $385,000 NIRA MLS as Distributed by MLS Grid
- 2026-02-16 Listed $399,000 NIRA MLS as Distributed by MLS Grid
- 2015-01-09 Sold (MLS) $146,500 NIRA MLS as Distributed by MLS Grid
- 2014-07-25 Listed $159,000 NIRA MLS as Distributed by MLS Grid
Property tax history
+18.5%/yrLatest (2024): $5,588 · +12.3% YoY. Source: county tax records.
Cash-flow waterfall
monthlySold comps — $/sqft
last 12 mo · ≤1 miLoading sold comps…