 🏢 Co-op
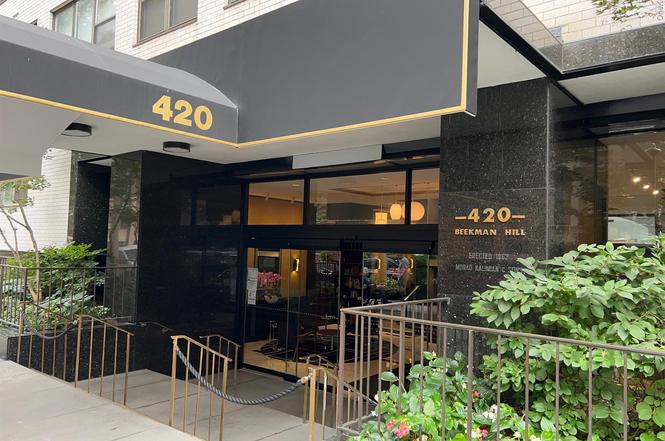
420 E 51st St Unit 8DE · New York, NY
Flood risk 1/10 · Minimal
- FEMA flood zone
- X (unshaded)
- Chance of flooding over 30 yrs
- 0.0%
- Est. flood insurance / yr
- $507 – $1,088
Fire risk 1/10 · Minimal
- Est. fire insurance / yr
- $691 – $1,283
Heat risk 6/10 · Moderate
- Hot days now (above 99°F)
- 7 days/yr
- Hot days in 30 yrs
- 15 days/yr
Wind risk 6/10 · Moderate
- Chance of severe wind over 30 yrs
- 27.0%
Air-quality risk 4/10 · Minor
- Unhealthy air days now
- 5 days/yr
- Unhealthy air days in 30 yrs
- 6 days/yr
Risk factors via First Street. Map © Google.
Why this score? — see what drove the D- grade
The composite is a weighted blend of 9 inputs, each scored 0–100. Each bar is that input's sub-score; the figure is the points it added to the 100-point composite (weight × sub-score).
- 1% rule +8.2/10.0
- ARV discount +7.5/15.0
- Appreciation +7.5/10.0
- Schools +5.0/10.0
- Rent growth +4.7/5.0
- Livability +3.8/5.0
- Condition / age +2.5/5.0
- Cash flow +0.0/30.0
- DSCR +0.0/10.0
$599,900
🖨 Deal sheet 📄 Offer letter ✓ Due diligence
Listing remarks
Grand Scale Living on a Quiet Cul-de-Sac: 420 East 51st Street, Apartment 8DE * * Welcome to your sprawling new residence in the heart of prestigious Beekman Place. * * Apartment 8DE at the full-service Morad Beekman offers a rare and exceptional opportunity to own a massive, combined co-op unit, providing the space and privacy of a house with the convenience of a Manhattan full-service building. Residence Highlights: * Extraordinary Scale: This impressive combination apartment offers a flexible and expansive layout, perfect for large families or those who simply desire generous living space. * 4 Bedrooms, 3 Full Bathrooms: Enjoy maximum privacy with separated sleeping quarters, in
Key facts
- Ample closet space
- Natural light
- Crown moldings
Tags
Neighborhood map
What this means for you Summary
Snapshot
- This is a 4-bed/3.0-bath condo listed at $600k.
Deal economics
- At list price, monthly cash flow is $-3k ($-38k/yr) — negative.
- The deal already cash-flows at list — no discount required.
- Meets the 1% rule at list price ($8k rent vs $600k).
- Recommended offer: $528k (12.0% below list) — sets the bar for market timing.
- Cap rate -0.1% vs local median 2.6% in New York — below-typical yield; the buyer is paying a premium for something (appreciation thesis, condition, location) that the cap rate doesn't capture.
Location & tenants
- Location reads 75/100 on livability (#268 in NY, #4,188 nationally) — a middle-class / working-renter tenant base. Strengths: amenities A+, commute A+, health & safety A; Watch: crime F, cost of living F.
- Market conditions: Rents rising fast (+8.7%/yr); 715 active listings in the ZIP; 30 comparable units currently listed for rent nearby; rentals leasing fast (median 8d on market — plan ~1-2 weeks tenant-placement turnaround); high-income renter base; 4,467 units permitted in New York County in 2024 (4,463 in 5+ unit buildings).
- At $7,892/mo this rent would consume 55% of the median local household income ($172k/yr) (locally 2256% of renters already pay >50% of income on rent) — very limited rent-growth headroom before tenants either downsize or default.
Forward outlook
- In year one you build about $34k of equity ($4k loan paydown + $30k appreciation (5.0% local appreciation)).
- New York County population projected at +21% by 2050 — long-run rental-demand tailwind backs the buy-and-hold thesis.
- By year 2, paydown + projected appreciation supports a ~$54k cash-out refi (75% LTV) — recoverable capital for the next deal without selling this one.
Negotiation context
- It's been on market 147 days — a 12% lower offer ($528k) is reasonable based on typical stale-listing flexibility.
- 12 sale attempts since 14y ago; this cycle's ask has dropped $76k (11%) from the opening price — seller is motivated, your offer sets the floor, not the list.
Risks & watch-outs
- Watch-outs: HOA is 67% of rent.
- Climate carrying-cost: major wind risk, 27% chance of damaging wind over 30y; extreme-heat days projected 7→15/yr by 2055 (HVAC capex compounding) — expect insurance premiums to compound above CPI over the hold.
Questions for the listing agent
- What do current leases actually rent for vs. the listed asking? Can we see a recent rent roll and the last 12 months of T-12 income?
- It's been on market 147 days. Have you received any prior offers? Is the seller open to a 12% concession, seller financing, or rate buy-down credit?
- Built in 1962 — when were the roof, HVAC, electrical panel, plumbing, and water heater last replaced?
- What does the HOA fee cover, when was the last increase, and are there any pending special assessments or reserve-fund shortfalls?
- Any open or pending special assessments — roof, HVAC, plumbing, elevator, façade? What's the per-unit balance and payoff schedule, and is the seller paying it off at close or rolling it to the buyer?
- Why hasn't it sold? Are there any deal-killer items the seller is aware of (foundation, flood, title, zoning, code violations)?
- Is there a deadline driving the sale (1031 exchange, divorce, estate, relocation)? That informs how much negotiation room exists.
- Schools are B-rated — typically a magnet for longer-tenancy family renters. What's the average tenant stay here, and is there a school-zone premium baked into asking?
- Crime grade is F in this area — have there been break-ins, vandalism, or insurance claims at this property in the last 3 years? What carrier currently insures it and at what premium?
- The area grade is low — what's the realistic commute time and amenity access for the typical tenant pool here? Any planned neighborhood developments (good or bad) we should know about?
- What's the average days-on-market for RENTAL listings here right now (not sales)? A rising rental-DOM trend means longer vacancies and softer asking-rent achievability than the comps imply.
- What's the recent tenant-quality profile in this submarket — average credit score on applications, eviction rate, late-payment / NSF rate, and stable-employment percentage? A property-management company in the area should have these aggregated.
- How much new apartment / multifamily construction is in the pipeline within 1–3 miles? Heavy new supply (>2% of stock underway) typically softens rents 12–24 months out; light construction supports rent growth.
Investment metrics
- 1% rule
- 1.32% ✓
- Cap rate
- -0.09%
- Cash-on-cash
- -22.79%
- DSCR
- -0.01
- GRM
- 6.3
CMA / ARV
No comps found within radius.
Projected returns pro-forma
4.97% appreciation · 8.0% rent growth · sell at horizon
- IRR
- -1.8%
- Equity multiple
- 0.88×
- Total profit
- $-20,967
- Equity at exit
- $338,757
- IRR
- 6.1%
- Equity multiple
- 2.31×
- Total profit
- $219,421
- Equity at exit
- $583,660
Cash invested: $167,972 (down + closing). Projections, not guarantees.
Landlord ↔ Tenant lean methodology
- Overall (CITY)
- 0 Strongly Tenant-Friendly
- State New York
- 15 Strongly Tenant-Friendly · D+10
- County
- — inherits STATE
- City New York
- 0 Strongly Tenant-Friendly · D+34
ZIP-level market 10022
- Home prices YoY
- 2.4%
- Rents YoY
- 8.7%
- Active inventory
- 715
- Price-to-rent
- 6.3×
Monthly cashflow live
- Estimated rent
- $7,892 medium interval (Pro) →
- Mortgage (P&I)
- −$3,146
- Tax est. 1.5%
- −$750 /mo · $8,998/yr
- Insurance
- −$250
- HOA est. from 1 same-building comp
- −$5,279
- Vacancy / Maint / Mgmt
- −$1,657
- Net cashflow
- $-3,190
Break-even live
UW: 25.0% down · 7.5% · 30yr · 1.5% tax · 5.0% vac · 8.0% maint · 8.0% mgmt
Financing live
Cash to close
- Down payment
- $149,975
- Closing costs
- $17,997
- Reserves months
- —
- Total cash needed
- —
Loan-product check · same deal, 3 products live
Conventional
25% down · 7.5% · 30yr
- Down + closing
- —
- Monthly P&I
- —
- Monthly cashflow
- —
- DSCR
- —
- Eligible?
- —
Personal DTI + credit; lowest rate.
DSCR
20% down · 8.5% · 30yr
- Down + closing
- —
- Monthly P&I
- —
- Monthly cashflow
- —
- DSCR
- —
- Eligible?
- —
No personal income docs; deal must DSCR.
Hard money
10% down · 12.0% · 12mo
- Down + closing
- —
- Monthly P&I
- —
- Monthly cashflow
- —
- DSCR
- —
- Eligible?
- —
Short-term bridge; refi at stabilization.
Rent comps 30 comps
| Address | Beds | Baths | Sqft | Rent | $/sqft | DOM | Units | Dist |
|---|---|---|---|---|---|---|---|---|
| 323 E 51st St Unit 1024750P New York, NY | 2.0–4.0 | 2.0–3.5 | 2093 | $34,650 | $16.56 | 7d | 2 | 0.14mi |
| 420 E 54th St New York, NY | 3.0 | 1.0–2.5 | 1104 | $13,336 | $12.07 | 1d | 14 | 0.14mi |
| 400 E 54th St Unit 409 New York, NY | 4.0 | 2.0 | 1130 | $9,695 | $8.58 | 21d | 1 | 0.15mi |
| 160 E 48th St New York, NY | 3.0 | 1.0–2.0 | 878 | $10,150 | $11.55 | 3d | 9 | 0.38mi |
| 207 E 57th St Unit 16A New York, NY | 3.0 | 3.0 | 1551 | $13,750 | $8.87 | 24d | 1 | 0.44mi |
| 401 E 60th St Unit 37B New York, NY | 3.0 | 3.0 | 1560 | $10,000 | $6.41 | 11d | 1 | 0.48mi |
| 150 E 57th St New York, NY | 5.0 | 1.0–7.5 | 2750 | $26,206 | $9.53 | 1d | 5 | 0.48mi |
| 303 Park Ave #2811 New York, NY | 3.0 | 2.5 | 1908 | $37,000 | $19.39 | 24d | 1 | 0.49mi |
| 222 E 39th St New York, NY | 1.0–4.0 | 1.0–2.0 | 1100 | $9,350 | $8.50 | 2d | 20 | 0.66mi |
| 222 E 39th St New York, NY | 1.0–4.0 | 1.0–2.0 | 1100 | $9,350 | $8.50 | 6d | 19 | 0.66mi |
| 222 E 39th St New York, NY | 4.0 | 1.0–2.0 | 1100 | $9,350 | $8.50 | 10d | 19 | 0.66mi |
| 222 E 39th St New York, NY | 1.0–4.0 | 1.0–2.0 | 1100 | $9,350 | $8.50 | 20d | 19 | 0.66mi |
| 222 E 39th St New York, NY | 1.0–4.0 | 1.0–2.0 | 1100 | $9,350 | $8.50 | 24d | 18 | 0.66mi |
| 360 E 65th St #1283 New York, NY | 1.0–3.0 | 1.0–2.0 | 1059 | $8,790 | $8.30 | 3d | 3 | 0.71mi |
| 475 48th Ave Long Island City, NY | 3.0 | 1.0–3.0 | 1293 | $8,971 | $6.94 | 1d | 1 | 0.75mi |
| 138 E 38th St New York, NY | 3.0 | 1.0–2.0 | 750 | $8,330 | $11.11 | 24d | 4 | 0.76mi |
| 15 W 55th St #736 New York, NY | 2.0–3.0 | 1.0–2.0 | 1250 | $8,630 | $6.90 | 1d | 2 | 0.80mi |
| 401 E 34th St New York, NY | 3.0 | 1.0–2.0 | 887 | $9,147 | $10.31 | 1d | 55 | 0.82mi |
| 200 E 69th St New York, NY | 2.0–3.0 | 2.5–3.5 | 1958 | $20,000 | $10.21 | 2d | 2 | 0.94mi |
| 220 E 30th St Unit 2 New York, NY | 3.0 | 2.5 | 2200 | $11,995 | $5.45 | 24d | 1 | 1.08mi |
| 160 Central Park S New York, NY | 1.0–3.0 | 1.0–3.5 | 1550 | $50,000 | $32.26 | 7d | 9 | 1.10mi |
| 160 Central Park S New York, NY | 1.0–3.0 | 1.5–3.5 | 1578 | $50,000 | $31.68 | 1d | 9 | 1.10mi |
| 160 Central Park S New York, NY | 1.0–3.0 | 1.0–3.5 | 1550 | $50,000 | $32.26 | 7d | 10 | 1.10mi |
| 490 2nd Ave Unit 10A New York, NY | 4.0 | 2.0 | 1400 | $10,900 | $7.79 | 24d | 1 | 1.17mi |
| 50 E 72nd St Unit 10B New York, NY | 3.0 | 3.0 | 1645 | $17,500 | $10.64 | 18d | 1 | 1.18mi |
| 50 E 72nd St New York, NY | 2.0–3.0 | 3.0 | 1647 | $17,500 | $10.62 | 7d | 2 | 1.18mi |
| 121 Madison Ave New York, NY | 2.0–4.0 | 1.0–2.0 | 1012 | $9,825 | $9.70 | 7d | 3 | 1.19mi |
| 460 2nd Ave Unit 3A New York, NY | 4.0 | 2.0 | 1300 | $11,685 | $8.99 | 21d | 1 | 1.20mi |
| 1435 2nd Ave Unit 1021957P New York, NY | 3.0 | 2.0 | 1194 | $7,740 | $6.48 | 12d | 1 | 1.22mi |
| 10 E 29th St New York, NY | 1.0–3.0 | 1.0–3.0 | 1323 | $16,736 | $12.65 | 1d | 4 | 1.28mi |
HOA detail condo
- Monthly dues
- $0 · $0/yr
- Assessments
- None detected in remarks — confirm with the listing agent.
Listing history 38 events
-
2026-03-17status Pending
-
2026-03-17status Active
-
2026-03-13status Pending
-
2026-03-12status Active
-
2026-03-10historical
-
2026-01-09price $599,900
-
2025-12-05price $629,900
-
2025-10-15$676,000 Active
-
2022-11-19price $73,500
-
2022-02-16historical
-
2021-12-11price $1,050,000
-
2021-12-07price $1,050,000
-
2021-10-21price $949,000
-
2021-10-21price $949,000
-
2021-07-16price $899,000
-
2021-07-15price $899,000
-
2021-06-05price $950,000
-
2021-06-04price $950,000
-
2021-05-11price $999,000
-
2021-04-21price $1,095,000
-
2021-04-12$999,000 Active
-
2021-04-12$999,000 Active
-
2018-04-18historical Expired listing
-
2018-04-09price $1,295,000
-
2018-01-26status Active
-
2018-01-25historical Permanently Off Market
-
2017-11-15status Active
-
2017-10-26historical Permanently Off Market
-
2017-08-25price $1,195,000
-
2017-06-27price $1,295,000
-
2017-06-27status Active
-
2017-04-12$1,495,000
-
2017-04-12$1,195,000
-
2015-07-13price $1,399,000
-
2015-02-17$1,295,000
-
2012-11-08$1,395,000
-
1997-11-28price $1,549,000
-
1997-11-28price $1,395,000
ⓘ Source: listings_history table (triggers on properties + properties_extension) + one-shot
backfill from property_details.listing_events for pre-trigger history.
Climate risk First Street
- Flood 1/10 Low FEMA zone X (unshaded) · 0% chance over 30 yrs
- Wildfire 1/10 Low
- Heat 6/10 Major 7 d/yr ≥99°F today · 15 d/yr by 30 yrs out
- Wind 6/10 Major 27% chance of damaging wind over 30 yrs
- Air quality 4/10 Moderate 5 unhealthy d/yr today · 6 by 30 yrs out
Nearby sold comps map
Loading sold comps map…
Walkable amenities ~0.75 mi
Loading nearby amenities…
Taxation est. · year 1
- Rental income
- $94,704
- − Mortgage interest
- −$33,604
- − Property taxes
- −$8,998
- − Insurance
- −$3,000
- − Repairs & maintenance
- −$7,576
- − Management
- −$7,576
- − HOA
- −$63,348
- − Depreciation
- −$17,452
- Taxable loss
- −$46,850
- Est. tax savings @ 24.0%
- +$11,244
- After-tax cash flow
- $-27,037/yr
For passive investors: Depreciation is non-cash, so a rental often shows a tax loss while cash-flowing — sheltering income. Rental losses are passive: they offset passive income freely, and up to $25,000/yr can offset ordinary (W-2) income if you actively participate and your MAGI is under $100k (phasing out to $0 by $150k); unused losses carry forward. On sale, claimed depreciation is recaptured at up to 25%, and gains may owe capital-gains tax (a 1031 exchange can defer both). Figures are a year-1 estimate at your 24.0% rate — not tax advice; consult a CPA.
Schools (NCES district)
No district data.
Livability — New York
- Score
- 75/100
- State rank
- #268
- US rank
- #4188
Category grades
Schools grade is shown separately in the Schools card above.
Census & demographics
- Census place
- New York, NY
- County
- New York County · 1,599,927 people
- City population
- 7,731,280
- Metro
- New York-Newark-Jersey City, NY-NJ-PA
- Population (ZIP)
- 34,049
- Household income
- $172,026
- Rent vs Own
- Severe rent burden
- 2256.0
Population outlook (New York County) Hauer SSP2
- Today (2025)
- 1,825,725 people
- By 2030
- 1,904,611 · +4.3%
- By 2040
- 2,052,719 · +12.4%
- By 2050
- 2,206,601 · +20.9%
- By 2075
- 2,509,427 · +37.4%
- By 2100
- 2,702,933 · +48.0%
Race, ethnicity, and origin ACS 2023
- Neighborhood character
- Predominantly White (73%)
- Race & ethnicity
- White 73% Asian 12% Hispanic / Latino 8% Two or more races 7% Black 2%
- Hispanic origin (detail)
- Mexican 1% Puerto Rican 1% Dominican 1%
- Common ancestry
- Romanian 5% Scotch-Irish 5% Lithuanian 2%
- Foreign-born
- 24% · Canada, China, South Korea
- Languages at home
- 75% English-only · Spanish 6% Other Indo-European 6% Chinese 3%
Political lean MEDSL · New York
- 2024 margin
- Solid D (+64.8) · D 82.4% · R 17.6%
- 2008→2024 swing
- -7.4pp toward R · 2008: 72.2pp · 2024: 64.8pp
- All cycles
- 2024: D+64.8 2020: D+74.5 2016: D+77.2 2012: D+69.6 2008: D+72.2
Not yet ingested
- Civics
- —
Market trends
- HPI YoY
- ▲ 4.97%
- Current HPI
- 215.7225
- Rent YoY
- ▲ 8.69%
- Metro
- New York-Newark-Jersey City, NY-NJ-PA
- State GDP YoY
- ▲ 2.60%
- F500 in state
- 92
Industry mix (Fortune 500 HQ in NY)
| Industry | F500 HQs | Revenue |
|---|---|---|
| Financial Services | 10 | $950B |
|
||
| Consumer Goods | 9 | $162B |
|
||
| Insurance | 4 | $225B |
|
||
| Telecommunications | 2 | $144B |
|
||
| Pharmaceuticals | 2 | $112B |
|
||
| Media / Entertainment | 2 | $69B |
|
||
Price history
-61.3% since first listed38 events — show timeline
- 2026-03-17 Pending — OneKey® MLS as Distributed by MLS Grid
- 2026-03-17 Relisted — OneKey® MLS as Distributed by MLS Grid
- 2026-03-13 Pending — OneKey® MLS as Distributed by MLS Grid
- 2026-03-12 Relisted — OneKey® MLS as Distributed by MLS Grid
- 2026-03-10 Listing Removed — OneKey® MLS as Distributed by MLS Grid
- 2026-01-09 Price Changed $599,900 OneKey® MLS as Distributed by MLS Grid
- 2025-12-05 Price Changed $629,900 OneKey® MLS as Distributed by MLS Grid
- 2025-10-15 Listed $676,000 OneKey® MLS as Distributed by MLS Grid
- 2022-11-19 Price Changed $73,500 RLS at REBNY
- 2022-02-16 Listing Removed — OneKey® MLS as Distributed by MLS Grid
- 2021-12-11 Price Changed $1,050,000 OneKey® MLS as Distributed by MLS Grid
- 2021-12-07 Price Changed $1,050,000 RLS at REBNY
- 2021-10-21 Price Changed $949,000 RLS at REBNY
- 2021-10-21 Price Changed $949,000 OneKey® MLS as Distributed by MLS Grid
- 2021-07-16 Price Changed $899,000 OneKey® MLS as Distributed by MLS Grid
- 2021-07-15 Price Changed $899,000 RLS at REBNY
- 2021-06-05 Price Changed $950,000 OneKey® MLS as Distributed by MLS Grid
- 2021-06-04 Price Changed $950,000 RLS at REBNY
- 2021-05-11 Price Changed $999,000 RLS at REBNY
- 2021-04-21 Price Changed $1,095,000 RLS at REBNY
- 2021-04-12 Listed $999,000 RLS at REBNY
- 2021-04-12 Listed $999,000 OneKey® MLS as Distributed by MLS Grid
- 2018-04-18 Delisted — RLS at REBNY
- 2018-04-09 Price Changed $1,295,000 RLS at REBNY
- 2018-01-26 Relisted — RLS at REBNY
- 2018-01-25 Delisted — RLS at REBNY
- 2017-11-15 Relisted — RLS at REBNY
- 2017-10-26 Delisted — RLS at REBNY
- 2017-08-25 Price Changed $1,195,000 RLS at REBNY
- 2017-06-27 Price Changed $1,295,000 RLS at REBNY
- 2017-06-27 Relisted — RLS at REBNY
- 2017-04-12 Listed $1,195,000 RLS at REBNY
- 2017-04-12 Listed $1,495,000 RLS at REBNY
- 2015-07-13 Price Changed $1,399,000 RLS at REBNY
- 2015-02-17 Listed $1,295,000 RLS at REBNY
- 2012-11-08 Listed $1,395,000 RLS at REBNY
- 1997-11-28 Price Changed $1,395,000 RLS at REBNY
- 1997-11-28 Price Changed $1,549,000 RLS at REBNY
Cash-flow waterfall
monthlySold comps — $/sqft
last 12 mo · ≤1 miLoading sold comps…