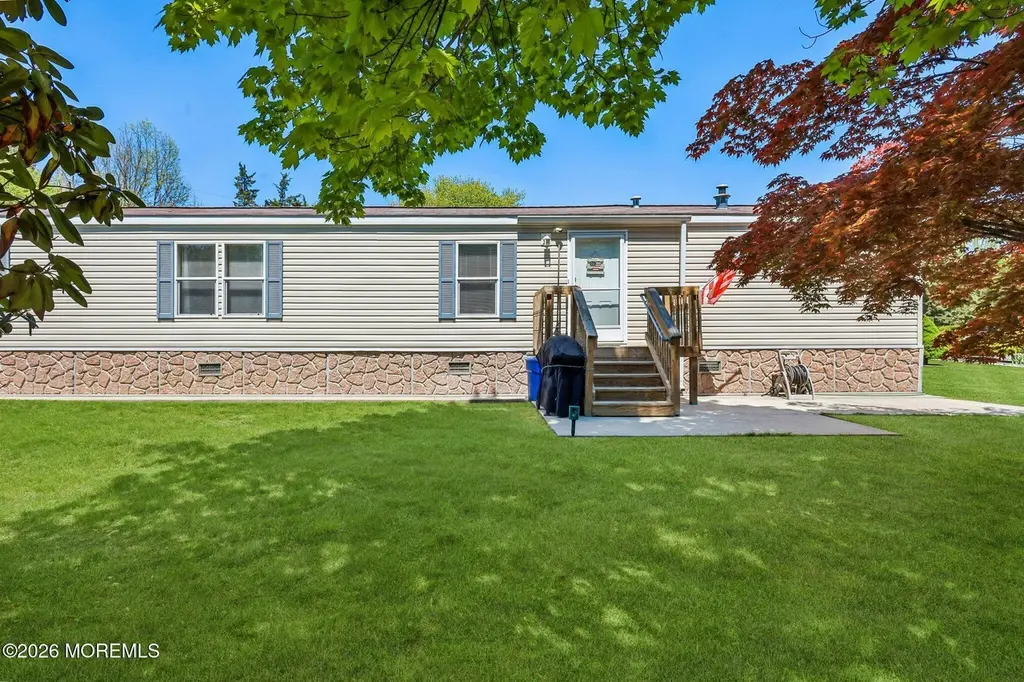
9 Kay Ln #9 · West Freehold, NJ
Flood risk 1/10 · Minimal
- FEMA flood zone
- X (unshaded)
- Chance of flooding over 30 yrs
- 0.0%
- Est. flood insurance / yr
- $473 – $860
Fire risk 4/10 · Minor
- Est. fire insurance / yr
- $526 – $976
Heat risk 6/10 · Moderate
- Hot days now (above 100°F)
- 7 days/yr
- Hot days in 30 yrs
- 15 days/yr
Wind risk 6/10 · Moderate
- Chance of severe wind over 30 yrs
- 54.0%
Air-quality risk 4/10 · Minor
- Unhealthy air days now
- 4 days/yr
- Unhealthy air days in 30 yrs
- 5 days/yr
Risk factors via First Street. Map © Google.
Why this score? — see what drove the B+ grade
The composite is a weighted blend of 9 inputs, each scored 0–100. Each bar is that input's sub-score; the figure is the points it added to the 100-point composite (weight × sub-score).
- Cash flow +29.7/30.0
- ARV discount +11.7/15.0
- 1% rule +10.0/10.0
- DSCR +10.0/10.0
- Schools +3.9/10.0
- Condition / age +3.8/5.0
- Livability +3.7/5.0
- Rent growth +2.9/5.0
- Appreciation +0.0/10.0
$135,000
🖨 Deal sheet 📄 Offer letter ✓ Due diligence
Listing remarks
Monthly Fee pays for: sewerage disposal, water, trash and Recycling pickup, snow plowing and cutting the common area grass. Included in the sale is a 10-foot X12-foot shed, stainless steel kitchen appliances, which includes a stainless-steel up-right freezer. and washer and dryer. This home is move-in ready. The kitchen table and four chairs are negotiable.
Key facts
- Washer and dryer
- Built 2005
- Listed 38 days
Tags
Property features AI
Finance
- Other: Located in Monmouth County (Fort Plains / Howell area)
- HOA & community: Monthly association fee of $779.24 covering trash, sewer, snow removal, and water; Association: Green Acres Manor
Exterior
- Parking: No garage
- Utilities: Public sewer
- Home design: Fee simple ownership
- Exterior features: Shingle and flat roof
Interior
- Kitchen: Kitchen
- Bedrooms: 2 bedrooms
- Bathrooms: 2 full bathrooms
- Heating & cooling: Forced air heating; Central air conditioning
- Interior features: No fireplaces; No basement; Living room
Neighborhood map
What this means for you Summary
Snapshot
- This is a 2-bed/2.0-bath single-family listed at $135k. Condition is rated good.
Deal economics
- At list price, monthly cash flow is $490 ($6k/yr) — positive.
- The deal already cash-flows at list — no discount required.
- Meets the 1% rule at list price ($3k rent vs $135k).
- Recommended offer: $131k (3.0% below list) — sets the bar for market timing.
- Cap rate 10.6% vs local median 2.6% in West Freehold — top-decile yield for the area; either an underpriced asset or a hidden risk that comps aren't pricing in. Stress-test before assuming the spread holds.
Location & tenants
- Location reads 74/100 on livability (#173 in NJ, #4,542 nationally) — a middle-class / working-renter tenant base. Strengths: employment A+, housing A+, health & safety A+; Watch: amenities F, commute F, cost of living F.
- Howell Township Public School District (suburban): math 30% / reading 52% proficiency, ranked #195 of 472 in NJ (top 41%) — families likely to look elsewhere, expect single-tenant / working-renter base with shorter leases; only 12% free/reduced lunch — higher-income household profile.
- Market conditions: Rents rising (+1.5%/yr); 331 active listings in the ZIP; 2 comparable units currently listed for rent nearby; high-income renter base; 2,840 units permitted in Monmouth County in 2024 (484 in 5+ unit buildings).
Forward outlook
- Local home prices are declining (-3.0%/yr); year-one equity from $933 of loan paydown is wiped out by about $4k of value loss. Plan a longer hold.
- Monmouth County population projected at -11% by 2050 — secular population decline; favor cash flow + early exit over multi-decade hold.
- At projected returns (-3.0% appreciation + 1.5% rent growth), your $38k cash investment doubles in ~10 years — after that, you're playing with house money.
Negotiation context
- It's been on market 39 days — a 3% lower offer ($131k) is reasonable based on typical stale-listing flexibility.
Risks & watch-outs
- Watch-outs: HOA is 28% of rent.
- Climate carrying-cost: major wind risk, 54% chance of damaging wind over 30y; extreme-heat days projected 7→15/yr by 2055 (HVAC capex compounding) — expect insurance premiums to compound above CPI over the hold.
Questions for the listing agent
- It's been on market 39 days. Have you received any prior offers? Is the seller open to a 3% concession, seller financing, or rate buy-down credit?
- What does the HOA fee cover, when was the last increase, and are there any pending special assessments or reserve-fund shortfalls?
- Is there a deadline driving the sale (1031 exchange, divorce, estate, relocation)? That informs how much negotiation room exists.
- Schools are B-rated — typically a magnet for longer-tenancy family renters. What's the average tenant stay here, and is there a school-zone premium baked into asking?
- What's the average days-on-market for RENTAL listings here right now (not sales)? A rising rental-DOM trend means longer vacancies and softer asking-rent achievability than the comps imply.
- What's the recent tenant-quality profile in this submarket — average credit score on applications, eviction rate, late-payment / NSF rate, and stable-employment percentage? A property-management company in the area should have these aggregated.
- How much new for-sale + rental construction is in the pipeline within 1–3 miles? Heavy new supply typically softens prices + rents 12–24 months out; constrained supply supports both.
Investment metrics
- 1% rule
- 2.06% ✓
- Cap rate
- 10.65%
- Cash-on-cash
- 15.55%
- DSCR
- 1.69
- GRM
- 4.0
CMA / ARV
- ARV (on-the-fly)
- $148,800
- Comps found
- 5
Show comp detail 5 sales within ~0.75 mi
| Address | Dist | Beds/Ba | Sqft | Sold | Price | $/sf | Match |
|---|---|---|---|---|---|---|---|
| 32 Citation St | 0.25mi | 2/1.0 | 1,000 (+4%) | 8mo | $145,000 | $145 | 71 |
| 74 Ruffian Way | 0.39mi | 2/1.0 | 975 (+2%) | 6mo | $100,000 | $103 | 70 |
| 55 Secretariat St | 0.34mi | 2/1.0 | 1,000 (+4%) | 7mo | $155,000 | $155 | 67 |
| 15 Citation St | 0.19mi | 2/1.0 | 865 (-10%) | 10mo | $153,000 | $177 | 63 |
| 30 Citation St | 0.23mi | 2/1.0 | 840 (-12%) | 17mo | $143,000 | $170 | 50 |
Match score weights: distance 35% · size 25% · config 20% · recency 20%. Top-matched comps best support the ARV.
Projected returns pro-forma
-3.0% appreciation · 1.52% rent growth · sell at horizon
- IRR
- 4.0%
- Equity multiple
- 1.15×
- Total profit
- $5,752
- Equity at exit
- $20,129
- IRR
- 11.5%
- Equity multiple
- 1.82×
- Total profit
- $31,005
- Equity at exit
- $11,672
Cash invested: $37,800 (down + closing). Projections, not guarantees.
Landlord ↔ Tenant lean methodology
- Overall (STATE)
- 21 Tenant-Leaning
- State New Jersey
- 21 Tenant-Leaning · D+6
- County
- — inherits STATE
- City
- — inherits STATE
ZIP-level market 07731
- Rents YoY
- 1.5%
- Active inventory
- 331
- Price-to-rent
- 4.0×
Monthly cashflow live
- Estimated rent
- $2,787 medium interval (Pro) →
- Mortgage (P&I)
- −$708
- Tax est. 1.5%
- −$169 /mo · $2,025/yr
- Insurance
- −$56
- HOA
- −$779
- Vacancy / Maint / Mgmt
- −$585
- Net cashflow
- $490
Break-even live
UW: 25.0% down · 7.5% · 30yr · 1.5% tax · 5.0% vac · 8.0% maint · 8.0% mgmt
Financing live
Cash to close
- Down payment
- $33,750
- Closing costs
- $4,050
- Reserves months
- —
- Total cash needed
- —
Loan-product check · same deal, 3 products live
Conventional
25% down · 7.5% · 30yr
- Down + closing
- —
- Monthly P&I
- —
- Monthly cashflow
- —
- DSCR
- —
- Eligible?
- —
Personal DTI + credit; lowest rate.
DSCR
20% down · 8.5% · 30yr
- Down + closing
- —
- Monthly P&I
- —
- Monthly cashflow
- —
- DSCR
- —
- Eligible?
- —
No personal income docs; deal must DSCR.
Hard money
10% down · 12.0% · 12mo
- Down + closing
- —
- Monthly P&I
- —
- Monthly cashflow
- —
- DSCR
- —
- Eligible?
- —
Short-term bridge; refi at stabilization.
Rent comps 2 comps
| Address | Beds | Baths | Sqft | Rent | $/sqft | DOM | Units | Dist |
|---|---|---|---|---|---|---|---|---|
| 15 N American Dr Howell Township, NJ | 3.0 | 1.0 | 753 | $2,598 | $3.45 | 1d | 7 | 0.26mi |
| 633 Hulses Corner Rd Howell, NJ | 3.0 | 1.0 | 1088 | $3,100 | $2.85 | 1d | 1 | 1.49mi |
HOA detail
- Monthly dues
- $779 · $9,348/yr
- Likely covers
- watersewertrashsnow removal
Listing history 15 events
-
2026-06-18days on market $135,000 Active 39 DOM
-
2026-06-17days on market $135,000 Active 38 DOM
-
2026-06-16days on market $135,000 Active 37 DOM
-
2026-06-15days on market $135,000 Active 36 DOM
-
2026-06-13days on market $135,000 Active 34 DOM
-
2026-06-13days on market $135,000 Active 33 DOM
-
2026-06-09days on market $135,000 Active 30 DOM
-
2026-06-08days on market $135,000 Active 29 DOM
-
2026-06-07days on market $135,000 Active 28 DOM
-
2026-06-04days on market $135,000 Active 25 DOM
-
2026-06-03days on market $135,000 Active 24 DOM
-
2026-06-02days on market $135,000 Active 23 DOM
-
2026-06-01days on market $135,000 Active 22 DOM
-
2026-05-31days on market $135,000 Active 21 DOM
-
2026-05-11$135,000 Active 359-char remark
ⓘ Source: listings_history table (triggers on properties + properties_extension) + one-shot
backfill from property_details.listing_events for pre-trigger history.
Climate risk First Street
- Flood 1/10 Low FEMA zone X (unshaded) · 0% chance over 30 yrs
- Wildfire 4/10 Moderate
- Heat 6/10 Major 7 d/yr ≥100°F today · 15 d/yr by 30 yrs out
- Wind 6/10 Major 54% chance of damaging wind over 30 yrs
- Air quality 4/10 Moderate 4 unhealthy d/yr today · 5 by 30 yrs out
Nearby sold comps map
Loading sold comps map…
Walkable amenities ~0.75 mi
Loading nearby amenities…
Taxation est. · year 1
- Rental income
- $33,445
- − Mortgage interest
- −$7,562
- − Property taxes
- −$2,025
- − Insurance
- −$675
- − Repairs & maintenance
- −$2,676
- − Management
- −$2,676
- − HOA
- −$9,348
- − Depreciation
- −$3,927
- Taxable income
- $4,556
- Est. tax owed @ 24.0%
- −$1,094
- After-tax cash flow
- $4,784/yr
For passive investors: Depreciation is non-cash, so a rental often shows a tax loss while cash-flowing — sheltering income. Rental losses are passive: they offset passive income freely, and up to $25,000/yr can offset ordinary (W-2) income if you actively participate and your MAGI is under $100k (phasing out to $0 by $150k); unused losses carry forward. On sale, claimed depreciation is recaptured at up to 25%, and gains may owe capital-gains tax (a 1031 exchange can defer both). Figures are a year-1 estimate at your 24.0% rate — not tax advice; consult a CPA.
Condition & rehab AI · 24 photos
This home is move-in ready with good condition and minimal repairs needed. A fresh paint job and updated kitchen would significantly increase its value.
Repairs flagged
- Minor kitchen cabinets — slight wear
- Minor bathroom fixtures — slight wear
- Minor landscaping — some dead grass
Value-add opportunities
- Both update kitchen cabinets and fixtures — modernizing the kitchen would appeal to both buyers and renters
- Both paint interior walls — fresh paint would improve the home's curb appeal and interior aesthetics
- Both replace carpeting with hardwood or tile — hardwood or tile flooring would increase the home's value and appeal
Renovation cost estimate screening
| Repair item | Severity | Est. cost |
|---|---|---|
| kitchen cabinets · slight wear | Minor | $500–3,000 |
| bathroom fixtures · slight wear | Minor | $500–3,000 |
| landscaping · some dead grass | Minor | $500–3,000 |
| Total estimated repair cost · 3 items | $1,500–9,000 |
Value-add ROI direction
- Both update kitchen cabinets and fixtures — modernizing the kitchen would appeal to both buyers and renters ↑
- Both paint interior walls — fresh paint would improve the home's curb appeal and interior aesthetics ↑
- Both replace carpeting with hardwood or tile — hardwood or tile flooring would increase the home's value and appeal ↑
ⓘ Cost ranges are severity-bucket heuristics (US national rule-of-thumb). Get contractor quotes + a written scope before underwriting a rehab budget.
Schools (NCES district)
- District
- Howell Township Public School District
- NCES district ID
- 3407560
- Math proficiency
- 30% ▼ -26.00%
- Reading proficiency
- 52% ▼ -16.00%
- Median HH income
- $93,085
- Composite
- 39.35/100
- National rank
- #3979
- State rank
- #195 of 472 in NJ
Livability — West Freehold
- Score
- 74/100
- State rank
- #173
- US rank
- #4542
Category grades
Schools grade is shown separately in the Schools card above.
Census & demographics
- County
- Monmouth County · 505,557 people
- City population
- 56,623
- Metro
- New York-Newark-Jersey City, NY-NJ-PA
- Population (ZIP)
- 40,322
- Household income
- $134,056
- Rent vs Own
- Severe rent burden
- 590.0
Population outlook (Monmouth County) Hauer SSP2
- Today (2025)
- 620,308 people
- By 2030
- 612,309 · -1.3%
- By 2040
- 587,297 · -5.3%
- By 2050
- 551,342 · -11.1%
- By 2075
- 472,934 · -23.8%
- By 2100
- 381,534 · -38.5%
Race, ethnicity, and origin ACS 2023
- Neighborhood character
- Predominantly White (73%)
- Race & ethnicity
- White 73% Hispanic / Latino 16% Two or more races 10% Black 4% Asian 3%
- Hispanic origin (detail)
- Mexican 3% Puerto Rican 5% Cuban 1% Dominican 2%
- Common ancestry
- Romanian 6% Scotch-Irish 2% Lithuanian 1%
- Foreign-born
- 13% · Canada, Jamaica, China
- Languages at home
- 83% English-only · Spanish 10% Other Indo-European 2% Russian/Polish/Slavic 2%
Political lean MEDSL · Monmouth
- 2024 margin
- R (+11.4) · D 43.4% · R 54.8% · Other 1.8%
- 2008→2024 swing
- -7.7pp toward R · 2008: -3.7pp · 2024: -11.4pp
- All cycles
- 2024: R+11.4 2020: R+2.8 2016: R+9.5 2012: R+5.5 2008: R+3.7
Not yet ingested
- Civics
- —
Market trends
- HPI YoY
- ▼ -303.76%
- Current HPI
- 375.492
- Rent YoY
- ▲ 1.52%
- Metro
- New York-Newark-Jersey City, NY-NJ-PA
- State GDP YoY
- ▲ 2.05%
- F500 in state
- 34
Industry mix (Fortune 500 HQ in NJ)
| Industry | F500 HQs | Revenue |
|---|---|---|
| Consumer Goods | 3 | $31B |
|
||
| Pharmaceuticals | 2 | $153B |
|
||
| Technology | 2 | $21B |
|
||
| Insurance | 2 | $20B |
|
||
| Healthcare | 2 | $19B |
|
||
| Financial Services | 1 | $70B |
|
||
Price history
1 event — show timeline
- 2026-05-11 Listed $135,000 MOMLS
Cash-flow waterfall
monthlySold comps — $/sqft
last 12 mo · ≤1 miLoading sold comps…