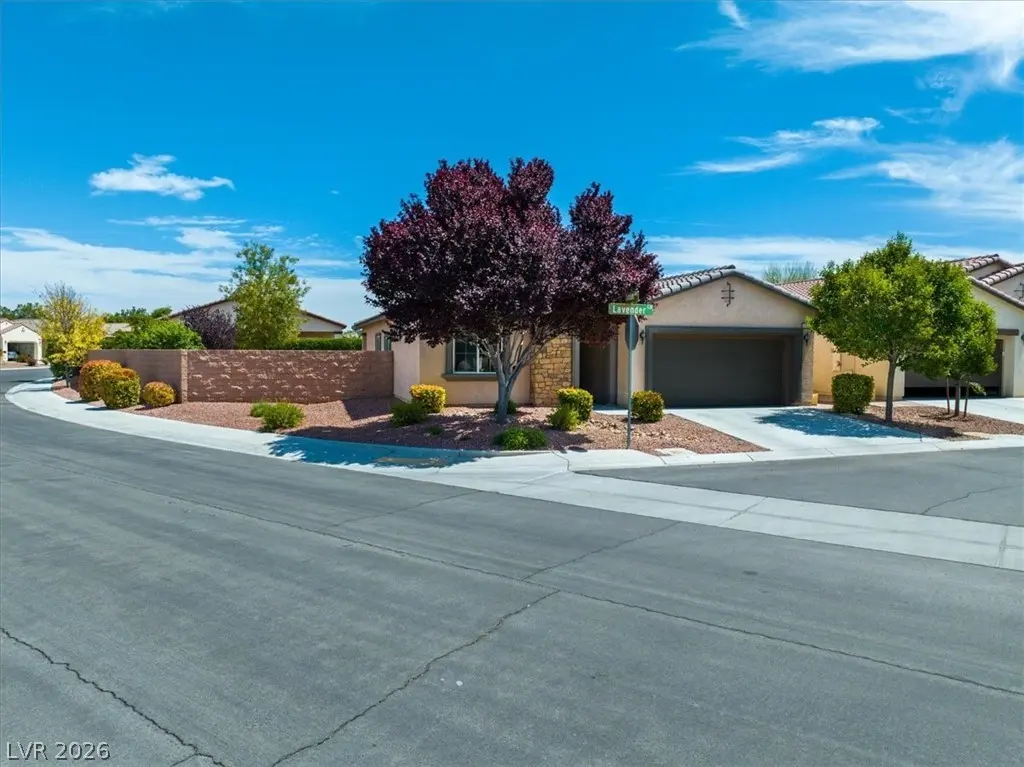
4387 Lavender Ln · Pahrump, NV
Flood risk 1/10 · Minimal
- FEMA flood zone
- X (unshaded)
- Chance of flooding over 30 yrs
- 0.0%
- Est. flood insurance / yr
- $507 – $1,088
Fire risk 2/10 · Minimal
- Est. fire insurance / yr
- $490 – $910
Heat risk 7/10 · Major
- Hot days now (above 102°F)
- 6 days/yr
- Hot days in 30 yrs
- 15 days/yr
Wind risk 1/10 · Minimal
- Chance of severe wind over 30 yrs
- —
Air-quality risk 2/10 · Minimal
- Unhealthy air days now
- 0 days/yr
- Unhealthy air days in 30 yrs
- 1 days/yr
Risk factors via First Street. Map © Google.
Why this score? — see what drove the D- grade
The composite is a weighted blend of 9 inputs, each scored 0–100. Each bar is that input's sub-score; the figure is the points it added to the 100-point composite (weight × sub-score).
- ARV discount +11.1/15.0
- Cash flow +7.2/30.0
- Appreciation +6.4/10.0
- Livability +3.4/5.0
- Rent growth +2.5/5.0
- Condition / age +2.5/5.0
- Schools +2.2/10.0
- 1% rule +1.6/10.0
- DSCR +1.4/10.0
$315,000
🖨 Deal sheet 📄 Offer letter ✓ Due diligence
Listing remarks
Beautiful move-in ready home on a premium oversized corner lot directly across from the park in beautiful Mountain Falls! This highly desirable 2-bedroom, 2-bath + den floor plan offers approximately 1,533 sq. ft. of comfortable living space with a spacious great room design and an attached 2-car garage. Recently refreshed with full interior paint, exterior touch-up paint, and brand-new carpet, this home shows pride of ownership throughout. A stunning view of Mount Charleston right from the kitchen window, the very feature that made this home so special to the original owner. The backyard, featuring a full-length covered patio, grass area, mature peach and pomegranate trees, and raised vege
Key facts
- 8,712 sq ft lot
- 2 garage spots
- Community pool
Property features AI
Finance
- HOA & community: Homeowners association (Mountain Falls); HOA fee $110 monthly; HOA covers association management, common areas, taxes; Community amenities include clubhouse, fitness center, golf course, pool, spa/hot tub
Exterior
- Parking: Attached finished garage; 2-car garage; Inside entrance from garage; Open parking available
- Utilities: Electricity available; No photovoltaics; Public water; Public sewer
- Home design: Single-family home; Single-story; Faces west; Resale property; Has a view
- Construction: Tile roof; Resale construction
- Exterior features: Covered patio; Patio; Sprinkler/irrigation system; Drip irrigation/bubblers in yard; Desert landscaping; Fruit trees; Garden; Sprinklers in rear; Landscaped backyard; Block fencing in back yard; Community pool
Interior
- Kitchen: Granite countertops; Kitchen island; Breakfast bar/counter; Tile flooring in kitchen; Dishwasher; Electric range; Disposal; Microwave; Refrigerator
- Bedrooms: 3 bedrooms (one primary suite downstairs)
- Flooring: Carpet; Ceramic tile
- Bathrooms: 2 full bathrooms; Primary bath with double sink and shower; Secondary bath with shower only
- Heating & cooling: Central heating (electric); Central air conditioning (electric)
- Interior features: Double-pane windows; Bedroom on main level; Primary bedroom downstairs
- Laundry & utility: Laundry room; Washer and dryer included; Electric dryer hookup
Neighborhood map
What this means for you Summary
Snapshot
- This is a 2-bed/2.0-bath single-family listed at $315k.
Deal economics
- At list price, monthly cash flow is $-433 ($-5k/yr) — negative.
- To cash-flow at today's rent, offer at most $239k (24.3% below list).
- To meet the 1% rule (rent ≥ 1% of price), the offer needs to be $209k (33.5% below list).
- Recommended offer: $209k (33.5% below list) — sets the bar for 1% rule.
- Cap rate 4.6% vs local median 3.4% in Pahrump — top-decile yield for the area; either an underpriced asset or a hidden risk that comps aren't pricing in. Stress-test before assuming the spread holds.
Location & tenants
- Location reads 68/100 on livability (#30 in NV) — a middle-class / working-renter tenant base. Strengths: cost of living A+, housing A+, health & safety A+; Watch: employment D, schools F, crime F.
- Nye County School District (rural): math 20% / reading 33% proficiency, ranked #16 of 17 in NV (top 94%) — low school quality limits family demand, transient renter base, plan for 1-2y turnover.
- Market conditions: 281 active listings in the ZIP; 8 comparable units currently listed for rent nearby; rentals at typical pace (median 24d on market — plan ~3-4 weeks tenant-placement turnaround); solid renter incomes.
- This rent runs 32% of the median local income ($78k/yr) — at the standard rent-burdened threshold; future hikes will face affordability resistance.
Forward outlook
- In year one you build about $11k of equity ($2k loan paydown + $9k appreciation (2.8% local appreciation)).
- Nye County population projected at -28% by 2050 — secular population decline; favor cash flow + early exit over multi-decade hold.
- By year 4, paydown + projected appreciation supports a ~$37k cash-out refi (75% LTV) — recoverable capital for the next deal without selling this one.
Negotiation context
- It's been on market 43 days — a 3% lower offer ($306k) is reasonable based on typical stale-listing flexibility.
Risks & watch-outs
- Climate carrying-cost: extreme-heat days projected 6→15/yr by 2055 (HVAC capex compounding) — expect insurance premiums to compound above CPI over the hold.
Questions for the listing agent
- What do current leases actually rent for vs. the listed asking? Can we see a recent rent roll and the last 12 months of T-12 income?
- It's been on market 43 days. Have you received any prior offers? Is the seller open to a 34% concession, seller financing, or rate buy-down credit?
- What does the HOA fee cover, when was the last increase, and are there any pending special assessments or reserve-fund shortfalls?
- Is there a deadline driving the sale (1031 exchange, divorce, estate, relocation)? That informs how much negotiation room exists.
- Schools are F-rated, which usually means shorter tenancies and higher turnover. Who's the typical renter profile here, and what's been the actual vacancy rate?
- Crime grade is F in this area — have there been break-ins, vandalism, or insurance claims at this property in the last 3 years? What carrier currently insures it and at what premium?
- The area grade is low — what's the realistic commute time and amenity access for the typical tenant pool here? Any planned neighborhood developments (good or bad) we should know about?
- What's the average days-on-market for RENTAL listings here right now (not sales)? A rising rental-DOM trend means longer vacancies and softer asking-rent achievability than the comps imply.
- What's the recent tenant-quality profile in this submarket — average credit score on applications, eviction rate, late-payment / NSF rate, and stable-employment percentage? A property-management company in the area should have these aggregated.
- How much new for-sale + rental construction is in the pipeline within 1–3 miles? Heavy new supply typically softens prices + rents 12–24 months out; constrained supply supports both.
Investment metrics
- 1% rule
- 0.66% ✗
- Cap rate
- 4.64%
- Cash-on-cash
- -5.89%
- DSCR
- 0.74
- GRM
- 12.5
CMA / ARV
- ARV (median comp)
- $342,576
- List price
- $315,000
- Delta
- -8.05%
- Verdict
- FAIR
- Comps
- 20 within 1.0 mi
Show comp detail 12 sales within ~0.75 mi
| Address | Dist | Beds/Ba | Sqft | Sold | Price | $/sf | Match |
|---|---|---|---|---|---|---|---|
| 5200 Lilia Ave | 0.11mi | 3/2.0 (+1) | 1,533 (0%) | 2mo | $300,000 | $196 | 88 |
| 4454 Luciano Ave | 0.28mi | 3/1.5 (+1) | 1,533 (0%) | 1mo | $315,000 | $205 | 79 |
| 5341 E La Campana Dr | 0.33mi | 3/2.0 (+1) | 1,533 (0%) | 2mo | $335,000 | $219 | 78 |
| 5067 Semifonte Dr | 0.26mi | 2/2.0 | 1,396 (-9%) | 3mo | $300,000 | $215 | 70 |
| 4860 Prato Way | 0.57mi | 3/2.0 (+1) | 1,546 (+1%) | 2mo | $321,000 | $208 | 65 |
| 4732 S Adriano Way | 0.51mi | 2/2.0 | 1,451 (-5%) | 3mo | $290,000 | $200 | 65 |
| 5495 Finestra St | 0.56mi | 3/2.0 (+1) | 1,611 (+5%) | 3mo | $305,000 | $189 | 58 |
| 5776 E Badlands Ln | 0.50mi | 3/2.0 (+1) | 1,681 (+10%) | 3mo | $290,000 | $173 | 53 |
| 4830 Lorenzo Way | 0.41mi | 3/2.0 (+1) | 1,757 (+15%) | 1mo | $299,900 | $171 | 51 |
| 4465 Golden Horizon St | 0.72mi | 3/2.5 (+1) | 1,724 (+12%) | 1mo | $361,185 | $210 | 38 |
| 4475 Golden Horizon St | 0.73mi | 3/2.5 (+1) | 1,724 (+12%) | 1mo | $375,000 | $218 | 38 |
| 4455 Golden Horizon St | 0.74mi | 3/2.5 (+1) | 1,724 (+12%) | 2mo | $384,160 | $223 | 36 |
Match score weights: distance 35% · size 25% · config 20% · recency 20%. Top-matched comps best support the ARV.
Projected returns pro-forma
2.78% appreciation · 3.0% rent growth · sell at horizon
- IRR
- 1.4%
- Equity multiple
- 1.08×
- Total profit
- $6,769
- Equity at exit
- $137,830
- IRR
- 5.1%
- Equity multiple
- 1.76×
- Total profit
- $67,245
- Equity at exit
- $209,498
Cash invested: $88,200 (down + closing). Projections, not guarantees.
Landlord ↔ Tenant lean methodology
- Overall (STATE)
- 71 Landlord-Friendly
- State Nevada
- 71 Landlord-Friendly · R+1
- County
- — inherits STATE
- City
- — inherits STATE
ZIP-level market 89061
- Home prices YoY
- 1.1%
- Active inventory
- 281
- Price-to-rent
- 12.5×
Monthly cashflow live
- Estimated rent
- $2,094 high interval (Pro) →
- Mortgage (P&I)
- −$1,652
- Tax from tax record
- −$194 /mo · $2,330/yr
- Insurance
- −$131
- HOA
- −$110
- Vacancy / Maint / Mgmt
- −$440
- Net cashflow
- $-433
Break-even live
UW: 25.0% down · 7.5% · 30yr · 1.5% tax · 5.0% vac · 8.0% maint · 8.0% mgmt
Financing live
Cash to close
- Down payment
- $78,750
- Closing costs
- $9,450
- Reserves months
- —
- Total cash needed
- —
Loan-product check · same deal, 3 products live
Conventional
25% down · 7.5% · 30yr
- Down + closing
- —
- Monthly P&I
- —
- Monthly cashflow
- —
- DSCR
- —
- Eligible?
- —
Personal DTI + credit; lowest rate.
DSCR
20% down · 8.5% · 30yr
- Down + closing
- —
- Monthly P&I
- —
- Monthly cashflow
- —
- DSCR
- —
- Eligible?
- —
No personal income docs; deal must DSCR.
Hard money
10% down · 12.0% · 12mo
- Down + closing
- —
- Monthly P&I
- —
- Monthly cashflow
- —
- DSCR
- —
- Eligible?
- —
Short-term bridge; refi at stabilization.
Rent comps 8 comps
| Address | Beds | Baths | Sqft | Rent | $/sqft | DOM | Units | Dist |
|---|---|---|---|---|---|---|---|---|
| 5190 Lignum Ave Pahrump, NV | 2.0 | 2.0 | 1833 | $2,100 | $1.15 | 17d | 1 | 0.12mi |
| 5485 San Pietro Dr Pahrump, NV | 3.0 | 2.0 | 1533 | $2,200 | $1.44 | 23d | 1 | 0.41mi |
| 5776 E Badlands Ln Pahrump, NV | 3.0 | 2.0 | 1681 | $1,995 | $1.19 | 23d | 1 | 0.49mi |
| 5406 Carrara Pointe St Pahrump, NV | 3.0 | 2.0 | 1772 | $2,000 | $1.13 | 7d | 1 | 0.58mi |
| 4881 Castello Way Pahrump, NV | 3.0 | 2.0 | 1772 | $2,035 | $1.15 | 20d | 1 | 0.68mi |
| 4921 Novelli Pl Pahrump, NV | 3.0 | 2.0 | 1451 | $2,050 | $1.41 | 43d | 1 | 0.70mi |
| 5720 Al Fresco Ave Pahrump, NV | 3.0 | 2.0 | 2245 | $2,350 | $1.05 | 23d | 1 | 0.77mi |
| 5980 Drosetta Ave Pahrump, NV | 2.0 | 2.0 | 1511 | $2,195 | $1.45 | 23d | 1 | 0.77mi |
HOA detail
- Monthly dues
- $110 · $1,320/yr
Listing history 19 events
-
2026-06-19days on market $315,000 Active 43 DOM
-
2026-06-18days on market $315,000 Active 42 DOM
-
2026-06-17days on market $315,000 Active 41 DOM
-
2026-06-17price $315,000 Active 40 DOM
-
2026-06-16days on market $319,000 Active 40 DOM
-
2026-06-15days on market $319,000 Active 39 DOM
-
2026-06-14days on market $319,000 Active 37 DOM
-
2026-06-12days on market $319,000 Active 36 DOM
-
2026-06-09days on market $319,000 Active 33 DOM
-
2026-06-08days on market $319,000 Active 32 DOM
-
2026-06-07days on market $319,000 Active 31 DOM
-
2026-06-03days on market $319,000 Active 27 DOM
-
2026-06-02days on market $319,000 Active 26 DOM
-
2026-06-01days on market $319,000 Active 25 DOM
-
2026-05-31days on market $319,000 Active 24 DOM
-
2026-05-30days on market $319,000 Active 23 DOM
-
2026-05-07$325,000 Active 977-char remark
-
2013-07-10soldstatus $575,000
-
2012-07-25soldstatus $702,125
ⓘ Source: listings_history table (triggers on properties + properties_extension) + one-shot
backfill from property_details.listing_events for pre-trigger history.
Tax reassessment forecast NV · Resets to sale price
- Current annual tax
- $2,330 · $194/mo
- Projected year-2 tax
- $2,330 · $194/mo
- Expected delta
- $0/yr ($0/mo · 0.0%)
ⓘ Screening estimate from a state-policy table — verify with the county assessor before closing.
Climate risk First Street
- Flood 1/10 Low FEMA zone X (unshaded) · 0% chance over 30 yrs
- Wildfire 2/10 Low
- Heat 7/10 Severe 6 d/yr ≥102°F today · 15 d/yr by 30 yrs out
- Wind 1/10 Low
- Air quality 2/10 Low 0 unhealthy d/yr today · 1 by 30 yrs out
Nearby sold comps map
Loading sold comps map…
Walkable amenities ~0.75 mi
Loading nearby amenities…
Taxation est. · year 1
- Rental income
- $25,129
- − Mortgage interest
- −$17,645
- − Property taxes
- −$2,330
- − Insurance
- −$1,575
- − Repairs & maintenance
- −$2,010
- − Management
- −$2,010
- − HOA
- −$1,320
- − Depreciation
- −$9,164
- Taxable loss
- −$10,925
- Est. tax savings @ 24.0%
- +$2,622
- After-tax cash flow
- $-2,573/yr
For passive investors: Depreciation is non-cash, so a rental often shows a tax loss while cash-flowing — sheltering income. Rental losses are passive: they offset passive income freely, and up to $25,000/yr can offset ordinary (W-2) income if you actively participate and your MAGI is under $100k (phasing out to $0 by $150k); unused losses carry forward. On sale, claimed depreciation is recaptured at up to 25%, and gains may owe capital-gains tax (a 1031 exchange can defer both). Figures are a year-1 estimate at your 24.0% rate — not tax advice; consult a CPA.
Schools (NCES district)
- District
- Nye County School District
- NCES district ID
- 3200360
- Math proficiency
- 20% ▼ -6.00%
- Reading proficiency
- 33% ▼ -5.00%
- Median HH income
- $41,447
- Composite
- 22.43/100
- National rank
- #8110
- State rank
- #16 of 17 in NV
Livability — Pahrump
- Score
- 68/100
- State rank
- #30
- US rank
- #9226
Category grades
Schools grade is shown separately in the Schools card above.
Census & demographics
- Census place
- Pahrump, NV
- County
- Nye County · 47,491 people
- City population
- 47,491
- Metro
- Pahrump, NV
- Population (ZIP)
- 8,141
- Household income
- $77,991
- Rent vs Own
- Severe rent burden
- 52.0
Population outlook (Nye County) Hauer SSP2
- Today (2025)
- 40,727 people
- By 2030
- 38,812 · -4.7%
- By 2040
- 33,952 · -16.6%
- By 2050
- 29,393 · -27.8%
- By 2075
- 21,122 · -48.1%
- By 2100
- 14,400 · -64.6%
Race, ethnicity, and origin ACS 2023
- Neighborhood character
- Predominantly White (67%)
- Race & ethnicity
- White 67% Hispanic / Latino 18% Two or more races 8% Asian 2% Black 2% Native American 2% Pacific Islander 1%
- Hispanic origin (detail)
- Mexican 15% Puerto Rican 1%
- Common ancestry
- Lithuanian 5% Romanian 2% Portuguese 2%
- Foreign-born
- 6% · Canada
- Languages at home
- 90% English-only · Spanish 7% Other Asian/Pacific 1% Other Indo-European 1%
Political lean MEDSL · Nye
- 2024 margin
- Solid R (+42.2) · D 28.0% · R 70.2% · Other 1.8%
- 2008→2024 swing
- -28.8pp toward R · 2008: -13.4pp · 2024: -42.2pp
- All cycles
- 2024: R+42.2 2020: R+40.4 2016: R+42.0 2012: R+24.2 2008: R+13.4
Not yet ingested
- Civics
- —
Market trends
- HPI YoY
- ▲ 2.78%
- Current HPI
- 266.2633
- Rent YoY
- —
- Metro
- Pahrump, NV
- State GDP YoY
- ▲ 3.08%
- F500 in state
- 6
Industry mix (Fortune 500 HQ in NV)
| Industry | F500 HQs | Revenue |
|---|---|---|
| Hotels / Casinos | 3 | $36B |
|
||
Price history
-55.1% since first listed5 events — show timeline
- 2026-06-16 Price Changed $315,000 GLVAR
- 2026-05-19 Price Changed $319,000 GLVAR
- 2026-05-07 Listed $325,000 GLVAR
- 2013-07-10 Sold (Public Records) $575,000 Public Records
- 2012-07-25 Sold (Public Records) $702,125 Public Records
Property tax history
+2.9%/yrLatest (2025): $2,330 · +3.2% YoY. Source: county tax records.
Cash-flow waterfall
monthlySold comps — $/sqft
last 12 mo · ≤1 miLoading sold comps…