 🏗️ New Construction
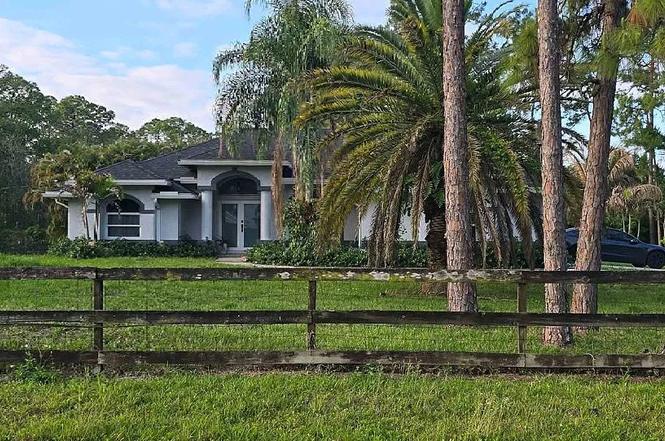
17146 87th Ln Ln N · The Acreage, FL
Flood risk 1/10 · Minimal
- FEMA flood zone
- X (unshaded)
- Chance of flooding over 30 yrs
- 0.0%
- Est. flood insurance / yr
- $507 – $1,088
Fire risk 3/10 · Minor
- Est. fire insurance / yr
- $947 – $1,759
Heat risk 9/10 · Severe
- Hot days now (above 108°F)
- 7 days/yr
- Hot days in 30 yrs
- 25 days/yr
Wind risk 10/10 · Severe
- Chance of severe wind over 30 yrs
- 99.0%
Air-quality risk 2/10 · Minimal
- Unhealthy air days now
- 1 days/yr
- Unhealthy air days in 30 yrs
- 2 days/yr
Risk factors via First Street. Map © Google.
Why this score? — see what drove the F grade
The composite is a weighted blend of 9 inputs, each scored 0–100. Each bar is that input's sub-score; the figure is the points it added to the 100-point composite (weight × sub-score).
- Cash flow +7.5/30.0
- ARV discount +7.5/15.0
- Rent growth +4.4/5.0
- Schools +4.3/10.0
- Livability +3.4/5.0
- Condition / age +2.5/5.0
- 1% rule +2.2/10.0
- DSCR +1.6/10.0
- Appreciation +0.0/10.0
$5,000
🖨 Deal sheet 📄 Offer letter ✓ Due diligence
Listing remarks MLS
Create value and equity for this 3/2/2 CBS home on paved road on 1+ acres with privacy. Split floor plan with family room and screened patio under roof. Laundry room inside with tile floor in the living, family, formal dining, and kitchen. As-is sale. Well and HVAC system not operating.
Key facts
- 2 garage spots
- Built 1996
- Listed 4 days
Property features AI
Finance
- Other: Directions: Near Northlake Blvd and Seminole Pratt Whitney Road; Seminole Pratt Whitney Road to Hamlin Blvd, head west to Mandarin Blvd, go south on Mandarin Blvd to 87th Lane, go east on 87th Lane — home is a few blocks to the right.
Exterior
- Parking: 2-car garage
- Home design: Residential property; 1 story
- Exterior features: 1.15-acre lot; Zoned AR
Interior
- Bathrooms: 2 full bathrooms
- Interior features: Single-story layout
Neighborhood map
What this means for you Summary
Snapshot
- This is a 4-bed/2.0-bath single-family listed at $5k.
Deal economics
- At list price, monthly cash flow is $-759 ($-9k/yr) — negative.
- The deal already cash-flows at list — no discount required.
- Meets the 1% rule at list price ($4k rent vs $5k).
Location & tenants
- Location reads 67/100 on livability (#550 in FL) — a middle-class / working-renter tenant base. Strengths: crime A+, employment A+, housing A+; Watch: amenities F, commute F, cost of living F.
- Palm Beach (suburban): math 46% / reading 53% proficiency, ranked #34 of 73 in FL (top 47%) — families likely to look elsewhere, expect single-tenant / working-renter base with shorter leases.
- Market conditions: Rents rising fast (+7.7%/yr); 594 active listings in the ZIP; 1 comparable units currently listed for rent nearby; high-income renter base; 3,974 units permitted in Palm Beach County in 2024 (1,012 in 5+ unit buildings).
- This rent runs 43% of the median local income ($122k/yr) — at the standard rent-burdened threshold; future hikes will face affordability resistance.
Forward outlook
- Local home prices are declining (-3.0%/yr); year-one equity from $4k of loan paydown is wiped out by about $18k of value loss. Plan a longer hold.
- Palm Beach County population projected at +30% by 2050 — long-run rental-demand tailwind backs the buy-and-hold thesis.
Negotiation context
- Only 4 days on market — expect competitive offers; lowballing is unlikely to land.
- 8 sale attempts since 28y ago with the ask held roughly flat each time — persistent listings suggest the price (not the market) is what's stuck; bring a comps-based counter.
Risks & watch-outs
- Watch-outs: property tax is 182.5% of price.
- Climate carrying-cost: severe wind risk, 99% chance of damaging wind over 30y; extreme-heat days projected 7→25/yr by 2055 (HVAC capex compounding) — expect insurance premiums to compound above CPI over the hold.
Questions for the listing agent
- What do current leases actually rent for vs. the listed asking? Can we see a recent rent roll and the last 12 months of T-12 income?
- Property tax is high relative to price — has the assessment been appealed recently, and will the sale trigger a re-assessment?
- Is there a deadline driving the sale (1031 exchange, divorce, estate, relocation)? That informs how much negotiation room exists.
- Schools are B-rated — typically a magnet for longer-tenancy family renters. What's the average tenant stay here, and is there a school-zone premium baked into asking?
- The area grade is low — what's the realistic commute time and amenity access for the typical tenant pool here? Any planned neighborhood developments (good or bad) we should know about?
- What's the average days-on-market for RENTAL listings here right now (not sales)? A rising rental-DOM trend means longer vacancies and softer asking-rent achievability than the comps imply.
- What's the recent tenant-quality profile in this submarket — average credit score on applications, eviction rate, late-payment / NSF rate, and stable-employment percentage? A property-management company in the area should have these aggregated.
- How much new for-sale + rental construction is in the pipeline within 1–3 miles? Heavy new supply typically softens prices + rents 12–24 months out; constrained supply supports both.
Investment metrics
- 1% rule
- 0.72% ✗
- Cap rate
- 4.80%
- Cash-on-cash
- -5.34%
- DSCR
- 0.76
- GRM
- 11.6
CMA / ARV
- ARV (on-the-fly)
- $608,316
- Comps found
- 1
Show comp detail 1 sale within ~0.75 mi
| Address | Dist | Beds/Ba | Sqft | Sold | Price | $/sf | Match |
|---|---|---|---|---|---|---|---|
| 17354 90th St N | 0.44mi | 4/2.0 | 2,057 (+10%) | 16mo | $670,000 | $326 | 49 |
Match score weights: distance 35% · size 25% · config 20% · recency 20%. Top-matched comps best support the ARV.
Projected returns pro-forma
-3.0% appreciation · 7.68% rent growth · sell at horizon
- IRR
- -20.3%
- Equity multiple
- 0.26×
- Total profit
- $-125,318
- Equity at exit
- $90,702
- IRR
- -5.6%
- Equity multiple
- 0.57×
- Total profit
- $-73,853
- Equity at exit
- $52,596
Cash invested: $170,328 (down + closing). Projections, not guarantees.
Landlord ↔ Tenant lean methodology
- Overall (STATE)
- 87 Strongly Landlord-Friendly
- State Florida
- 87 Strongly Landlord-Friendly · R+3
- County
- — inherits STATE
- City
- — inherits STATE
ZIP-level market 33470
- Home prices YoY
- -23.3%
- Rents YoY
- 7.7%
- Active inventory
- 594
- Price-to-rent
- 0.1×
Monthly cashflow live
- Estimated rent
- $4,361 medium interval (Pro) →
- Mortgage (P&I)
- −$3,190
- Tax est. 1.5%
- −$760 /mo · $9,125/yr
- Insurance
- −$253
- HOA
- −$0
- Vacancy / Maint / Mgmt
- −$916
- Net cashflow
- $-759
Break-even live
UW: 25.0% down · 7.5% · 30yr · 1.5% tax · 5.0% vac · 8.0% maint · 8.0% mgmt
Financing live
Cash to close
- Down payment
- $152,079
- Closing costs
- $18,249
- Reserves months
- —
- Total cash needed
- —
Loan-product check · same deal, 3 products live
Conventional
25% down · 7.5% · 30yr
- Down + closing
- —
- Monthly P&I
- —
- Monthly cashflow
- —
- DSCR
- —
- Eligible?
- —
Personal DTI + credit; lowest rate.
DSCR
20% down · 8.5% · 30yr
- Down + closing
- —
- Monthly P&I
- —
- Monthly cashflow
- —
- DSCR
- —
- Eligible?
- —
No personal income docs; deal must DSCR.
Hard money
10% down · 12.0% · 12mo
- Down + closing
- —
- Monthly P&I
- —
- Monthly cashflow
- —
- DSCR
- —
- Eligible?
- —
Short-term bridge; refi at stabilization.
Rent comps 1 comps
| Address | Beds | Baths | Sqft | Rent | $/sqft | DOM | Units | Dist |
|---|---|---|---|---|---|---|---|---|
| 15845 83rd Ln N Loxahatchee, FL | 3.0 | 2.0 | 1850 | $3,999 | $2.16 | 18d | 1 | 1.39mi |
Listing history 5 events
-
2026-06-18days on market $5,000 Active 4 DOM
-
2026-06-17days on market $5,000 Active 3 DOM
-
2026-06-16days on market $5,000 Active 2 DOM
-
2026-06-15remarks 311-char remark
-
2026-06-15$5,000 Active 1 DOM
ⓘ Source: listings_history table (triggers on properties + properties_extension) + one-shot
backfill from property_details.listing_events for pre-trigger history.
Climate risk First Street
- Flood 1/10 Low FEMA zone X (unshaded) · 0% chance over 30 yrs
- Wildfire 3/10 Moderate
- Heat 9/10 Extreme 7 d/yr ≥108°F today · 25 d/yr by 30 yrs out
- Wind 10/10 Extreme 99% chance of damaging wind over 30 yrs
- Air quality 2/10 Low 1 unhealthy d/yr today · 2 by 30 yrs out
Nearby sold comps map
Loading sold comps map…
Walkable amenities ~0.75 mi
Loading nearby amenities…
Taxation est. · year 1
- Rental income
- $52,334
- − Mortgage interest
- −$34,075
- − Property taxes
- −$9,125
- − Insurance
- −$3,042
- − Repairs & maintenance
- −$4,187
- − Management
- −$4,187
- − Depreciation
- −$17,696
- Taxable loss
- −$19,977
- Est. tax savings @ 24.0%
- +$4,795
- After-tax cash flow
- $-4,309/yr
For passive investors: Depreciation is non-cash, so a rental often shows a tax loss while cash-flowing — sheltering income. Rental losses are passive: they offset passive income freely, and up to $25,000/yr can offset ordinary (W-2) income if you actively participate and your MAGI is under $100k (phasing out to $0 by $150k); unused losses carry forward. On sale, claimed depreciation is recaptured at up to 25%, and gains may owe capital-gains tax (a 1031 exchange can defer both). Figures are a year-1 estimate at your 24.0% rate — not tax advice; consult a CPA.
Schools (NCES district)
- District
- Palm Beach
- NCES district ID
- 1201500
- Math proficiency
- 46% ▼ -16.00%
- Reading proficiency
- 53% ▼ -4.00%
- Median HH income
- $53,943
- Composite
- 42.72/100
- National rank
- #3160
- State rank
- #34 of 73 in FL
Livability — The Acreage
- Score
- 67/100
- State rank
- #550
- US rank
- #10381
Category grades
Schools grade is shown separately in the Schools card above.
Census & demographics
- Census place
- The Acreage, FL
- County
- Palm Beach County · 1,438,312 people
- Metro
- Miami-Fort Lauderdale-Pompano Beach, FL
- Population (ZIP)
- 35,610
- Household income
- $122,163
- Rent vs Own
- Severe rent burden
- 43.0
Population outlook (Palm Beach County) Hauer SSP2
- Today (2025)
- 1,637,487 people
- By 2030
- 1,743,255 · +6.5%
- By 2040
- 1,948,712 · +19.0%
- By 2050
- 2,132,979 · +30.3%
- By 2075
- 2,530,027 · +54.5%
- By 2100
- 2,706,979 · +65.3%
Race, ethnicity, and origin ACS 2023
- Neighborhood character
- Diverse neighborhood (Simpson 0.58)
- Race & ethnicity
- White 59% Hispanic / Latino 24% Two or more races 16% Black 10% Asian 2%
- Hispanic origin (detail)
- Mexican 2% Puerto Rican 5% Cuban 6% Dominican 2%
- Common ancestry
- Lithuanian 3% Romanian 2% Italian 2%
- Foreign-born
- 19% · Canada, Jamaica
- Languages at home
- 77% English-only · Spanish 18% French/Haitian/Cajun 2% Other Indo-European 1%
Political lean MEDSL · Palm Beach
- 2024 margin
- Toss-up / Even · D 50.0% · R 49.2%
- 2008→2024 swing
- -22.1pp toward R · 2008: 22.9pp · 2024: 0.8pp
- All cycles
- 2024: D+0.8 2020: D+12.8 2016: D+15.3 2012: D+17.0 2008: D+22.9
Not yet ingested
- Civics
- —
Market trends
- HPI YoY
- ▼ -124.68%
- Current HPI
- 410.2689
- Rent YoY
- ▲ 7.68%
- Metro
- Miami-Fort Lauderdale-Pompano Beach, FL
- State GDP YoY
- ▲ 3.28%
- F500 in state
- 36
Industry mix (Fortune 500 HQ in FL)
| Industry | F500 HQs | Revenue |
|---|---|---|
| Industrial Technology | 2 | $29B |
|
||
| Insurance | 2 | $17B |
|
||
| Retail | 1 | $60B |
|
||
| Technology Distribution | 1 | $58B |
|
||
| Homebuilding | 1 | $35B |
|
||
| Technology Manufacturing | 1 | $35B |
|
||
Price history
-60.0% since first listed25 events — show timeline
- 2026-06-14 Listed $5,000 NFMLS
- 2017-11-21 Sold (Public Records) $272,000 Public Records
- 2017-11-13 Sold (MLS) $272,000 MARMLS
- 2017-08-11 Pending — MARMLS
- 2017-07-31 Listed $270,000 MARMLS
- 2016-12-21 Listing Removed — Beaches MLS
- 2016-10-20 Price Changed $275,000 Beaches MLS
- 2016-08-30 Price Changed $340,000 Beaches MLS
- 2016-08-30 Relisted — Beaches MLS
- 2016-08-22 Contingent — Beaches MLS
- 2016-08-08 Price Changed $250,000 Beaches MLS
- 2016-06-22 Listed $429,000 Beaches MLS
- 2013-09-21 Listing Removed — Beaches MLS
- 2010-06-30 Listing Removed — Beaches MLS
- 2010-05-16 Listed $197,000 Beaches MLS
- 2008-01-21 Listing Removed — Beaches MLS
- 2007-07-21 Listed $399,900 Beaches MLS
- 2006-12-21 Listed $475,000 Beaches MLS
- 2000-12-20 Sold (Public Records) $165,000 Public Records
- 1998-09-23 Sold (Public Records) $148,000 Public Records
- 1998-09-21 Sold (MLS) $148,000 Beaches MLS
- 1998-08-26 Listing Removed — Beaches MLS
- 1998-08-21 Listed $149,900 Beaches MLS
- 1994-10-26 Sold (Public Records) $12,500 Public Records
- 1985-08-01 Sold (Public Records) $12,500 Public Records
Property tax history
+8.7%/yrLatest (2025): $10,419 · +2.2% YoY. Source: county tax records.
Cash-flow waterfall
monthlySold comps — $/sqft
last 12 mo · ≤1 miLoading sold comps…