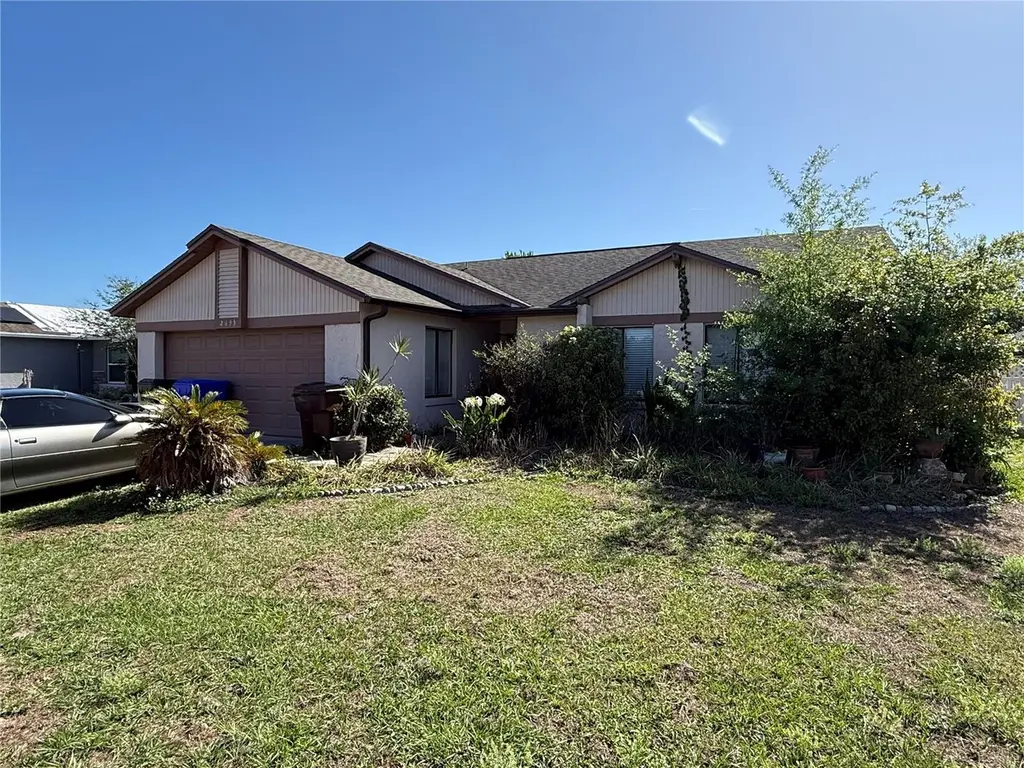
2633 Dixie Ln · Kissimmee, FL
Flood risk 1/10 · Minimal
- FEMA flood zone
- X (unshaded)
- Chance of flooding over 30 yrs
- 0.0%
- Est. flood insurance / yr
- $507 – $1,088
Fire risk 1/10 · Minimal
- Est. fire insurance / yr
- $947 – $1,759
Heat risk 9/10 · Severe
- Hot days now (above 108°F)
- 7 days/yr
- Hot days in 30 yrs
- 24 days/yr
Wind risk 9/10 · Severe
- Chance of severe wind over 30 yrs
- 99.0%
Air-quality risk 1/10 · Minimal
- Unhealthy air days now
- 0 days/yr
- Unhealthy air days in 30 yrs
- 0 days/yr
Risk factors via First Street. Map © Google.
Why this score? — see what drove the D+ grade
The composite is a weighted blend of 9 inputs, each scored 0–100. Each bar is that input's sub-score; the figure is the points it added to the 100-point composite (weight × sub-score).
- ARV discount +15.0/15.0
- Cash flow +14.3/30.0
- DSCR +4.3/10.0
- Livability +3.9/5.0
- Schools +3.6/10.0
- 1% rule +2.8/10.0
- Condition / age +2.5/5.0
- Rent growth +1.9/5.0
- Appreciation +0.0/10.0
$274,003
🖨 Deal sheet (PDF) 📄 Offer letter ✓ Due diligence
Listing remarks
Under contract-accepting backup offers. Spacious 3-bedroom, 2-bath home featuring high ceilings and an open, airy floor plan with generous living space perfect for everyday living and entertaining. The oversized primary suite offers a walk-in closet and plenty of room to relax. Enjoy outdoor living in the huge fenced backyard complete with a private pool and screened rear porch, ideal for year-round enjoyment. Additional features include a two-car garage and ample yard space for pets, play, or gardening. Conveniently located near shopping, dining, schools, and major roadways.
Key facts
- Open floor plan
- Private pool
- Walk-in closet
Tags
Property features AI
Finance
- Other: Private in-ground pool; Lot approximately 0.17 acres (65 x 115); Asphalt road frontage; Homestead exempt; Unfurnished
- HOA & community: No association
Exterior
- Parking: Attached garage (2 spaces)
- Utilities: Public water; Public sewer; Electricity connected; Water connected; Sewer connected
- Home design: Single family residence; One story; Northwest facing; Residential property
- Construction: Block and stucco construction; Shingle roof; Slab foundation; Built as single-story
- Exterior features: Dog run; Sidewalk
Interior
- Kitchen: Convection oven; Dishwasher; Disposal; Microwave
- Bedrooms: 3 bedrooms
- Flooring: Carpet; Ceramic tile
- Bathrooms: 2 full bathrooms
- Heating & cooling: Central heating; Central air conditioning
- Interior features: Ceiling fans
- Laundry & utility: Laundry in kitchen; Laundry closet
Neighborhood map
What this means for you Summary
Snapshot
- This is a 3-bed/2.0-bath single-family listed at $274k.
Deal economics
- At list price, monthly cash flow is $48 ($576/yr) — positive.
- The deal already cash-flows at list — no discount required.
- To meet the 1% rule (rent ≥ 1% of price), the offer needs to be $215k (21.5% below list).
- Recommended offer: $215k (21.5% below list) — sets the bar for 1% rule.
- Cap rate 6.5% vs local median 3.5% in Kissimmee — top-decile yield for the area; either an underpriced asset or a hidden risk that comps aren't pricing in. Stress-test before assuming the spread holds.
Location & tenants
- Location reads 77/100 on livability (#181 in FL, #2,841 nationally) — a middle-class / working-renter tenant base. Strengths: commute A+, housing A+, health & safety A+; Watch: crime D-, employment D-.
- Osceola (suburban): math 39% / reading 45% proficiency, ranked #60 of 73 in FL (top 82%) — families likely to look elsewhere, expect single-tenant / working-renter base with shorter leases; 60% free/reduced lunch — lower-income household profile, screen leases tightly.
- Zoned schools: Mill Creek Elementary School (math 42% / reading 40%, grade F, #1,454 of 2,144 statewide, top 69%, 752 students, 59% FRL); Denn John Middle School (math 28% / reading 30%, grade F, #479 of 571 statewide, top 84%, 873 students, 57% FRL); Gateway High School (math 26% / reading 39%, grade F, #411 of 667 statewide, top 62%, 1,726 students, 60% FRL) — zoned schools at 59% FRL track the district average.
- Market conditions: Rents soft (-2.5%/yr); 563 active listings in the ZIP; 40 comparable units currently listed for rent nearby; rentals at typical pace (median 17d on market — plan ~3-4 weeks tenant-placement turnaround); 8,813 units permitted in Osceola County in 2024 (3,072 in 5+ unit buildings).
- This rent runs 35% of the median local income ($75k/yr) — at the standard rent-burdened threshold; future hikes will face affordability resistance.
Forward outlook
- Local home prices are declining (-3.0%/yr); year-one equity from $2k of loan paydown is wiped out by about $8k of value loss. Plan a longer hold.
- Osceola County population projected at +73% by 2050 — long-run rental-demand tailwind backs the buy-and-hold thesis.
Negotiation context
- Only 4 days on market — expect competitive offers; lowballing is unlikely to land.
- Current owner paid $113k; list at $274k implies a 142% gain — meaningful room to come down on a strong offer.
Risks & watch-outs
- Climate carrying-cost: severe wind risk, 99% chance of damaging wind over 30y; extreme-heat days projected 7→24/yr by 2055 (HVAC capex compounding) — expect insurance premiums to compound above CPI over the hold.
Questions for the listing agent
- Is there a deadline driving the sale (1031 exchange, divorce, estate, relocation)? That informs how much negotiation room exists.
- Crime grade is D in this area — have there been break-ins, vandalism, or insurance claims at this property in the last 3 years? What carrier currently insures it and at what premium?
- The area grade is low — what's the realistic commute time and amenity access for the typical tenant pool here? Any planned neighborhood developments (good or bad) we should know about?
- What's the average days-on-market for RENTAL listings here right now (not sales)? A rising rental-DOM trend means longer vacancies and softer asking-rent achievability than the comps imply.
- What's the recent tenant-quality profile in this submarket — average credit score on applications, eviction rate, late-payment / NSF rate, and stable-employment percentage? A property-management company in the area should have these aggregated.
- How much new for-sale + rental construction is in the pipeline within 1–3 miles? Heavy new supply typically softens prices + rents 12–24 months out; constrained supply supports both.
Investment metrics
- 1% rule
- 0.78% ✗
- Cap rate
- 6.50%
- Cash-on-cash
- 0.75%
- DSCR
- 1.03
- GRM
- 10.6
CMA / ARV
- ARV (on-the-fly)
- $353,280
- Comps found
- 12
Show comp detail 12 sales within ~0.75 mi
| Address | Dist | Beds/Ba | Sqft | Sold | Price | $/sf | Match |
|---|---|---|---|---|---|---|---|
| 2629 Dixie Ln | 0.01mi | 3/2.0 | 1,405 (+10%) | 2mo | $342,000 | $243 | 82 |
| 1328 Mill Creek Pl | 0.46mi | 3/2.0 | 1,285 (+0%) | 4mo | $370,000 | $288 | 74 |
| 2458 Sable Dr | 0.44mi | 3/2.0 | 1,260 (-2%) | 5mo | $360,000 | $286 | 72 |
| 1436 Massa St | 0.35mi | 3/2.0 | 1,192 (-7%) | 2mo | $330,000 | $277 | 71 |
| 2519 Mill Run Blvd | 0.32mi | 3/2.0 | 1,174 (-8%) | 3mo | $349,000 | $297 | 69 |
| 2678 Forest View Ln | 0.39mi | 3/2.0 | 1,194 (-7%) | 2mo | $350,000 | $293 | 69 |
| 1526 Amherst Ln | 0.32mi | 3/2.0 | 1,393 (+9%) | 3mo | $360,000 | $258 | 68 |
| 1329 Cypress Arbor Pl | 0.26mi | 3/2.0 | 1,088 (-15%) | 2mo | $299,000 | $275 | 61 |
| 2195 Wind Jammer Ct | 0.64mi | 3/2.0 | 1,216 (-5%) | 2mo | $291,000 | $239 | 60 |
| 1437 Dean B St | 0.24mi | 3/2.0 | 1,088 (-15%) | 6mo | $290,000 | $267 | 59 |
| 2679 Forest View Ln | 0.42mi | 3/2.0 | 1,414 (+10%) | 6mo | $390,000 | $276 | 58 |
| 2931 Oaktree Dr | 0.58mi | 3/2.0 | 1,442 (+13%) | 2mo | $365,000 | $253 | 50 |
Match score weights: distance 35% · size 25% · config 20% · recency 20%. Top-matched comps best support the ARV.
Projected returns pro-forma
-3.0% appreciation · 0.0% rent growth · sell at horizon
- IRR
- -18.1%
- Equity multiple
- 0.38×
- Total profit
- $-47,763
- Equity at exit
- $40,855
- IRR
- -16.7%
- Equity multiple
- 0.19×
- Total profit
- $-62,486
- Equity at exit
- $23,691
Cash invested: $76,721 (down + closing). Projections, not guarantees.
Landlord ↔ Tenant lean methodology
- Overall (STATE)
- 87 Strongly Landlord-Friendly
- State Florida
- 87 Strongly Landlord-Friendly · R+3
- County
- — inherits STATE
- City
- — inherits STATE
ZIP-level market 34744
- Rents YoY
- -2.5%
- Active inventory
- 563
- Price-to-rent
- 10.6×
Monthly cashflow live
- Estimated rent
- $2,151 high interval (Pro) →
- Mortgage (P&I)
- −$1,437
- Tax from tax record
- −$100 /mo · $1,198/yr
- Insurance
- −$114
- HOA
- −$0
- Vacancy / Maint / Mgmt
- −$452
- Net cashflow
- $48
Break-even live
Sensitivity live
| Price | -10% $203 | -5% $126 | +0% $48 | +5% $-30 | +10% $-107 |
|---|---|---|---|---|---|
| Rent | -10% $-122 | -5% $-37 | +0% $48 | +5% $133 | +10% $218 |
| Rate | -1.0pp $186 | -0.5pp $118 | base $48 | +0.5pp $-23 | +1.0pp $-95 |
UW: 25.0% down · 7.5% · 30yr · 1.5% tax · 5.0% vac · 8.0% maint · 8.0% mgmt
Financing live
Cash to close
- Down payment
- $68,501
- Closing costs
- $8,220
- Reserves months
- —
- Total cash needed
- —
Loan-product check · same deal, 3 products live
Conventional
25% down · 7.5% · 30yr
- Down + closing
- —
- Monthly P&I
- —
- Monthly cashflow
- —
- DSCR
- —
- Eligible?
- —
Personal DTI + credit; lowest rate.
DSCR
20% down · 8.5% · 30yr
- Down + closing
- —
- Monthly P&I
- —
- Monthly cashflow
- —
- DSCR
- —
- Eligible?
- —
No personal income docs; deal must DSCR.
Hard money
10% down · 12.0% · 12mo
- Down + closing
- —
- Monthly P&I
- —
- Monthly cashflow
- —
- DSCR
- —
- Eligible?
- —
Short-term bridge; refi at stabilization.
Rent comps 40 comps
| Address | Beds | Baths | Sqft | Rent | $/sqft | DOM | Units | Dist |
|---|---|---|---|---|---|---|---|---|
| 2670 Oak Run Blvd Kissimmee, FL | 3.0 | 2.0 | 1530 | $2,450 | $1.60 | 16d | 1 | 0.47mi |
| 2875 Bay Ave Kissimmee, FL | 3.0 | 2.0 | 1344 | $1,900 | $1.41 | 19d | 1 | 0.54mi |
| 2875 Bay Ave Kissimmee, FL | 3.0 | 2.0 | 1344 | $1,900 | $1.41 | 15d | 1 | 0.54mi |
| 2936 Twin Oaks Dr Kissimmee, FL | 3.0 | 2.0 | 1641 | $2,150 | $1.31 | 16d | 1 | 0.54mi |
| 2426 Mill Run Blvd Kissimmee, FL | 3.0 | 2.0 | 1140 | $2,100 | $1.84 | 6d | 1 | 0.57mi |
| 2409 Brookside Ave Kissimmee, FL | 3.0 | 2.0 | 1839 | $2,306 | $1.25 | 18d | 1 | 0.63mi |
| 1751 Covey Ct Kissimmee, FL | 3.0 | 2.0 | 1377 | $2,425 | $1.76 | 25d | 1 | 0.77mi |
| 613 Carol Ter Kissimmee, FL | 3.0 | 1.0 | 1574 | $1,750 | $1.11 | 16d | 1 | 0.78mi |
| 2329 Pine Tree Ct Kissimmee, FL | 3.0 | 2.0 | 1612 | $2,300 | $1.43 | 16d | 1 | 0.86mi |
| 891 Florida Pkwy Kissimmee, FL | 4.0 | 3.0 | 1812 | $2,100 | $1.16 | 25d | 1 | 0.90mi |
| 621 Woodland Creek Blvd Kissimmee, FL | 4.0 | 2.0 | 1555 | $2,500 | $1.61 | 25d | 1 | 1.02mi |
| 808 Balsamwood Ln Kissimmee, FL | 3.0 | 2.0 | 1120 | $2,300 | $2.05 | 5d | 1 | 1.11mi |
| 109 Alderwood Dr Kissimmee, FL | 2.0 | 2.0 | 1036 | $1,685 | $1.63 | 25d | 1 | 1.12mi |
| 2154 Rj Cir Kissimmee, FL | 3.0 | 2.0 | 1224 | $2,200 | $1.80 | 4d | 1 | 1.17mi |
| 2305 Cutler Ct Kissimmee, FL | 3.0 | 2.0 | 1208 | $1,979 | $1.64 | 25d | 1 | 1.18mi |
| 1615 Sunburst Way Kissimmee, FL | 3.0 | 2.0 | 1362 | $2,285 | $1.68 | 25d | 1 | 1.19mi |
| 1815 Michigan Ave Unit C Kissimmee, FL | 2.0 | 2.0 | 1118 | $1,450 | $1.30 | 25d | 1 | 1.21mi |
| 1819 Michigan Ave Unit D Kissimmee, FL | 2.0 | 2.0 | 1118 | $1,500 | $1.34 | 25d | 1 | 1.21mi |
| 1807 Michigan Ave Unit D Kissimmee, FL | 2.0 | 2.0 | 1118 | $1,300 | $1.16 | 25d | 1 | 1.22mi |
| 1807 Michigan Ave Unit D Kissimmee, FL | 2.0 | 2.0 | 1118 | $1,300 | $1.16 | 15d | 1 | 1.22mi |
| 1807 Michigan Ave Unit D Kissimmee, FL | 2.0 | 2.0 | 1118 | $1,295 | $1.16 | 16d | 1 | 1.22mi |
| 1629 Sunburst Way Kissimmee, FL | 3.0 | 2.0 | 1362 | $2,130 | $1.56 | 0d | 1 | 1.23mi |
| 801 Poplarwood Ln Kissimmee, FL | 3.0 | 2.0 | 1390 | $2,300 | $1.65 | 25d | 1 | 1.23mi |
| 1707 Michigan Ave Unit D Kissimmee, FL | 2.0 | 2.0 | 1118 | $1,325 | $1.19 | 0d | 1 | 1.25mi |
| 1707 Michigan Ave Kissimmee, FL | 2.0 | 2.0 | 1118 | $1,475 | $1.32 | 25d | 1 | 1.25mi |
| 1703 Michigan Ave Unit C Kissimmee, FL | 2.0 | 2.0 | 1118 | $1,350 | $1.21 | 16d | 1 | 1.26mi |
| 1932 Peridot Cir Kissimmee, FL | 3.0 | 2.0 | 1620 | $2,180 | $1.35 | 0d | 1 | 1.28mi |
| 1500 Neo Landings Loop Unit NEO1540114 Kissimmee, FL | 3.0 | 2.0 | 1416 | $2,268 | $1.60 | 25d | 1 | 1.29mi |
| 3175 Corporate Center Pkwy Kissimmee, FL | 3.0 | 1.0–2.0 | 1023 | $2,936 | $2.87 | 0d | 100 | 1.29mi |
| 2151 Ranch Side Rd Kissimmee, FL | 3.0–5.0 | 2.0–3.0 | 2136 | $2,569 | $1.20 | 0d | 5 | 1.33mi |
| 880 E Columbia Ave Kissimmee, FL | 3.0 | 2.5 | 1500 | $2,000 | $1.33 | 25d | 1 | 1.35mi |
| 1500 Neo Landings Loop Unit NEO1520215 Kissimmee, FL | 2.0 | 2.0 | 1093 | $1,995 | $1.83 | 6d | 1 | 1.37mi |
| 1500 Neo Landings Loop Unit NEO1600207 Kissimmee, FL | 2.0 | 2.0 | 1132 | $1,550 | $1.37 | 0d | 1 | 1.37mi |
| 1500 Neo Landings Loop Unit NEO1600112 Kissimmee, FL | 3.0 | 2.0 | 1416 | $2,179 | $1.54 | 6d | 1 | 1.37mi |
| 1500 Neo Landings Loop Unit NEO1600410 Kissimmee, FL | 2.0 | 2.0 | 1093 | $1,662 | $1.52 | 23d | 1 | 1.37mi |
| 1500 Neo Landings Loop Unit NEO1600312 Kissimmee, FL | 3.0 | 2.0 | 1570 | $2,371 | $1.51 | 4d | 1 | 1.37mi |
| 1500 Neo Landings Loop Unit NEO1540314 Kissimmee, FL | 3.0 | 2.0 | 1570 | $2,359 | $1.50 | 6d | 1 | 1.37mi |
| 236 Red Maple Dr Kissimmee, FL | 3.0 | 2.0 | 1720 | $2,135 | $1.24 | 22d | 1 | 1.39mi |
| 350 Buttonwood Dr Kissimmee, FL | 3.0 | 2.0 | 1486 | $2,050 | $1.38 | 12d | 1 | 1.46mi |
| 2627 N Beaumont Ave Kissimmee, FL | 3.0 | 2.0 | 1206 | $1,925 | $1.60 | 21d | 1 | 1.47mi |
Listing history 5 events
-
2026-05-01status Pending
-
2026-04-27$274,003 Active
-
2000-07-18soldstatus $113,000
-
1995-04-06soldstatus $87,400
-
1987-07-01soldstatus $73,000
ⓘ Source: listings_history table (triggers on properties + properties_extension) + one-shot
backfill from property_details.listing_events for pre-trigger history.
Tax reassessment forecast FL · Resets to sale price
- Current annual tax
- $1,198 · $100/mo
- Projected year-2 tax
- $2,274 · $190/mo
- Expected delta
- +$1,076/yr (+$90/mo · 89.8%)
ⓘ Screening estimate from a state-policy table — verify with the county assessor before closing.
Climate risk First Street
- Flood 1/10 Low FEMA zone X (unshaded) · 0% chance over 30 yrs
- Wildfire 1/10 Low
- Heat 9/10 Extreme 7 d/yr ≥108°F today · 24 d/yr by 30 yrs out
- Wind 9/10 Extreme 99% chance of damaging wind over 30 yrs
- Air quality 1/10 Low 0 unhealthy d/yr today · 0 by 30 yrs out
Nearby sold comps map
Loading sold comps map…
Walkable amenities ~0.75 mi
Loading nearby amenities…
Taxation est. · year 1
- Rental income
- $25,806
- − Mortgage interest
- −$15,348
- − Property taxes
- −$1,198
- − Insurance
- −$1,370
- − Repairs & maintenance
- −$2,065
- − Management
- −$2,065
- − Depreciation
- −$7,971
- Taxable loss
- −$4,211
- Est. tax savings @ 24.0%
- +$1,011
- After-tax cash flow
- $1,586/yr
For passive investors: Depreciation is non-cash, so a rental often shows a tax loss while cash-flowing — sheltering income. Rental losses are passive: they offset passive income freely, and up to $25,000/yr can offset ordinary (W-2) income if you actively participate and your MAGI is under $100k (phasing out to $0 by $150k); unused losses carry forward. On sale, claimed depreciation is recaptured at up to 25%, and gains may owe capital-gains tax (a 1031 exchange can defer both). Figures are a year-1 estimate at your 24.0% rate — not tax advice; consult a CPA.
Schools (NCES district)
- District
- Osceola
- NCES district ID
- 1201470
- Math proficiency
- 39% ▼ -9.00%
- Reading proficiency
- 45% ▼ -4.00%
- Median HH income
- $45,528
- Composite
- 35.7/100
- National rank
- #4865
- State rank
- #60 of 73 in FL
Livability — Kissimmee
- Score
- 77/100
- State rank
- #181
- US rank
- #2841
Category grades
Schools grade is shown separately in the Schools card above.
Census & demographics
- Census place
- Kissimmee, FL
- County
- Osceola County · 410,217 people
- City population
- 196,187
- Metro
- Orlando-Kissimmee-Sanford, FL
- Population (ZIP)
- 66,582
- Household income
- $74,537
- Rent vs Own
- Severe rent burden
- 2462.0
Population outlook (Osceola County) Hauer SSP2
- Today (2025)
- 447,624 people
- By 2030
- 511,823 · +14.3%
- By 2040
- 642,986 · +43.6%
- By 2050
- 774,552 · +73.0%
- By 2075
- 1,078,144 · +140.9%
- By 2100
- 1,269,660 · +183.6%
Race, ethnicity, and origin ACS 2023
- Neighborhood character
- Majority Hispanic (64%)
- Race & ethnicity
- Hispanic / Latino 64% Two or more races 23% White 21% Black 8% Asian 4% Native American 1%
- Hispanic origin (detail)
- Mexican 2% Puerto Rican 32% Cuban 4% Dominican 8%
- Common ancestry
- Romanian 2% Lithuanian 1% Hispanic 1%
- Foreign-born
- 27% · Canada, Jamaica, Dominican Republic
- Languages at home
- 40% English-only · Spanish 53% Other Indo-European 2% French/Haitian/Cajun 1%
Political lean MEDSL · Osceola
- 2024 margin
- Toss-up / Even · D 48.7% · R 50.2% · Other 1.1%
- 2008→2024 swing
- -21.2pp toward R · 2008: 19.7pp · 2024: -1.4pp
- All cycles
- 2024: R+1.4 2020: D+13.8 2016: D+25.0 2012: D+24.5 2008: D+19.7
Not yet ingested
- Civics
- —
Market trends
- HPI YoY
- ▼ -231.17%
- Current HPI
- 277.404
- Rent YoY
- ▼ -2.54%
- Metro
- Orlando-Kissimmee-Sanford, FL
- State GDP YoY
- ▲ 3.28%
- F500 in state
- 36
Industry mix (Fortune 500 HQ in FL)
| Industry | F500 HQs | Revenue |
|---|---|---|
| Industrial Technology | 2 | $29B |
|
||
| Insurance | 2 | $17B |
|
||
| Retail | 1 | $60B |
|
||
| Technology Distribution | 1 | $58B |
|
||
| Homebuilding | 1 | $35B |
|
||
| Technology Manufacturing | 1 | $35B |
|
||
Price history
+275.3% since first listed5 events — show timeline
- 2026-05-01 Pending — Stellar MLS as Distributed by MLS Grid
- 2026-04-27 Listed $274,003 Stellar MLS as Distributed by MLS Grid
- 2000-07-18 Sold (Public Records) $113,000 Public Records
- 1995-04-06 Sold (Public Records) $87,400 Public Records
- 1987-07-01 Sold (Public Records) $73,000 Public Records
Property tax history
+3.9%/yrLatest (2025): $1,198 · +30.7% YoY. Source: county tax records.
Cash-flow waterfall
monthlySold comps — $/sqft
last 12 mo · ≤1 miLoading sold comps…