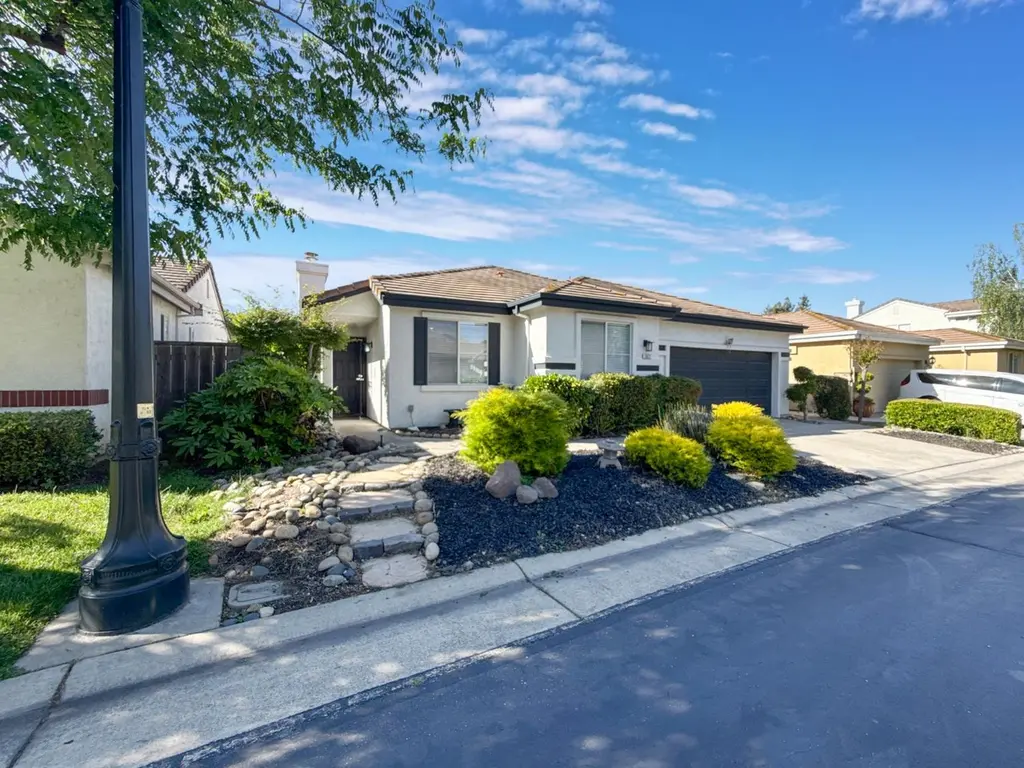
3027 Carousel Cir · Stockton, CA
Flood risk 4/10 · Minor
- FEMA flood zone
- X
- Chance of flooding over 30 yrs
- 0.22%
- Est. flood insurance / yr
- $507 – $1,088
Fire risk 1/10 · Minimal
- Est. fire insurance / yr
- $659 – $1,223
Heat risk 7/10 · Major
- Hot days now (above 102°F)
- 7 days/yr
- Hot days in 30 yrs
- 15 days/yr
Wind risk 1/10 · Minimal
- Chance of severe wind over 30 yrs
- —
Air-quality risk 10/10 · Severe
- Unhealthy air days now
- 22 days/yr
- Unhealthy air days in 30 yrs
- 24 days/yr
Risk factors via First Street. Map © Google.
Why this score? — see what drove the D- grade
The composite is a weighted blend of 9 inputs, each scored 0–100. Each bar is that input's sub-score; the figure is the points it added to the 100-point composite (weight × sub-score).
- ARV discount +11.7/15.0
- Appreciation +10.0/10.0
- Cash flow +4.8/30.0
- Rent growth +3.5/5.0
- Schools +3.0/10.0
- Livability +2.9/5.0
- Condition / age +2.5/5.0
- 1% rule +0.3/10.0
- DSCR +0.0/10.0
$444,950
🖨 Deal sheet 📄 Offer letter ✓ Due diligence
Listing remarks
Tucked inside a quiet circle within the Brookside community, this single-story home offers a rare blend of comfort, convenience, and low-maintenance living in one of Stockton's most desirable areas. Inside, the open-concept layout creates a seamless flow among the living, dining, and kitchen spacesideal for both everyday living and casual entertaining. Recent updates include fresh interior paint, durable vinyl flooring throughout, and a refreshed kitchen featuring granite countertops and updated appliances. The primary suite offers a walk-in closet and an updated bathroom with dual sinks, modern fixtures, and a walk-in shower, creating a comfortable and functional retreat. Step outside to a
Key facts
- Private backyard
- Included spa
- Covered patio
Tags
Property features AI
Finance
- Other: Property located in Brookside Estates subdivision, Stockton, CA 95219
- HOA & community: Mandatory association; Quarterly HOA fee; HOA fee: $480 per quarter; Association offers community amenities
Exterior
- Parking: Attached garage with interior access; 2-car garage; Garage facing front; Mechanical lift in garage; Downslope driveway/sidewalks
- Utilities: Public water; Public sewer; Natural gas connected; Cable, DSL, and internet available
- Home design: Single-family detached residence; One story; Built in 1993; Updated/remodeled condition
- Construction: Tile roof; Built in 1993; Detached single-family construction
- Exterior features: Wood fencing; Low-maintenance, landscaped front and back yards; Regular-shaped lot; Pergola and shed(s); Tile roof; Spa / personal hot tub
Interior
- Kitchen: Granite counters; Free-standing gas range; Free-standing refrigerator; Dishwasher; Microwave
- Bedrooms: 3 bedrooms; Primary bedroom with walk-in closet
- Flooring: Vinyl flooring
- Bathrooms: 2 full bathrooms; Primary bathroom with shower stall, low-flow shower and toilet, and window; Additional bath with tub/shower over and low-flow fixtures
- Heating & cooling: Central heating (gas); Central air conditioning; Ceiling fans
- Interior features: Updated/remodeled interior; Living room fireplace; Covered patio; Dual-pane windows
- Laundry & utility: Laundry closet with washer and dryer included; 220V outlet in laundry
Neighborhood map
What this means for you Summary
Snapshot
- This is a 3-bed/2.0-bath single-family listed at $445k.
Deal economics
- At list price, monthly cash flow is $-1k ($-13k/yr) — negative.
- To cash-flow at today's rent, offer at most $253k (43.1% below list).
- To meet the 1% rule (rent ≥ 1% of price), the offer needs to be $234k (47.4% below list).
- Recommended offer: $234k (47.4% below list) — sets the bar for 1% rule.
Location & tenants
- Location reads 57/100 on livability (#734 in CA) — a working-class tenant base; expect higher turnover. Strengths: housing A+, health & safety A, amenities A-; Watch: employment C-, schools D-, crime F.
- Lincoln Unified (urban): math 26% / reading 41% proficiency, ranked #284 of 517 in CA (top 55%) — families likely to look elsewhere, expect single-tenant / working-renter base with shorter leases.
- Market conditions: Rents rising fast (+4.2%/yr); 213 active listings in the ZIP; 17 comparable units currently listed for rent nearby; rentals leasing fast (median 3d on market — plan ~1-2 weeks tenant-placement turnaround); high-income renter base; 3,779 units permitted in San Joaquin County in 2024 (0 in 5+ unit buildings).
Forward outlook
- In year one you build about $48k of equity ($3k loan paydown + $44k appreciation (10.0% local appreciation)).
- San Joaquin County population projected at +17% by 2050 — long-run rental-demand tailwind backs the buy-and-hold thesis.
- By year 2, paydown + projected appreciation supports a ~$76k cash-out refi (75% LTV) — recoverable capital for the next deal without selling this one.
Negotiation context
- Only 14 days on market — expect competitive offers; lowballing is unlikely to land.
Risks & watch-outs
- Climate carrying-cost: extreme-heat days projected 7→15/yr by 2055 (HVAC capex compounding) — expect insurance premiums to compound above CPI over the hold.
Questions for the listing agent
- What do current leases actually rent for vs. the listed asking? Can we see a recent rent roll and the last 12 months of T-12 income?
- What does the HOA fee cover, when was the last increase, and are there any pending special assessments or reserve-fund shortfalls?
- Is there a deadline driving the sale (1031 exchange, divorce, estate, relocation)? That informs how much negotiation room exists.
- Schools are D-rated, which usually means shorter tenancies and higher turnover. Who's the typical renter profile here, and what's been the actual vacancy rate?
- Crime grade is F in this area — have there been break-ins, vandalism, or insurance claims at this property in the last 3 years? What carrier currently insures it and at what premium?
- The area grade is low — what's the realistic commute time and amenity access for the typical tenant pool here? Any planned neighborhood developments (good or bad) we should know about?
- What's the average days-on-market for RENTAL listings here right now (not sales)? A rising rental-DOM trend means longer vacancies and softer asking-rent achievability than the comps imply.
- What's the recent tenant-quality profile in this submarket — average credit score on applications, eviction rate, late-payment / NSF rate, and stable-employment percentage? A property-management company in the area should have these aggregated.
- How much new for-sale + rental construction is in the pipeline within 1–3 miles? Heavy new supply typically softens prices + rents 12–24 months out; constrained supply supports both.
Investment metrics
- 1% rule
- 0.53% ✗
- Cap rate
- 3.36%
- Cash-on-cash
- -10.47%
- DSCR
- 0.53
- GRM
- 15.9
CMA / ARV
- ARV (median comp)
- $491,090
- List price
- $444,950
- Delta
- -9.40%
- Verdict
- FAIR
- Comps
- 20 within 1.0 mi
Show comp detail 12 sales within ~0.75 mi
| Address | Dist | Beds/Ba | Sqft | Sold | Price | $/sf | Match |
|---|---|---|---|---|---|---|---|
| 3027 Carousel Cir | 0.00mi | 3/2.0 | 1,351 (0%) | 0mo | $453,850 | $336 | 100 |
| 2868 Christina Ave | 0.49mi | 3/2.0 | 1,392 (+3%) | 8mo | $399,000 | $287 | 66 |
| 3836 Delano Ave | 0.44mi | 3/2.0 | 1,248 (-8%) | 8mo | $420,000 | $337 | 60 |
| 2925 De Ovan | 0.40mi | 3/1.0 | 1,464 (+8%) | 8mo | $357,000 | $244 | 57 |
| 2752 Calariva Dr | 0.40mi | 4/2.0 (+1) | 1,499 (+11%) | 2mo | $440,000 | $294 | 56 |
| 3355 Clement Ave | 0.66mi | 3/1.0 | 1,434 (+6%) | 1mo | $445,000 | $310 | 54 |
| 5071 Moss Creek Cir | 0.68mi | 3/2.0 | 1,456 (+8%) | 4mo | $406,000 | $279 | 52 |
| 3634 Whispering Creek Cir | 0.70mi | 3/2.5 | 1,493 (+10%) | 2mo | $490,000 | $328 | 46 |
| 3287 Amberfield Cir | 0.73mi | 3/3.0 | 1,461 (+8%) | 6mo | $435,000 | $298 | 43 |
| 3647 Whispering Creek Cir | 0.71mi | 2/2.0 (-1) | 1,217 (-10%) | 4mo | $347,000 | $285 | 42 |
| 3668 Whispering Creek Cir | 0.71mi | 2/2.0 (-1) | 1,217 (-10%) | 7mo | $390,000 | $320 | 39 |
| 2848 Inman Ave | 0.60mi | 2/1.0 (-1) | 1,172 (-13%) | 5mo | $380,000 | $324 | 37 |
Match score weights: distance 35% · size 25% · config 20% · recency 20%. Top-matched comps best support the ARV.
Projected returns pro-forma
10.0% appreciation · 4.16% rent growth · sell at horizon
- IRR
- 17.2%
- Equity multiple
- 2.41×
- Total profit
- $175,827
- Equity at exit
- $400,846
- IRR
- 16.4%
- Equity multiple
- 5.64×
- Total profit
- $577,985
- Equity at exit
- $864,440
Cash invested: $124,586 (down + closing). Projections, not guarantees.
Landlord ↔ Tenant lean methodology
- Overall (STATE)
- 18 Strongly Tenant-Friendly
- State California
- 18 Strongly Tenant-Friendly · D+13
- County
- — inherits STATE
- City
- — inherits STATE
ZIP-level market 95219
- Home prices YoY
- 6.6%
- Rents YoY
- 4.2%
- Active inventory
- 213
- Price-to-rent
- 15.9×
Monthly cashflow live
- Estimated rent
- $2,339 high interval (Pro) →
- Mortgage (P&I)
- −$2,333
- Tax from tax record
- −$256 /mo · $3,068/yr
- Insurance
- −$185
- HOA
- −$160
- Vacancy / Maint / Mgmt
- −$491
- Net cashflow
- $-1,087
Break-even live
UW: 25.0% down · 7.5% · 30yr · 1.5% tax · 5.0% vac · 8.0% maint · 8.0% mgmt
Financing live
Cash to close
- Down payment
- $111,238
- Closing costs
- $13,348
- Reserves months
- —
- Total cash needed
- —
Loan-product check · same deal, 3 products live
Conventional
25% down · 7.5% · 30yr
- Down + closing
- —
- Monthly P&I
- —
- Monthly cashflow
- —
- DSCR
- —
- Eligible?
- —
Personal DTI + credit; lowest rate.
DSCR
20% down · 8.5% · 30yr
- Down + closing
- —
- Monthly P&I
- —
- Monthly cashflow
- —
- DSCR
- —
- Eligible?
- —
No personal income docs; deal must DSCR.
Hard money
10% down · 12.0% · 12mo
- Down + closing
- —
- Monthly P&I
- —
- Monthly cashflow
- —
- DSCR
- —
- Eligible?
- —
Short-term bridge; refi at stabilization.
Rent comps 17 comps
| Address | Beds | Baths | Sqft | Rent | $/sqft | DOM | Units | Dist |
|---|---|---|---|---|---|---|---|---|
| 2660 Grand Canal Blvd Stockton, CA | 2.0 | 1.5–2.0 | 1077 | $1,972 | $1.83 | 2d | 2 | 0.58mi |
| 2837 Inman Ave Stockton, CA | 3.0 | 1.0 | 1014 | $2,300 | $2.27 | 2d | 1 | 0.59mi |
| 2537 Plymouth Oaks Ct Stockton, CA | 3.0 | 2.5 | 1500 | $2,350 | $1.57 | 43d | 1 | 0.59mi |
| 4609 Da Vinci Dr Stockton, CA | 3.0 | 2.5 | 1592 | $2,000 | $1.26 | 3d | 1 | 0.66mi |
| 5007 Innisbrook Dr Stockton, CA | 3.0 | 2.0 | 1723 | $3,200 | $1.86 | 43d | 1 | 0.76mi |
| 3936 Dennis Ave Stockton, CA | 4.0 | 2.0 | 1583 | $2,625 | $1.66 | 2d | 1 | 0.81mi |
| 5301 Feather River Dr Stockton, CA | 1.0–2.0 | 1.0–2.0 | 852 | $2,575 | $3.02 | 2d | 6 | 0.84mi |
| 2244 Rose Marie Ln Stockton, CA | 2.0 | 1.0–2.0 | 790 | $2,175 | $2.75 | 2d | 18 | 0.92mi |
| 3303 Franklin Ave Apt 2 Stockton, CA | 3.0 | 1.5 | 891 | $1,295 | $1.45 | 43d | 1 | 1.06mi |
| 3591 Quail Lakes Dr Stockton, CA | 2.0 | 2.0 | 930 | $1,595 | $1.72 | 3d | 1 | 1.06mi |
| 3915 Bridlewood Cir Stockton, CA | 3.0 | 2.0 | 1406 | $2,795 | $1.99 | 21d | 1 | 1.09mi |
| 2029 Christina Ave Stockton, CA | 3.0 | 2.0 | 1365 | $2,350 | $1.72 | 43d | 1 | 1.10mi |
| 5834 Brush Creek Dr Stockton, CA | 3.0 | 2.0 | 1100 | $2,295 | $2.09 | 2d | 1 | 1.32mi |
| 5858 Morgan Pl Stockton, CA | 2.0 | 1.0–2.0 | 884 | $1,872 | $2.12 | 2d | 7 | 1.38mi |
| 6019 Carolina Cir Stockton, CA | 3.0 | 2.0 | 1185 | $2,300 | $1.94 | 14d | 1 | 1.46mi |
| 6031 Carolina Cir Stockton, CA | 3.0 | 2.0 | 1245 | $2,200 | $1.77 | 3d | 1 | 1.46mi |
| 1331 Pinetree Dr #4 Stockton, CA | 2.0 | 1.0 | 924 | $1,800 | $1.95 | 43d | 1 | 1.47mi |
HOA detail
- Monthly dues
- $160 · $1,920/yr
Tax reassessment forecast CA · Resets to sale price
- Current annual tax
- $3,068 · $256/mo
- Projected year-2 tax
- $3,382 · $282/mo
- Expected delta
- +$314/yr (+$26/mo · 10.2%)
ⓘ Screening estimate from a state-policy table — verify with the county assessor before closing.
Climate risk First Street
- Flood 4/10 Moderate FEMA zone X · 22% chance over 30 yrs
- Wildfire 1/10 Low
- Heat 7/10 Severe 7 d/yr ≥102°F today · 15 d/yr by 30 yrs out
- Wind 1/10 Low
- Air quality 10/10 Extreme 22 unhealthy d/yr today · 24 by 30 yrs out
Nearby sold comps map
Loading sold comps map…
Walkable amenities ~0.75 mi
Loading nearby amenities…
Taxation est. · year 1
- Rental income
- $28,066
- − Mortgage interest
- −$24,924
- − Property taxes
- −$3,068
- − Insurance
- −$2,225
- − Repairs & maintenance
- −$2,245
- − Management
- −$2,245
- − HOA
- −$1,920
- − Depreciation
- −$12,944
- Taxable loss
- −$21,505
- Est. tax savings @ 24.0%
- +$5,161
- After-tax cash flow
- $-7,880/yr
For passive investors: Depreciation is non-cash, so a rental often shows a tax loss while cash-flowing — sheltering income. Rental losses are passive: they offset passive income freely, and up to $25,000/yr can offset ordinary (W-2) income if you actively participate and your MAGI is under $100k (phasing out to $0 by $150k); unused losses carry forward. On sale, claimed depreciation is recaptured at up to 25%, and gains may owe capital-gains tax (a 1031 exchange can defer both). Figures are a year-1 estimate at your 24.0% rate — not tax advice; consult a CPA.
Schools (NCES district)
- District
- Lincoln Unified
- NCES district ID
- 0621690
- Math proficiency
- 26% ▼ -11.00%
- Reading proficiency
- 41% ▼ -11.00%
- Median HH income
- $56,356
- Composite
- 29.66/100
- National rank
- #6465
- State rank
- #284 of 517 in CA
Livability — Stockton
- Score
- 57/100
- State rank
- #734
- US rank
- #21638
Category grades
Schools grade is shown separately in the Schools card above.
Census & demographics
- Census place
- Stockton, CA
- County
- San Joaquin County · 729,570 people
- City population
- 332,006
- Metro
- Stockton, CA
- Population (ZIP)
- 31,713
- Household income
- $112,268
- Rent vs Own
- Severe rent burden
- 825.0
Population outlook (San Joaquin County) Hauer SSP2
- Today (2025)
- 796,965 people
- By 2030
- 828,849 · +4.0%
- By 2040
- 885,611 · +11.1%
- By 2050
- 929,798 · +16.7%
- By 2075
- 994,578 · +24.8%
- By 2100
- 971,291 · +21.9%
Race, ethnicity, and origin ACS 2023
- Neighborhood character
- Highly diverse neighborhood (Simpson 0.75)
- Race & ethnicity
- White 33% Hispanic / Latino 30% Asian 21% Two or more races 18% Black 9%
- Hispanic origin (detail)
- Mexican 27%
- Common ancestry
- Slovak 2% Italian 2% Portuguese 1%
- Foreign-born
- 20% · Canada, China, Vietnam
- Languages at home
- 69% English-only · Spanish 14% Other Indo-European 4% Other Asian/Pacific 4%
Political lean MEDSL · San Joaquin
- 2024 margin
- Toss-up / Even · D 48.0% · R 48.9% · Other 3.0%
- 2008→2024 swing
- -11.6pp toward R · 2008: 10.7pp · 2024: -0.9pp
- All cycles
- 2024: R+0.9 2020: D+13.9 2016: D+12.9 2012: D+8.9 2008: D+10.7
Not yet ingested
- Civics
- —
Market trends
- HPI YoY
- ▲ 69.26%
- Current HPI
- 1122.61
- Rent YoY
- ▲ 4.16%
- Metro
- Stockton, CA
- State GDP YoY
- ▲ 3.21%
- F500 in state
- 116
Industry mix (Fortune 500 HQ in CA)
| Industry | F500 HQs | Revenue |
|---|---|---|
| Technology | 27 | $1,492B |
|
||
| Financial Services | 3 | $174B |
|
||
| Retail | 3 | $44B |
|
||
| Insurance | 3 | $26B |
|
||
| Media / Entertainment | 2 | $115B |
|
||
| Pharmaceuticals / Biotech | 2 | $62B |
|
||
Property tax history
+0.2%/yrLatest (2025): $3,068 · +2.2% YoY. Source: county tax records.
Cash-flow waterfall
monthlySold comps — $/sqft
last 12 mo · ≤1 miLoading sold comps…