 Duplex
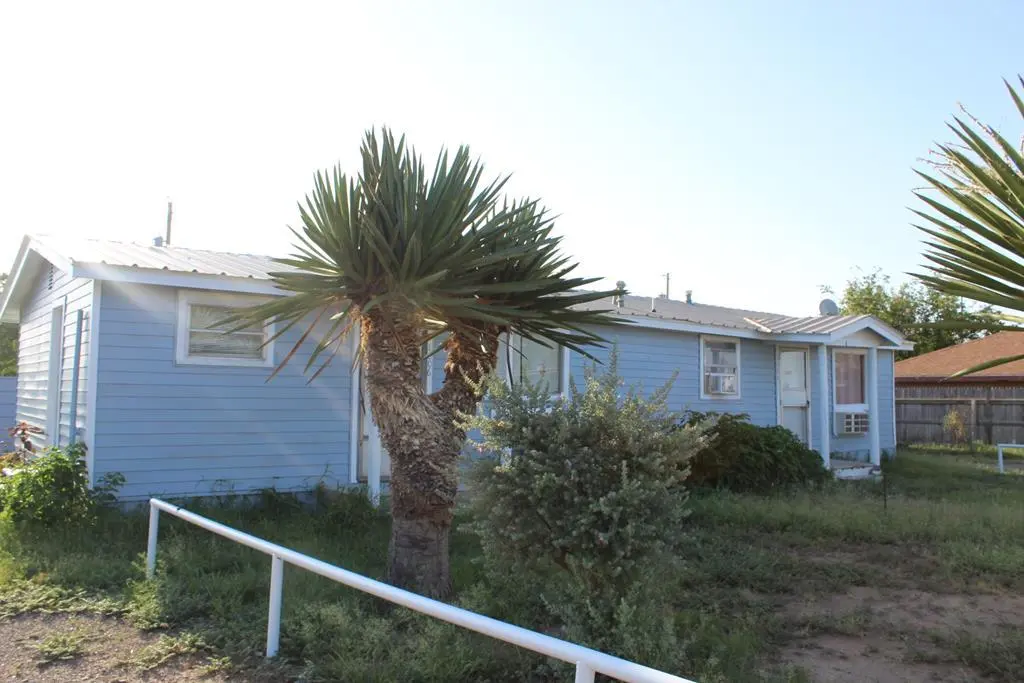
1006 N Alamo Dr · Fort Stockton, TX
Flood risk 1/10 · Minimal
- FEMA flood zone
- —
- Chance of flooding over 30 yrs
- 0.0%
- Est. flood insurance / yr
- —
Fire risk 6/10 · Moderate
- Est. fire insurance / yr
- $1,222 – $2,270
Heat risk 6/10 · Moderate
- Hot days now (above 101°F)
- 7 days/yr
- Hot days in 30 yrs
- 20 days/yr
Wind risk 1/10 · Minimal
- Chance of severe wind over 30 yrs
- 0.0%
Air-quality risk 1/10 · Minimal
- Unhealthy air days now
- 0 days/yr
- Unhealthy air days in 30 yrs
- 0 days/yr
Risk factors via First Street. Map © Google.
Why this score? — see what drove the C+ grade
The composite is a weighted blend of 9 inputs, each scored 0–100. Each bar is that input's sub-score; the figure is the points it added to the 100-point composite (weight × sub-score).
- Cash flow +28.9/30.0
- DSCR +10.0/10.0
- 1% rule +8.1/10.0
- ARV discount +7.5/15.0
- Livability +3.4/5.0
- Rent growth +2.5/5.0
- Condition / age +2.5/5.0
- Schools +2.2/10.0
- Appreciation +0.0/10.0
$143,500
🖨 Deal sheet (PDF) 📄 Offer letter ✓ Due diligence
Multi-family units
County records classify this as Multi-Family (2-4 Unit). Listing-text estimate: 2 units. confirmed
Listing remarks
PRICE REDUCED!!! GREAT INVESTMENT PROPERTY!!! This spacious duplex is ready for new owners with recent interior paint and updates. The kitchen has been updated and is open to the living area. Also comes with great sized driveway that takes you to an oversized backyard with a storage shed. Plenty of space to work on your outdoor projects. Perfect starter home or rental investment opportunity. Come take a look at this amazing duplex with so much potential!
Key facts
- 0.3 acre lot
- Built 1960
- Listed 1312 days
Property features AI
Finance
- Financial info: Each unit currently rented for $750 (actual rent); Two separate 2-bedroom units, one unit listed under Unit Type 1 and one under Unit Type 2
Exterior
- Utilities: Public water; Public sewer
- Home design: Duplex (residential income); Single-story
- Construction: Metal roof
- Exterior features: Metal roof; Shed(s) on the property
Interior
- Kitchen: Range; Refrigerator
- Bedrooms: Two-bedroom units (each unit: 2 bedrooms)
- Bathrooms: One bathroom per unit
- Heating & cooling: Window unit(s) for cooling; No central heating
- Interior features: Range; Refrigerator
Neighborhood map
What this means for you Summary
Snapshot
- This is a 2 × 2-bed/1.0-bath units multifamily listed at $144k.
Deal economics
- At list price, monthly cash flow is $485 ($6k/yr) — positive. Per door: $243/mo.
- The deal already cash-flows at list — no discount required.
- Meets the 1% rule at list price ($2k rent vs $144k).
- Recommended offer: $126k (12.0% below list) — sets the bar for market timing.
Location & tenants
- Location reads 67/100 on livability (#532 in TX) — a middle-class / working-renter tenant base. Strengths: crime A+, cost of living A+, housing A+; Watch: health & safety C-, amenities F, commute F.
- Fort Stockton ISD (town): math 23% / reading 28% proficiency, ranked #709 of 826 in TX (top 86%) — low school quality limits family demand, transient renter base, plan for 1-2y turnover.
- Zoned schools: Fort Stockton Apache El (math 32% / reading 32%, grade F, #2,268 of 4,322 statewide, top 55%, 333 students, 81% FRL); Fort Stockton Middle (math 15% / reading 23%, grade F, #1,466 of 1,662 statewide, top 89%, 515 students, 59% FRL); Fort Stockton High (math 27% / reading 29%, grade F, #1,170 of 1,632 statewide, top 72%, 698 students, 71% FRL).
- Market conditions: 108 active listings in the ZIP; 10 units permitted in Pecos County in 2024 (5 in 5+ unit buildings).
Forward outlook
- Local home prices are declining (-3.0%/yr); year-one equity from $992 of loan paydown is wiped out by about $4k of value loss. Plan a longer hold.
- Pecos County population projected at +25% by 2050 — long-run rental-demand tailwind backs the buy-and-hold thesis.
- At projected returns (-3.0% appreciation + 3.0% rent growth), your $40k cash investment doubles in ~9 years — after that, you're playing with house money.
Negotiation context
- It's been on market 1312 days — a 12% lower offer ($126k) is reasonable based on typical stale-listing flexibility.
- 5 sale attempts since 5y ago with the ask held roughly flat each time — persistent listings suggest the price (not the market) is what's stuck; bring a comps-based counter.
Risks & watch-outs
- Climate carrying-cost: major wildfire risk; extreme-heat days projected 7→20/yr by 2055 (HVAC capex compounding) — expect insurance premiums to compound above CPI over the hold.
Questions for the listing agent
- It's been on market 1312 days. Have you received any prior offers? Is the seller open to a 12% concession, seller financing, or rate buy-down credit?
- Can we see the unit-by-unit rent roll, current vacancy, and any below-market leases? What's the average tenancy length?
- What capital expenditures (roof, boiler, parking lot, exteriors) have been made in the last 5 years, and what's planned in the next 2?
- Built in 1960 — when were the roof, HVAC, electrical panel, plumbing, and water heater last replaced?
- Why hasn't it sold? Are there any deal-killer items the seller is aware of (foundation, flood, title, zoning, code violations)?
- Is there a deadline driving the sale (1031 exchange, divorce, estate, relocation)? That informs how much negotiation room exists.
- Schools are F-rated, which usually means shorter tenancies and higher turnover. Who's the typical renter profile here, and what's been the actual vacancy rate?
- What's the average days-on-market for RENTAL listings here right now (not sales)? A rising rental-DOM trend means longer vacancies and softer asking-rent achievability than the comps imply.
- What's the recent tenant-quality profile in this submarket — average credit score on applications, eviction rate, late-payment / NSF rate, and stable-employment percentage? A property-management company in the area should have these aggregated.
- How much new apartment / multifamily construction is in the pipeline within 1–3 miles? Heavy new supply (>2% of stock underway) typically softens rents 12–24 months out; light construction supports rent growth.
Investment metrics
- 1% rule
- 1.31% ✓
- Cap rate
- 10.35%
- Cash-on-cash
- 14.49%
- DSCR
- 1.64
- GRM
- 6.4
CMA / ARV
No comps found within radius.
Projected returns pro-forma
-3.0% appreciation · 3.0% rent growth · sell at horizon
- IRR
- 4.9%
- Equity multiple
- 1.19×
- Total profit
- $7,677
- Equity at exit
- $21,396
- IRR
- 14.4%
- Equity multiple
- 2.16×
- Total profit
- $46,603
- Equity at exit
- $12,407
Cash invested: $40,180 (down + closing). Projections, not guarantees.
Landlord ↔ Tenant lean methodology
- Overall (STATE)
- 87 Strongly Landlord-Friendly
- State Texas
- 87 Strongly Landlord-Friendly · R+5
- County
- — inherits STATE
- City
- — inherits STATE
ZIP-level market 79735
- Active inventory
- 108
- Price-to-rent
- 12.7×
Monthly cashflow live
- Estimated rent
- $1,878 medium interval (Pro) →
- Mortgage (P&I)
- −$753
- Tax from tax record
- −$186 /mo · $2,234/yr
- Insurance
- −$60
- HOA
- −$0
- Vacancy / Maint / Mgmt
- −$394
- Net cashflow
- $485
Break-even live
Sensitivity live
| Price | -10% $566 | -5% $526 | +0% $485 | +5% $445 | +10% $404 |
|---|---|---|---|---|---|
| Rent | -10% $337 | -5% $411 | +0% $485 | +5% $559 | +10% $633 |
| Rate | -1.0pp $557 | -0.5pp $522 | base $485 | +0.5pp $448 | +1.0pp $410 |
2-unit breakdown (identical units grouped — click to expand)
| Units | Beds | Baths | Est. rent |
|---|---|---|---|
| 2× units | 2 | 1 | $1,878 |
| #1 | 2 | 1 | $939 |
| #2 | 2 | 1 | $939 |
| Total (2 units) | $1,878 | ||
UW: 25.0% down · 7.5% · 30yr · 1.5% tax · 5.0% vac · 8.0% maint · 8.0% mgmt
Financing live
Cash to close
- Down payment
- $35,875
- Closing costs
- $4,305
- Reserves months
- —
- Total cash needed
- —
Loan-product check · same deal, 3 products live
Conventional
25% down · 7.5% · 30yr
- Down + closing
- —
- Monthly P&I
- —
- Monthly cashflow
- —
- DSCR
- —
- Eligible?
- —
Personal DTI + credit; lowest rate.
DSCR
20% down · 8.5% · 30yr
- Down + closing
- —
- Monthly P&I
- —
- Monthly cashflow
- —
- DSCR
- —
- Eligible?
- —
No personal income docs; deal must DSCR.
Hard money
10% down · 12.0% · 12mo
- Down + closing
- —
- Monthly P&I
- —
- Monthly cashflow
- —
- DSCR
- —
- Eligible?
- —
Short-term bridge; refi at stabilization.
Listing history 25 events
-
2026-06-21days on market $143,500 Active 1312 DOM
-
2026-06-18days on market $143,500 Active 1310 DOM
-
2026-06-17days on market $143,500 Active 1309 DOM
-
2026-06-16days on market $143,500 Active 1308 DOM
-
2026-06-15days on market $143,500 Active 1307 DOM
-
2026-06-13days on market $143,500 Active 1305 DOM
-
2026-06-12days on market $143,500 Active 1304 DOM
-
2026-06-09days on market $143,500 Active 1301 DOM
-
2026-06-08days on market $143,500 Active 1300 DOM
-
2026-06-08days on market $143,500 Active 1299 DOM
-
2026-06-07days on market $143,500 Active 1298 DOM
-
2026-06-03days on market $143,500 Active 1295 DOM
-
2026-06-02days on market $143,500 Active 1294 DOM
-
2026-06-01days on market $143,500 Active 1293 DOM
-
2026-05-31days on market $143,500 Active 1292 DOM
-
2024-02-03status Active
-
2024-01-01historical
-
2023-08-08status Active
-
2023-07-01historical
-
2023-01-04status Active
-
2022-10-04historical
-
2022-09-26status Active
-
2022-09-26historical
-
2021-09-20$143,500 Active
-
2020-11-30soldstatus
ⓘ Source: listings_history table (triggers on properties + properties_extension) + one-shot
backfill from property_details.listing_events for pre-trigger history.
Tax reassessment forecast TX · Resets to sale price
- Current annual tax
- $2,234 · $186/mo
- Projected year-2 tax
- $2,626 · $219/mo
- Expected delta
- +$392/yr (+$33/mo · 17.5%)
ⓘ Screening estimate from a state-policy table — verify with the county assessor before closing.
Climate risk First Street
- Flood 1/10 Low 0% chance over 30 yrs
- Wildfire 6/10 Major
- Heat 6/10 Major 7 d/yr ≥101°F today · 20 d/yr by 30 yrs out
- Wind 1/10 Low 0% chance of damaging wind over 30 yrs
- Air quality 1/10 Low 0 unhealthy d/yr today · 0 by 30 yrs out
Nearby sold comps map
Loading sold comps map…
Walkable amenities ~0.75 mi
Loading nearby amenities…
Taxation est. · year 1
- Rental income
- $22,536
- − Mortgage interest
- −$8,038
- − Property taxes
- −$2,234
- − Insurance
- −$718
- − Repairs & maintenance
- −$1,803
- − Management
- −$1,803
- − Depreciation
- −$4,175
- Taxable income
- $3,766
- Est. tax owed @ 24.0%
- −$904
- After-tax cash flow
- $4,918/yr
For passive investors: Depreciation is non-cash, so a rental often shows a tax loss while cash-flowing — sheltering income. Rental losses are passive: they offset passive income freely, and up to $25,000/yr can offset ordinary (W-2) income if you actively participate and your MAGI is under $100k (phasing out to $0 by $150k); unused losses carry forward. On sale, claimed depreciation is recaptured at up to 25%, and gains may owe capital-gains tax (a 1031 exchange can defer both). Figures are a year-1 estimate at your 24.0% rate — not tax advice; consult a CPA.
Schools (NCES district)
- District
- Fort Stockton ISD
- NCES district ID
- 4820190
- Math proficiency
- 23% ▼ -10.00%
- Reading proficiency
- 28% ▼ -5.00%
- Median HH income
- $43,194
- Composite
- 21.81/100
- National rank
- #8247
- State rank
- #709 of 826 in TX
Livability — Fort Stockton
- Score
- 67/100
- State rank
- #532
- US rank
- #10399
Category grades
Schools grade is shown separately in the Schools card above.
Census & demographics
- Census place
- Fort Stockton, TX
- Population (ZIP)
- 12,962
Population outlook (Pecos County) Hauer SSP2
- Today (2025)
- 17,291 people
- By 2030
- 17,999 · +4.1%
- By 2040
- 19,729 · +14.1%
- By 2050
- 21,655 · +25.2%
- By 2075
- 26,049 · +50.7%
- By 2100
- 27,196 · +57.3%
Race, ethnicity, and origin ACS 2023
- Neighborhood character
- Predominantly Hispanic (76%)
- Race & ethnicity
- Hispanic / Latino 76% Two or more races 23% White 17% Black 4% Asian 3%
- Hispanic origin (detail)
- Mexican 70%
- Common ancestry
- Italian 1% Slovak 1% Lithuanian 1%
- Foreign-born
- 13% · Canada
- Languages at home
- 47% English-only · Spanish 51% Other Indo-European 2%
Political lean MEDSL · Pecos
- 2024 margin
- Solid R (+44.8) · D 27.0% · R 71.9% · Other 1.1%
- 2008→2024 swing
- -19.8pp toward R · 2008: -25.0pp · 2024: -44.8pp
- All cycles
- 2024: R+44.8 2020: R+39.3 2016: R+21.9 2012: R+22.2 2008: R+25.0
Not yet ingested
- Civics
- —
Market trends
- HPI YoY
- ▼ -77.34%
- Current HPI
- 138.1106
- Rent YoY
- —
- Metro
- —
- State GDP YoY
- ▲ 3.95%
- F500 in state
- 110
Industry mix (Fortune 500 HQ in TX)
| Industry | F500 HQs | Revenue |
|---|---|---|
| Energy | 16 | $1,198B |
|
||
| Technology | 5 | $198B |
|
||
| Engineering / Construction | 4 | $72B |
|
||
| Energy Services | 3 | $60B |
|
||
| Utilities | 3 | $41B |
|
||
| Healthcare | 2 | $330B |
|
||
Price history
10 events — show timeline
- 2024-02-03 Relisted — PBBOR
- 2024-01-01 Delisted — PBBOR
- 2023-08-08 Relisted — PBBOR
- 2023-07-01 Delisted — PBBOR
- 2023-01-04 Relisted — PBBOR
- 2022-10-04 Delisted — PBBOR
- 2022-09-26 Relisted — PBBOR
- 2022-09-26 Delisted — PBBOR
- 2021-09-20 Listed $143,500 PBBOR
- 2020-11-30 Sold (Public Records) — Public Records
Property tax history
+10.0%/yrLatest (2025): $2,234 · +0.1% YoY. Source: county tax records.
Cash-flow waterfall
monthlySold comps — $/sqft
last 12 mo · ≤1 miLoading sold comps…