 Duplex
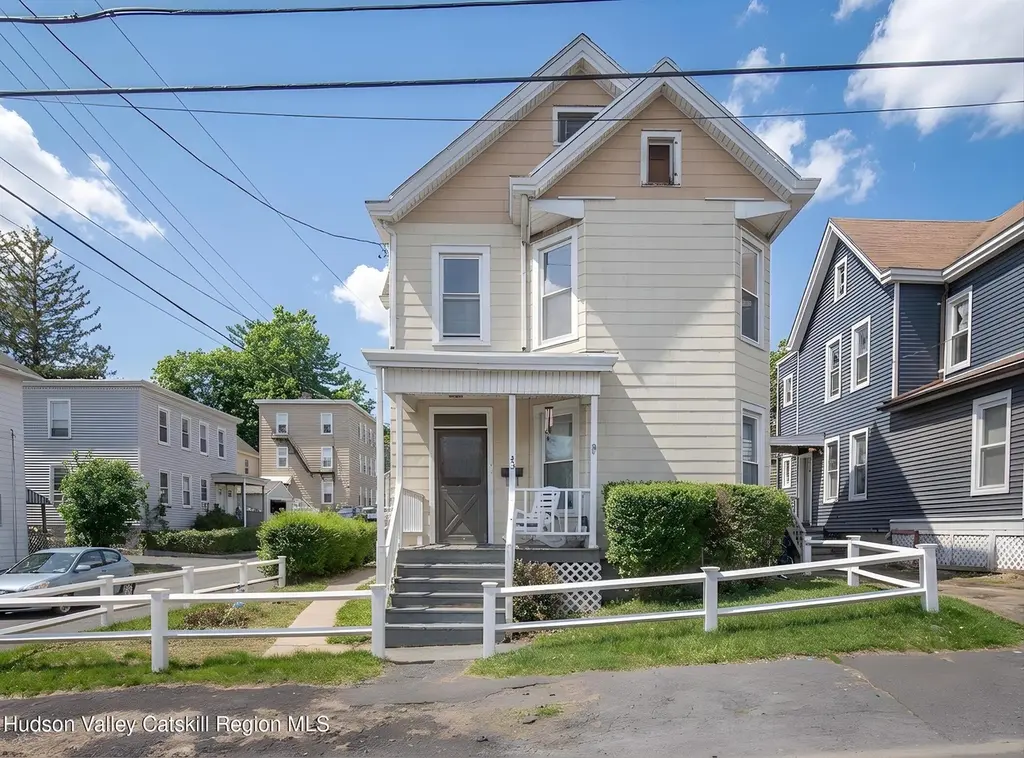
43 2nd Ave · Kingston, NY
Flood risk 4/10 · Minor
- FEMA flood zone
- X (unshaded)
- Chance of flooding over 30 yrs
- 0.22%
- Est. flood insurance / yr
- $473 – $860
Fire risk 3/10 · Minor
- Est. fire insurance / yr
- $691 – $1,283
Heat risk 4/10 · Minor
- Hot days now (above 100°F)
- 7 days/yr
- Hot days in 30 yrs
- 16 days/yr
Wind risk 3/10 · Minor
- Chance of severe wind over 30 yrs
- 8.0%
Air-quality risk 2/10 · Minimal
- Unhealthy air days now
- 1 days/yr
- Unhealthy air days in 30 yrs
- 1 days/yr
Risk factors via First Street. Map © Google.
Why this score? — see what drove the C+ grade
The composite is a weighted blend of 9 inputs, each scored 0–100. Each bar is that input's sub-score; the figure is the points it added to the 100-point composite (weight × sub-score).
- Cash flow +21.2/30.0
- ARV discount +10.7/15.0
- DSCR +6.8/10.0
- 1% rule +6.6/10.0
- Rent growth +4.5/5.0
- Schools +4.4/10.0
- Livability +4.1/5.0
- Condition / age +2.5/5.0
- Appreciation +0.0/10.0
$360,000
🖨 Deal sheet (PDF) 📄 Offer letter ✓ Due diligence
Multi-family units
County records classify this as Multi-Family (2-4 Unit). Listing-text estimate: 2 units. confirmed
Listing remarks
This two-family home in the City of Kingston is a fantastic opportunity for both investors and owner-occupants looking to generate income. Ideally located in the desirable Avenues neighborhood, just steps from the Empire State Trail, you'll enjoy convenient access to Kingston's vibrant hotspots and scenic surroundings. The first-floor apartment features two bedrooms, one full bathroom, an eat-in kitchen, a screened back porch, and a dedicated laundry room. Upstairs, the second unit offers three bedrooms, one bathroom, a spacious eat-in kitchen with a designated pantry, and a walk-up attic providing ample storage. Additional highlights include a detached one-car garage and a paved driveway w
Key facts
- 4,356 sq ft lot
- Garage
- Built 1900
Property features AI
Exterior
- Parking: Has garage (1 space); Off-street paved parking
- Utilities: Public water; Public sewer
- Home design: Residential income duplex
- Construction: Asphalt roof
- Exterior features: Corner lot; Garage(s); Off-street paved parking
Interior
- Kitchen: Free-standing gas range; Refrigerator; Dishwasher not listed
- Flooring: Hardwood; Linoleum; Vinyl
- Heating & cooling: Oil heating; Ceiling fan(s)
- Interior features: Private entrance; Porch and rear porch
- Laundry & utility: In-unit laundry room on lower level; Washer; Dryer
Neighborhood map
What this means for you Summary
Snapshot
- This is a 1×2bd/1ba + 1×3bd/1ba units multifamily listed at $360k.
Deal economics
- At list price, monthly cash flow is $524 ($6k/yr) — positive. Per door: $262/mo.
- The deal already cash-flows at list — no discount required.
- Meets the 1% rule at list price ($4k rent vs $360k).
- Recommended offer: $349k (3.0% below list) — sets the bar for market timing.
- Cap rate 8.0% vs local median 3.0% in Kingston — top-decile yield for the area; either an underpriced asset or a hidden risk that comps aren't pricing in. Stress-test before assuming the spread holds.
Location & tenants
- Location reads 82/100 on livability (#74 in NY, #1,143 nationally) — a professional / high-income tenant draw. Strengths: amenities A+, housing A+, health & safety A+; Watch: crime C-, schools D+.
- Kingston City School District (urban): math 44% / reading 59% proficiency, ranked #355 of 590 in NY (top 60%) — acceptable for families but not a draw, mixed tenant base, ~2y average lease.
- Market conditions: Rents rising fast (+7.8%/yr); 225 active listings in the ZIP; 464 units permitted in Ulster County in 2024 (170 in 5+ unit buildings).
- At $4,160/mo this rent would consume 72% of the median local household income ($69k/yr) (locally 2045% of renters already pay >50% of income on rent) — very limited rent-growth headroom before tenants either downsize or default.
Forward outlook
- Local home prices are declining (-3.0%/yr); year-one equity from $2k of loan paydown is wiped out by about $11k of value loss. Plan a longer hold.
- Ulster County population projected at -14% by 2050 — secular population decline; favor cash flow + early exit over multi-decade hold.
- At projected returns (-3.0% appreciation + 7.8% rent growth), your $101k cash investment doubles in ~9 years — after that, you're playing with house money.
Negotiation context
- It's been on market 42 days — a 3% lower offer ($349k) is reasonable based on typical stale-listing flexibility.
Risks & watch-outs
- Watch-outs: built in 1900 — expect roof / HVAC / electrical / plumbing capex.
Questions for the listing agent
- It's been on market 42 days. Have you received any prior offers? Is the seller open to a 3% concession, seller financing, or rate buy-down credit?
- Can we see the unit-by-unit rent roll, current vacancy, and any below-market leases? What's the average tenancy length?
- What capital expenditures (roof, boiler, parking lot, exteriors) have been made in the last 5 years, and what's planned in the next 2?
- Built in 1900 — when were the roof, HVAC, electrical panel, plumbing, and water heater last replaced?
- Is there a deadline driving the sale (1031 exchange, divorce, estate, relocation)? That informs how much negotiation room exists.
- Schools are D-rated, which usually means shorter tenancies and higher turnover. Who's the typical renter profile here, and what's been the actual vacancy rate?
- What's the average days-on-market for RENTAL listings here right now (not sales)? A rising rental-DOM trend means longer vacancies and softer asking-rent achievability than the comps imply.
- What's the recent tenant-quality profile in this submarket — average credit score on applications, eviction rate, late-payment / NSF rate, and stable-employment percentage? A property-management company in the area should have these aggregated.
- How much new apartment / multifamily construction is in the pipeline within 1–3 miles? Heavy new supply (>2% of stock underway) typically softens rents 12–24 months out; light construction supports rent growth.
Investment metrics
- 1% rule
- 1.16% ✓
- Cap rate
- 8.04%
- Cash-on-cash
- 6.23%
- DSCR
- 1.28
- GRM
- 7.2
CMA / ARV
- ARV (on-the-fly)
- $387,220
- Comps found
- 4
Show comp detail 4 sales within ~0.75 mi
| Address | Dist | Beds/Ba | Sqft | Sold | Price | $/sf | Match |
|---|---|---|---|---|---|---|---|
| 11 Third | 0.08mi | 5/2.0 | 2,016 (-1%) | 5mo | $465,000 | $231 | 91 |
| 20 Sycamore St | 0.56mi | 5/2.0 | 1,887 (-7%) | 10mo | $250,000 | $132 | 53 |
| 1 Willow St | 0.73mi | 5/3.0 | 2,224 (+9%) | 10mo | $423,000 | $190 | 38 |
| 442 Hasbrouck Ave | 0.71mi | 6/2.0 (+1) | 2,310 (+13%) | 18mo | $330,000 | $143 | 25 |
Match score weights: distance 35% · size 25% · config 20% · recency 20%. Top-matched comps best support the ARV.
Projected returns pro-forma
-3.0% appreciation · 7.81% rent growth · sell at horizon
- IRR
- -0.9%
- Equity multiple
- 0.96×
- Total profit
- $-3,637
- Equity at exit
- $53,677
- IRR
- 13.6%
- Equity multiple
- 2.35×
- Total profit
- $136,420
- Equity at exit
- $31,126
Cash invested: $100,800 (down + closing). Projections, not guarantees.
Landlord ↔ Tenant lean methodology
- Overall (STATE)
- 15 Strongly Tenant-Friendly
- State New York
- 15 Strongly Tenant-Friendly · D+10
- County
- — inherits STATE
- City
- — inherits STATE
ZIP-level market 12401
- Rents YoY
- 7.8%
- Active inventory
- 225
- Price-to-rent
- 15.1×
Monthly cashflow live
- Estimated rent
- $4,160 medium interval (Pro) →
- Mortgage (P&I)
- −$1,888
- Tax from tax record
- −$725 /mo · $8,697/yr
- Insurance
- −$150
- HOA
- −$0
- Vacancy / Maint / Mgmt
- −$874
- Net cashflow
- $524
Break-even live
Sensitivity live
| Price | -10% $728 | -5% $626 | +0% $524 | +5% $422 | +10% $320 |
|---|---|---|---|---|---|
| Rent | -10% $195 | -5% $359 | +0% $524 | +5% $688 | +10% $852 |
| Rate | -1.0pp $705 | -0.5pp $615 | base $524 | +0.5pp $430 | +1.0pp $336 |
2-unit breakdown (identical units grouped — click to expand)
| Units | Beds | Baths | Est. rent |
|---|---|---|---|
| 1× unit | 2 | 1 | $1,993 |
| 1× unit | 3 | 1 | $2,167 |
| Total (2 units) | $4,160 | ||
UW: 25.0% down · 7.5% · 30yr · 1.5% tax · 5.0% vac · 8.0% maint · 8.0% mgmt
Financing live
Cash to close
- Down payment
- $90,000
- Closing costs
- $10,800
- Reserves months
- —
- Total cash needed
- —
Loan-product check · same deal, 3 products live
Conventional
25% down · 7.5% · 30yr
- Down + closing
- —
- Monthly P&I
- —
- Monthly cashflow
- —
- DSCR
- —
- Eligible?
- —
Personal DTI + credit; lowest rate.
DSCR
20% down · 8.5% · 30yr
- Down + closing
- —
- Monthly P&I
- —
- Monthly cashflow
- —
- DSCR
- —
- Eligible?
- —
No personal income docs; deal must DSCR.
Hard money
10% down · 12.0% · 12mo
- Down + closing
- —
- Monthly P&I
- —
- Monthly cashflow
- —
- DSCR
- —
- Eligible?
- —
Short-term bridge; refi at stabilization.
Listing history 4 events
-
2026-05-22status Pending
-
2026-05-07historical Active Under Contract
-
2026-04-29price $360,000
-
2026-04-10$375,000 Active
ⓘ Source: listings_history table (triggers on properties + properties_extension) + one-shot
backfill from property_details.listing_events for pre-trigger history.
Tax reassessment forecast NY · Partial reset (capped growth)
- Current annual tax
- $8,697 · $725/mo
- Projected year-2 tax
- $8,697 · $725/mo
- Expected delta
- $0/yr ($0/mo · 0.0%)
ⓘ Screening estimate from a state-policy table — verify with the county assessor before closing.
Climate risk First Street
- Flood 4/10 Moderate FEMA zone X (unshaded) · 22% chance over 30 yrs
- Wildfire 3/10 Moderate
- Heat 4/10 Moderate 7 d/yr ≥100°F today · 16 d/yr by 30 yrs out
- Wind 3/10 Moderate 8% chance of damaging wind over 30 yrs
- Air quality 2/10 Low 1 unhealthy d/yr today · 1 by 30 yrs out
Nearby sold comps map
Loading sold comps map…
Walkable amenities ~0.75 mi
Loading nearby amenities…
Taxation est. · year 1
- Rental income
- $49,920
- − Mortgage interest
- −$20,166
- − Property taxes
- −$8,697
- − Insurance
- −$1,800
- − Repairs & maintenance
- −$3,994
- − Management
- −$3,994
- − Depreciation
- −$10,473
- Taxable income
- $797
- Est. tax owed @ 24.0%
- −$191
- After-tax cash flow
- $6,094/yr
For passive investors: Depreciation is non-cash, so a rental often shows a tax loss while cash-flowing — sheltering income. Rental losses are passive: they offset passive income freely, and up to $25,000/yr can offset ordinary (W-2) income if you actively participate and your MAGI is under $100k (phasing out to $0 by $150k); unused losses carry forward. On sale, claimed depreciation is recaptured at up to 25%, and gains may owe capital-gains tax (a 1031 exchange can defer both). Figures are a year-1 estimate at your 24.0% rate — not tax advice; consult a CPA.
Schools (NCES district)
- District
- Kingston City School District
- NCES district ID
- 3616290
- Math proficiency
- 44% ▲ 1.00%
- Reading proficiency
- 59% ▲ 20.00%
- Median HH income
- $52,586
- Composite
- 44.22/100
- National rank
- #2849
- State rank
- #355 of 590 in NY
Livability — Kingston
- Score
- 82/100
- State rank
- #74
- US rank
- #1143
Category grades
Schools grade is shown separately in the Schools card above.
Census & demographics
- Census place
- Kingston, NY
- County
- Ulster County · 56,183 people
- City population
- 35,136
- Metro
- Kingston, NY
- Population (ZIP)
- 35,136
- Household income
- $69,305
- Rent vs Own
- Severe rent burden
- 2045.0
Population outlook (Ulster County) Hauer SSP2
- Today (2025)
- 175,887 people
- By 2030
- 171,876 · -2.3%
- By 2040
- 161,771 · -8.0%
- By 2050
- 151,470 · -13.9%
- By 2075
- 133,023 · -24.4%
- By 2100
- 113,504 · -35.5%
Race, ethnicity, and origin ACS 2023
- Neighborhood character
- Predominantly White (68%)
- Race & ethnicity
- White 68% Hispanic / Latino 14% Black 11% Two or more races 10% Asian 2% Native American 1%
- Hispanic origin (detail)
- Mexican 5% Puerto Rican 4%
- Common ancestry
- Romanian 5% Iranian 3% Lithuanian 2%
- Foreign-born
- 11% · Canada, China
- Languages at home
- 85% English-only · Spanish 9% Other Indo-European 2% French/Haitian/Cajun 1%
Political lean MEDSL · Ulster
- 2024 margin
- D (+18.7) · D 59.3% · R 40.7%
- 2008→2024 swing
- -4.9pp toward R · 2008: 23.6pp · 2024: 18.7pp
- All cycles
- 2024: D+18.7 2020: D+20.9 2016: D+9.1 2012: D+21.9 2008: D+23.6
Not yet ingested
- Civics
- —
Market trends
- HPI YoY
- ▼ -262.90%
- Current HPI
- 369.1984
- Rent YoY
- ▲ 7.81%
- Metro
- Kingston, NY
- State GDP YoY
- ▲ 2.60%
- F500 in state
- 92
Industry mix (Fortune 500 HQ in NY)
| Industry | F500 HQs | Revenue |
|---|---|---|
| Financial Services | 10 | $950B |
|
||
| Consumer Goods | 9 | $162B |
|
||
| Insurance | 4 | $225B |
|
||
| Telecommunications | 2 | $144B |
|
||
| Pharmaceuticals | 2 | $112B |
|
||
| Media / Entertainment | 2 | $69B |
|
||
Price history
-4.0% since first listed4 events — show timeline
- 2026-05-22 Pending — HVCRMLS
- 2026-05-07 Contingent — HVCRMLS
- 2026-04-29 Price Changed $360,000 HVCRMLS
- 2026-04-10 Listed $375,000 HVCRMLS
Property tax history
+9.6%/yrLatest (2025): $8,697 · +11.0% YoY. Source: county tax records.
Cash-flow waterfall
monthlySold comps — $/sqft
last 12 mo · ≤1 miLoading sold comps…