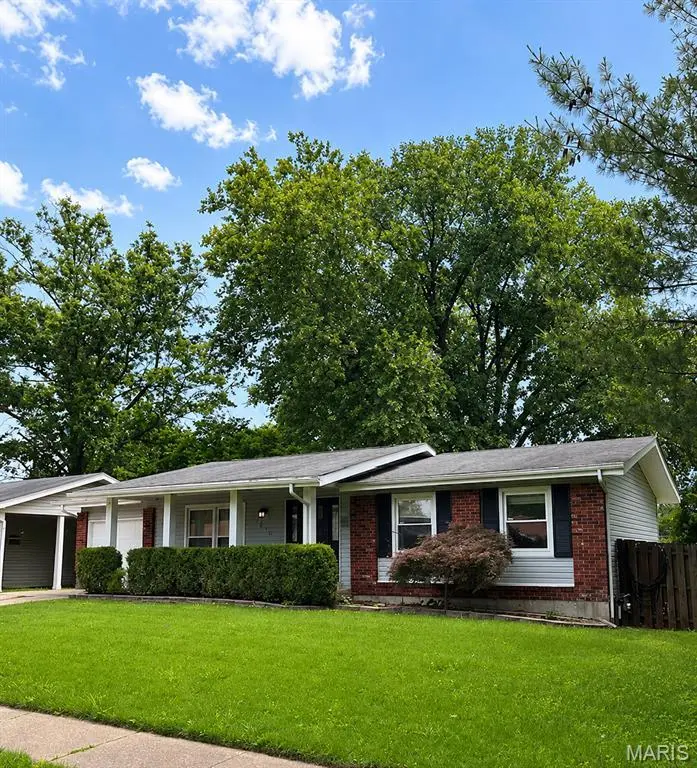
2470 Palm Dr · Florissant, MO
Flood risk 4/10 · Minor
- FEMA flood zone
- X (unshaded)
- Chance of flooding over 30 yrs
- 0.22%
- Est. flood insurance / yr
- $473 – $860
Fire risk 1/10 · Minimal
- Est. fire insurance / yr
- $1,054 – $1,958
Heat risk 5/10 · Moderate
- Hot days now (above 106°F)
- 7 days/yr
- Hot days in 30 yrs
- 21 days/yr
Wind risk 2/10 · Minimal
- Chance of severe wind over 30 yrs
- 1.0%
Air-quality risk 3/10 · Minor
- Unhealthy air days now
- 3 days/yr
- Unhealthy air days in 30 yrs
- 5 days/yr
Risk factors via First Street. Map © Google.
Why this score? — see what drove the D grade
The composite is a weighted blend of 9 inputs, each scored 0–100. Each bar is that input's sub-score; the figure is the points it added to the 100-point composite (weight × sub-score).
- Cash flow +15.3/30.0
- ARV discount +5.7/15.0
- DSCR +4.7/10.0
- 1% rule +3.9/10.0
- Livability +3.7/5.0
- Rent growth +3.6/5.0
- Condition / age +2.5/5.0
- Schools +1.7/10.0
- Appreciation +0.0/10.0
$185,000
🖨 Deal sheet (PDF) 📄 Offer letter ✓ Due diligence
Listing remarks
Welcome home to this charming 3-bedroom, 3-bath ranch offering comfortable living space inside and out. A covered front porch welcomes you into a spacious foyer and formal living room, creating an inviting first impression. The central hallway leads to an oversized eat-in kitchen featuring beautiful oak cabinetry, a convenient covered laundry area, and a bright breakfast nook with patio doors that open to a large backyard patio—perfect for entertaining or relaxing outdoors. The main level boasts white six-panel doors, double closets, and ceiling fans in both the kitchen and primary bedroom. Downstairs, the finished lower level provides exceptional flexibility with two bonus rooms/offi
Key facts
- 8,276 sq ft lot
- Garage
- Built 1967
Property features AI
Exterior
- Parking: Garage with space for 1 car
- Utilities: Public water; Public sewer; Electric service (Ameren); Electricity connected; Natural gas connected; Water connected; Sewer connected
- Home design: Single-family residence; One level
- Construction: Brick veneer and vinyl siding
- Exterior features: Level lot with many trees
Interior
- Kitchen: Kitchen on the main level
- Bedrooms: Three bedrooms on the main level (all bedrooms located on the main level)
- Bathrooms: Three full bathrooms (two on the main level, one in the lower level/basement)
- Heating & cooling: Forced air heating (natural gas); Central air conditioning; Electric cooling; Ceiling fans
- Interior features: Partially finished basement; Basement; Ceiling fans
- Laundry & utility: Natural gas heating; Forced air heating
Neighborhood map
What this means for you Summary
Snapshot
- This is a 3-bed/2.0-bath single-family listed at $185k.
Deal economics
- At list price, monthly cash flow is $69 ($832/yr) — positive.
- The deal already cash-flows at list — no discount required.
- To meet the 1% rule (rent ≥ 1% of price), the offer needs to be $165k (11.1% below list).
- Recommended offer: $165k (11.1% below list) — sets the bar for 1% rule.
Location & tenants
- Location reads 73/100 on livability (#82 in MO) — a middle-class / working-renter tenant base. Strengths: cost of living A+, housing A+, health & safety B+; Watch: crime C-, amenities D+, commute F.
- Hazelwood (suburban): math 11% / reading 26% proficiency, ranked #306 of 324 in MO (top 94%) — low school quality limits family demand, transient renter base, plan for 1-2y turnover.
- Zoned schools: Cold Water Elem. (math 8% / reading 22%, grade F, #982 of 1,115 statewide, top 89%, 384 students, 68% FRL); North Middle (math 16% / reading 28%, grade F, #332 of 391 statewide, top 86%, 674 students, 55% FRL); Hazelwood Central High (math 12% / reading 33%, grade F, #455 of 521 statewide, top 88%, 1,628 students, 52% FRL).
- Market conditions: Rents rising fast (+4.3%/yr); 271 active listings in the ZIP; 30 comparable units currently listed for rent nearby; rentals at typical pace (median 14d on market — plan ~3-4 weeks tenant-placement turnaround); 920 units permitted in St. Louis County in 2024 (250 in 5+ unit buildings).
Forward outlook
- Local home prices are declining (-3.0%/yr); year-one equity from $1k of loan paydown is wiped out by about $6k of value loss. Plan a longer hold.
Negotiation context
- Only 5 days on market — expect competitive offers; lowballing is unlikely to land.
- Current owner paid $100k; list at $185k implies a 85% gain — meaningful room to come down on a strong offer.
Risks & watch-outs
- Climate carrying-cost: extreme-heat days projected 7→21/yr by 2055 (HVAC capex compounding) — expect insurance premiums to compound above CPI over the hold.
Questions for the listing agent
- Built in 1967 — when were the roof, HVAC, electrical panel, plumbing, and water heater last replaced?
- Is there a deadline driving the sale (1031 exchange, divorce, estate, relocation)? That informs how much negotiation room exists.
- Schools are D-rated, which usually means shorter tenancies and higher turnover. Who's the typical renter profile here, and what's been the actual vacancy rate?
- The area grade is low — what's the realistic commute time and amenity access for the typical tenant pool here? Any planned neighborhood developments (good or bad) we should know about?
- What's the average days-on-market for RENTAL listings here right now (not sales)? A rising rental-DOM trend means longer vacancies and softer asking-rent achievability than the comps imply.
- What's the recent tenant-quality profile in this submarket — average credit score on applications, eviction rate, late-payment / NSF rate, and stable-employment percentage? A property-management company in the area should have these aggregated.
- How much new for-sale + rental construction is in the pipeline within 1–3 miles? Heavy new supply typically softens prices + rents 12–24 months out; constrained supply supports both.
Investment metrics
- 1% rule
- 0.89% ✗
- Cap rate
- 6.74%
- Cash-on-cash
- 1.61%
- DSCR
- 1.07
- GRM
- 9.4
CMA / ARV
- ARV (on-the-fly)
- $178,022
- Comps found
- 12
Show comp detail 12 sales within ~0.75 mi
| Address | Dist | Beds/Ba | Sqft | Sold | Price | $/sf | Match |
|---|---|---|---|---|---|---|---|
| 1398 Brenthaven Ln | 0.20mi | 3/2.0 | 1,025 (-4%) | 1mo | $185,000 | $180 | 83 |
| 2328 Urbandale Dr | 0.25mi | 3/2.0 | 1,025 (-4%) | 1mo | $140,400 | $137 | 81 |
| 935 Kingsbrook Ln | 0.38mi | 3/1.5 | 1,078 (+1%) | 2mo | $180,000 | $167 | 77 |
| 2465 Grants Pkwy | 0.25mi | 3/2.0 | 995 (-7%) | 2mo | $129,900 | $131 | 75 |
| 1865 Violet Dr | 0.53mi | 3/1.5 | 1,064 (-0%) | 0mo | $100,000 | $94 | 73 |
| 660 Crabapple Ln | 0.57mi | 3/2.0 | 1,045 (-2%) | 2mo | $199,999 | $191 | 69 |
| 750 Blackbird Dr | 0.51mi | 3/1.5 | 1,025 (-4%) | 1mo | $174,900 | $171 | 67 |
| 880 Fifth Plz | 0.28mi | 4/1.0 (+1) | 980 (-8%) | 1mo | $159,000 | $162 | 64 |
| 2750 Robert Dr | 0.71mi | 3/1.5 | 1,064 (-0%) | 2mo | $169,000 | $159 | 63 |
| 2052 Aristocrat Dr | 0.37mi | 3/1.5 | 960 (-10%) | 1mo | $89,900 | $94 | 63 |
| 1910 Flamingo Dr | 0.73mi | 3/1.0 | 1,025 (-4%) | 1mo | $199,500 | $195 | 54 |
| 1285 Flamingo Dr | 0.56mi | 3/2.0 | 1,198 (+12%) | 1mo | $215,000 | $179 | 53 |
Match score weights: distance 35% · size 25% · config 20% · recency 20%. Top-matched comps best support the ARV.
Projected returns pro-forma
-3.0% appreciation · 4.27% rent growth · sell at horizon
- IRR
- -12.4%
- Equity multiple
- 0.55×
- Total profit
- $-23,439
- Equity at exit
- $27,584
- IRR
- -1.5%
- Equity multiple
- 0.89×
- Total profit
- $-5,779
- Equity at exit
- $15,995
Cash invested: $51,800 (down + closing). Projections, not guarantees.
Landlord ↔ Tenant lean methodology
- Overall (STATE)
- 81 Strongly Landlord-Friendly
- State Missouri
- 81 Strongly Landlord-Friendly · R+10
- County
- — inherits STATE
- City
- — inherits STATE
ZIP-level market 63031
- Rents YoY
- 4.3%
- Active inventory
- 271
- Price-to-rent
- 9.4×
Monthly cashflow live
- Estimated rent
- $1,645 high interval (Pro) →
- Mortgage (P&I)
- −$970
- Tax from tax record
- −$183 /mo · $2,197/yr
- Insurance
- −$77
- HOA
- −$0
- Vacancy / Maint / Mgmt
- −$345
- Net cashflow
- $69
Break-even live
Sensitivity live
| Price | -10% $174 | -5% $122 | +0% $69 | +5% $17 | +10% $-35 |
|---|---|---|---|---|---|
| Rent | -10% $-61 | -5% $4 | +0% $69 | +5% $134 | +10% $199 |
| Rate | -1.0pp $162 | -0.5pp $116 | base $69 | +0.5pp $21 | +1.0pp $-27 |
UW: 25.0% down · 7.5% · 30yr · 1.5% tax · 5.0% vac · 8.0% maint · 8.0% mgmt
Financing live
Cash to close
- Down payment
- $46,250
- Closing costs
- $5,550
- Reserves months
- —
- Total cash needed
- —
Loan-product check · same deal, 3 products live
Conventional
25% down · 7.5% · 30yr
- Down + closing
- —
- Monthly P&I
- —
- Monthly cashflow
- —
- DSCR
- —
- Eligible?
- —
Personal DTI + credit; lowest rate.
DSCR
20% down · 8.5% · 30yr
- Down + closing
- —
- Monthly P&I
- —
- Monthly cashflow
- —
- DSCR
- —
- Eligible?
- —
No personal income docs; deal must DSCR.
Hard money
10% down · 12.0% · 12mo
- Down + closing
- —
- Monthly P&I
- —
- Monthly cashflow
- —
- DSCR
- —
- Eligible?
- —
Short-term bridge; refi at stabilization.
Rent comps 30 comps
| Address | Beds | Baths | Sqft | Rent | $/sqft | DOM | Units | Dist |
|---|---|---|---|---|---|---|---|---|
| 2160 Splendor Dr Florissant, MO | 3.0 | 2.0 | 1100 | $1,800 | $1.64 | 4d | 1 | 0.36mi |
| 1095 Humes Ln Florissant, MO | 3.0 | 1.5 | 1100 | $1,650 | $1.50 | 6d | 1 | 0.42mi |
| 840 Dawnview Ct Florissant, MO | 3.0 | 1.5 | 750 | $900 | $1.20 | 25d | 1 | 0.51mi |
| 2857 Dawnview Dr Florissant, MO | 3.0 | 1.0 | 890 | $1,325 | $1.49 | 9d | 1 | 0.53mi |
| 775 Sherwood Dr Florissant, MO | 3.0 | 1.0 | 1023 | $1,690 | $1.65 | 45d | 1 | 0.54mi |
| 1395 Bluebird Dr Florissant, MO | 3.0 | 2.0 | 1168 | $1,599 | $1.37 | 18d | 1 | 0.62mi |
| 1145 Swallow Ln Florissant, MO | 3.0 | 2.0 | 1288 | $1,645 | $1.28 | 4d | 1 | 0.69mi |
| 1725 Fernbrook Ln Florissant, MO | 3.0 | 1.0 | 925 | $1,485 | $1.61 | 0d | 1 | 0.70mi |
| 2942 Chance Dr Florissant, MO | 3.0 | 1.0 | 912 | $1,700 | $1.86 | 14d | 1 | 0.70mi |
| 3015 Matlock Dr Florissant, MO | 3.0 | 1.0 | 950 | $1,475 | $1.55 | 45d | 1 | 0.82mi |
| 1540 Aspen Dr Florissant, MO | 3.0 | 2.0 | 912 | $1,395 | $1.53 | 9d | 1 | 0.86mi |
| 1540 Aspen Dr Florissant, MO | 3.0 | 2.0 | 912 | $1,395 | $1.53 | 0d | 1 | 0.86mi |
| 2316 Millvalley Dr Florissant, MO | 3.0 | 3.0 | 1189 | $1,696 | $1.43 | 16d | 1 | 0.87mi |
| 1315 Bobolink Dr Florissant, MO | 3.0 | 2.0 | 1025 | $1,700 | $1.66 | 14d | 1 | 0.90mi |
| 330 Moule Dr Florissant, MO | 3.0 | 1.0 | 1014 | $1,575 | $1.55 | 45d | 1 | 0.91mi |
| 1545 Swan Dr Florissant, MO | 3.0 | 1.0 | 1064 | $1,590 | $1.49 | 9d | 1 | 0.93mi |
| 855 Daniel Boone Dr Florissant, MO | 3.0 | 1.0 | 964 | $1,400 | $1.45 | 45d | 1 | 0.95mi |
| 9 Charlotte Dr Florissant, MO | 3.0 | 1.5 | 1404 | $1,561 | $1.11 | 0d | 1 | 1.03mi |
| 765 Babler Dr Florissant, MO | 3.0 | 2.0 | 888 | $1,700 | $1.91 | 9d | 1 | 1.04mi |
| 470 Hundley Dr Florissant, MO | 3.0 | 2.0 | 962 | $1,595 | $1.66 | 45d | 1 | 1.04mi |
| 1015 Lindsay Ln Florissant, MO | 3.0 | 2.0 | 988 | $1,600 | $1.62 | 25d | 1 | 1.15mi |
| 4 Sharon Ct Florissant, MO | 3.0 | 2.0 | 1108 | $1,800 | $1.62 | 0d | 1 | 1.16mi |
| 2400 Teakwood Manor Dr Florissant, MO | 3.0 | 2.0 | 1380 | $1,725 | $1.25 | 45d | 1 | 1.18mi |
| 1332 Langholm Dr Florissant, MO | 3.0 | 1.0 | 924 | $1,650 | $1.79 | 0d | 1 | 1.18mi |
| 1095 Cedar Pl Florissant, MO | 3.0 | 1.5 | 1107 | $1,710 | $1.54 | 0d | 1 | 1.24mi |
| 2245 Lindsay Ln Florissant, MO | 4.0 | 2.0 | 1466 | $1,800 | $1.23 | 18d | 1 | 1.25mi |
| 1710 Kay Dr Florissant, MO | 3.0 | 1.0 | 960 | $1,500 | $1.56 | 3d | 1 | 1.28mi |
| 1505 Miller Dr Florissant, MO | 3.0 | 3.0 | 1246 | $1,750 | $1.40 | 0d | 1 | 1.34mi |
| 3 Champlain Ct Florissant, MO | 3.0 | 1.0 | 1100 | $1,600 | $1.45 | 45d | 1 | 1.47mi |
| 9 Saint Celeste Dr Florissant, MO | 3.0 | 1.0 | 992 | $1,450 | $1.46 | 45d | 1 | 1.50mi |
Listing history 5 events
-
2026-06-07days on market $185,000 Active 5 DOM
-
2026-06-05days on market $185,000 Active 2 DOM
-
2026-06-02statusdays on market $185,000 Active 1 DOM
-
2026-06-01days on market $185,000 Coming Soon 3 DOM
-
2026-05-31days on market $185,000 Coming Soon 2 DOM
ⓘ Source: listings_history table (triggers on properties + properties_extension) + one-shot
backfill from property_details.listing_events for pre-trigger history.
Tax reassessment forecast MO · Resets to sale price
- Current annual tax
- $2,197 · $183/mo
- Projected year-2 tax
- $2,197 · $183/mo
- Expected delta
- $0/yr ($0/mo · 0.0%)
ⓘ Screening estimate from a state-policy table — verify with the county assessor before closing.
Climate risk First Street
- Flood 4/10 Moderate FEMA zone X (unshaded) · 22% chance over 30 yrs
- Wildfire 1/10 Low
- Heat 5/10 Major 7 d/yr ≥106°F today · 21 d/yr by 30 yrs out
- Wind 2/10 Low 100% chance of damaging wind over 30 yrs
- Air quality 3/10 Moderate 3 unhealthy d/yr today · 5 by 30 yrs out
Nearby sold comps map
Loading sold comps map…
Walkable amenities ~0.75 mi
Loading nearby amenities…
Taxation est. · year 1
- Rental income
- $19,742
- − Mortgage interest
- −$10,363
- − Property taxes
- −$2,197
- − Insurance
- −$925
- − Repairs & maintenance
- −$1,579
- − Management
- −$1,579
- − Depreciation
- −$5,382
- Taxable loss
- −$2,284
- Est. tax savings @ 24.0%
- +$548
- After-tax cash flow
- $1,380/yr
For passive investors: Depreciation is non-cash, so a rental often shows a tax loss while cash-flowing — sheltering income. Rental losses are passive: they offset passive income freely, and up to $25,000/yr can offset ordinary (W-2) income if you actively participate and your MAGI is under $100k (phasing out to $0 by $150k); unused losses carry forward. On sale, claimed depreciation is recaptured at up to 25%, and gains may owe capital-gains tax (a 1031 exchange can defer both). Figures are a year-1 estimate at your 24.0% rate — not tax advice; consult a CPA.
Schools (NCES district)
- District
- Hazelwood
- NCES district ID
- 2913830
- Math proficiency
- 11% ▼ -13.00%
- Reading proficiency
- 26% ▼ -6.00%
- Median HH income
- $51,621
- Composite
- 16.77/100
- National rank
- #9156
- State rank
- #306 of 324 in MO
Livability — Florissant
- Score
- 73/100
- State rank
- #82
- US rank
- #5406
Category grades
Schools grade is shown separately in the Schools card above.
Census & demographics
- Census place
- Florissant, MO
- County
- Saint Louis County · 888,823 people
- City population
- 69,104
- Metro
- St. Louis, MO-IL
- Population (ZIP)
- 50,196
- Household income
- $70,811
- Rent vs Own
- Severe rent burden
- 1279.0
Population outlook (St. Louis County) Hauer SSP2
- Today (2025)
- 1,025,227 people
- By 2030
- 1,028,023 · +0.3%
- By 2040
- 1,020,940 · -0.4%
- By 2050
- 1,007,280 · -1.8%
- By 2075
- 987,277 · -3.7%
- By 2100
- 921,984 · -10.1%
Race, ethnicity, and origin ACS 2023
- Neighborhood character
- Diverse neighborhood (Simpson 0.58)
- Race & ethnicity
- White 49% Black 41% Two or more races 7% Hispanic / Latino 2%
- Common ancestry
- Romanian 3% Lithuanian 3% Swedish 1%
- Foreign-born
- 5% · Canada, Jamaica
- Languages at home
- 94% English-only · Spanish 2% Arabic 1%
Political lean MEDSL · St. Louis
- 2024 margin
- Strong D (+23.4) · D 60.8% · R 37.4% · Other 1.7%
- 2008→2024 swing
- +3.5pp toward D · 2008: 19.9pp · 2024: 23.4pp
- All cycles
- 2024: D+23.4 2020: D+24.0 2016: D+16.2 2012: D+13.7 2008: D+19.9
Not yet ingested
- Civics
- —
Market trends
- HPI YoY
- ▼ -223.57%
- Current HPI
- 202.7192
- Rent YoY
- ▲ 4.27%
- Metro
- St. Louis, MO-IL
- State GDP YoY
- ▲ 1.84%
- F500 in state
- 20
Industry mix (Fortune 500 HQ in MO)
| Industry | F500 HQs | Revenue |
|---|---|---|
| Healthcare | 1 | $163B |
|
||
| Insurance | 1 | $21B |
|
||
| Industrial Technology | 1 | $17B |
|
||
| Retail | 1 | $16B |
|
||
| Industrial Distribution | 1 | $10B |
|
||
| Utilities | 1 | $9B |
|
||
Price history
+137.8% since first listed4 events — show timeline
- 2026-05-29 Coming Soon $185,000 MARIS as Distributed by MLS Grid
- 2006-09-20 Sold (Public Records) — Public Records
- 2005-05-09 Sold (Public Records) $100,000 Public Records
- 1998-09-08 Sold (Public Records) $77,800 Public Records
Property tax history
+4.0%/yrLatest (2022): $2,197 · +2.7% YoY. Source: county tax records.
Cash-flow waterfall
monthlySold comps — $/sqft
last 12 mo · ≤1 miLoading sold comps…