 🌊 Lakefront
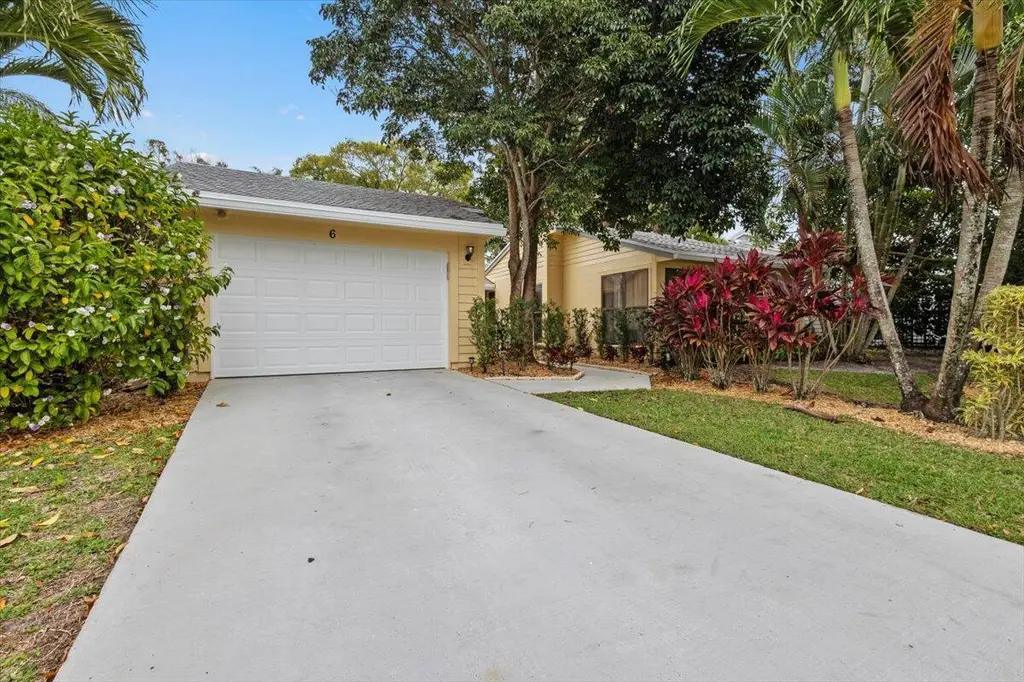
6691 S Pine Ct · Palm Beach Gardens, FL
Flood risk 1/10 · Minimal
- FEMA flood zone
- X (unshaded)
- Chance of flooding over 30 yrs
- 0.0%
- Est. flood insurance / yr
- $507 – $1,088
Fire risk 5/10 · Moderate
- Est. fire insurance / yr
- $947 – $1,759
Heat risk 10/10 · Severe
- Hot days now (above 106°F)
- 7 days/yr
- Hot days in 30 yrs
- 24 days/yr
Wind risk 10/10 · Severe
- Chance of severe wind over 30 yrs
- 99.0%
Air-quality risk 2/10 · Minimal
- Unhealthy air days now
- 1 days/yr
- Unhealthy air days in 30 yrs
- 2 days/yr
Risk factors via First Street. Map © Google.
Why this score? — see what drove the D grade
The composite is a weighted blend of 9 inputs, each scored 0–100. Each bar is that input's sub-score; the figure is the points it added to the 100-point composite (weight × sub-score).
- Cash flow +12.5/30.0
- ARV discount +7.5/15.0
- 1% rule +5.5/10.0
- Schools +4.3/10.0
- DSCR +3.7/10.0
- Livability +3.5/5.0
- Rent growth +3.0/5.0
- Condition / age +2.5/5.0
- Appreciation +0.0/10.0
$549,900
🖨 Deal sheet (PDF) 📄 Offer letter ✓ Due diligence
Listing remarks
* * For Sale: Lakefront Home with 4 Bedrooms, Family Room, and 3 Baths * * Discover a unique home with stunning lake views! While this property may seem modest from the outside, its distinctive layout creates a spacious and open feel as soon as you step inside. Enjoy beautiful lake vistas from the screened-in area. Please note that a mandatory club membership is required at an annual rate of $4,240. * * NEW ROOF Replacement (Full Overhaul): * * The old roof was completely removed down to the decking, and all new materials, including shingles, underlayment, and flashing, were installed. Additionally, a brand-new air conditioner and an 80-gallon water heater have been installed, alon
Key facts
- Lake views
- Unique layout
- Indoor atrium
Tags
Property features AI
Finance
- Financial info: Pets allowed (restrictions possible)
- HOA & community: Part of Eastpoint association; Monthly HOA fee; Association amenities include clubhouse, fitness center, indoor pool, outdoor pool and spa, tennis and pickleball courts, basketball court, golf course and putting green, jogging paths, playground, picnic area, community room, cafe/restaurant, library, management and on-site manager, recreation facilities, sidewalks, street lights, gated access, and internet included; HOA covers cable TV, grounds maintenance, security, sewer, trash, common areas, common real estate tax, golf and recreation facilities
Exterior
- Parking: Attached garage; Detached garage structure present; Attached carport; Carport with 2 spaces; Concrete driveway; Garage door opener; Additional open parking spaces
- Security: Gated community with guard; Security patrol
- Utilities: Public water; Public sewer; Three-phase electric service; Cable available; Electricity connected; Water and sewer available
- Home design: Single family residence; One story; Resale property; Faces south
- Construction: Built by Classic Homes; Stucco and wood siding with wood frame; Ducts professionally air-sealed; Composition/shingle roof; Combination foundation
- Exterior features: Corner lot; Fruit trees; Room for pool; Landscaped grounds; Sidewalks; Lake access; Patios and porches including covered and screened options; Screened porch
Interior
- Kitchen: Electric range; Dishwasher; Refrigerator; Electric water heater
- Bedrooms: Four bedrooms on the main level
- Flooring: Carpet; Ceramic tile
- Bathrooms: Three full bathrooms on the main level
- Heating & cooling: Central heating; Central air; Ceiling fans
- Interior features: Built-in features; Cathedral and vaulted ceilings; Entrance foyer; Split bedroom layout; Closet cabinetry
- Laundry & utility: In-unit laundry room on the main level; Washer hookup; Electric dryer hookup; Inside laundry
Neighborhood map
What this means for you Summary
Snapshot
- This is a 3-bed/3.0-bath single-family listed at $550k.
Deal economics
- At list price, monthly cash flow is $-80 ($-958/yr) — negative.
- To cash-flow at today's rent, offer at most $536k (2.6% below list).
- Meets the 1% rule at list price ($6k rent vs $550k).
- Recommended offer: $517k (6.0% below list) — sets the bar for market timing.
Location & tenants
- Location reads 69/100 on livability (#464 in FL) — a middle-class / working-renter tenant base. Strengths: crime A+, employment A+, housing A+; Watch: amenities F, commute F, cost of living F.
- Palm Beach (suburban): math 46% / reading 53% proficiency, ranked #34 of 73 in FL (top 47%) — families likely to look elsewhere, expect single-tenant / working-renter base with shorter leases.
- Zoned schools: Marsh Pointe Elementary (math 85% / reading 85%, grade A+, #35 of 2,144 statewide, top 2%, 835 students, 16% FRL); Watson B. Duncan Middle School (math 54% / reading 59%, grade B, #171 of 571 statewide, top 30%, 1,157 students, 41% FRL); William T. Dwyer High School (math 36% / reading 58%, grade D-, #207 of 667 statewide, top 32%, 2,206 students, 37% FRL) — zoned schools average 31% FRL vs 52% district-wide (21 pts lower); this property's tenant base skews higher-income than the district average.
- Zoned-school proficiency averages 63% at this address vs 50% district-wide (+13 pts) — the actual schools serving this property are materially stronger than the Palm Beach average implies; a family-tenant draw the district grade alone would hide.
- Market conditions: Rents rising (+2.0%/yr); 542 active listings in the ZIP; 14 comparable units currently listed for rent nearby; rentals at typical pace (median 26d on market — plan ~3-4 weeks tenant-placement turnaround); high-income renter base; 3,974 units permitted in Palm Beach County in 2024 (1,012 in 5+ unit buildings).
- At $5,788/mo this rent would consume 55% of the median local household income ($125k/yr) (locally 1339% of renters already pay >50% of income on rent) — very limited rent-growth headroom before tenants either downsize or default.
Forward outlook
- Local home prices are declining (-3.0%/yr); year-one equity from $4k of loan paydown is wiped out by about $16k of value loss. Plan a longer hold.
- Palm Beach County population projected at +30% by 2050 — long-run rental-demand tailwind backs the buy-and-hold thesis.
Negotiation context
- It's been on market 76 days — a 6% lower offer ($517k) is reasonable based on typical stale-listing flexibility.
- 25 sale attempts since 8y ago; this cycle's ask has dropped $50k (8%) from the opening price — seller is motivated, your offer sets the floor, not the list.
- Current owner paid $244k; list at $550k implies a 125% gain — meaningful room to come down on a strong offer.
Risks & watch-outs
- Climate carrying-cost: severe wind risk, 99% chance of damaging wind over 30y; moderate wildfire risk; extreme-heat days projected 7→24/yr by 2055 (HVAC capex compounding) — expect insurance premiums to compound above CPI over the hold.
Questions for the listing agent
- What do current leases actually rent for vs. the listed asking? Can we see a recent rent roll and the last 12 months of T-12 income?
- It's been on market 76 days. Have you received any prior offers? Is the seller open to a 6% concession, seller financing, or rate buy-down credit?
- What does the HOA fee cover, when was the last increase, and are there any pending special assessments or reserve-fund shortfalls?
- Why hasn't it sold? Are there any deal-killer items the seller is aware of (foundation, flood, title, zoning, code violations)?
- Is there a deadline driving the sale (1031 exchange, divorce, estate, relocation)? That informs how much negotiation room exists.
- Schools are B-rated — typically a magnet for longer-tenancy family renters. What's the average tenant stay here, and is there a school-zone premium baked into asking?
- The area grade is low — what's the realistic commute time and amenity access for the typical tenant pool here? Any planned neighborhood developments (good or bad) we should know about?
- This sits on a lake — are riparian / water-frontage rights deeded with the parcel? Any dock permits, shoreline easements, or HOA water-use restrictions?
- What's the documented flood / surge / shoreline-erosion history here (FEMA AND non-FEMA — e.g., storm surge, creek backup, septic-field saturation)?
- Any water-quality or seasonal algae-bloom issues that affect tenant satisfaction or short-term-rental demand?
- What's the average days-on-market for RENTAL listings here right now (not sales)? A rising rental-DOM trend means longer vacancies and softer asking-rent achievability than the comps imply.
- What's the recent tenant-quality profile in this submarket — average credit score on applications, eviction rate, late-payment / NSF rate, and stable-employment percentage? A property-management company in the area should have these aggregated.
- How much new for-sale + rental construction is in the pipeline within 1–3 miles? Heavy new supply typically softens prices + rents 12–24 months out; constrained supply supports both.
Investment metrics
- 1% rule
- 1.05% ✓
- Cap rate
- 6.12%
- Cash-on-cash
- -0.62%
- DSCR
- 0.97
- GRM
- 7.9
CMA / ARV
- ARV (on-the-fly)
- $3,397,982
- Comps found
- 2
Show comp detail 2 sales within ~0.75 mi
| Address | Dist | Beds/Ba | Sqft | Sold | Price | $/sf | Match |
|---|---|---|---|---|---|---|---|
| 6974 Rossinch Dr Unit Brixton 39 | 0.49mi | 3/4.0 | 2,418 (-4%) | 6mo | $2,421,807 | $1,002 | 62 |
| 6519 Donald Ross Rd | 0.74mi | 4/3.5 (+1) | 2,580 (+3%) | 7mo | $1,092,500 | $423 | 48 |
Match score weights: distance 35% · size 25% · config 20% · recency 20%. Top-matched comps best support the ARV.
Projected returns pro-forma
-3.0% appreciation · 2.0% rent growth · sell at horizon
- IRR
- -18.6%
- Equity multiple
- 0.35×
- Total profit
- $-99,350
- Equity at exit
- $81,992
- IRR
- -13.3%
- Equity multiple
- 0.26×
- Total profit
- $-113,770
- Equity at exit
- $47,545
Cash invested: $153,972 (down + closing). Projections, not guarantees.
Landlord ↔ Tenant lean methodology
- Overall (STATE)
- 87 Strongly Landlord-Friendly
- State Florida
- 87 Strongly Landlord-Friendly · R+3
- County
- — inherits STATE
- City
- — inherits STATE
ZIP-level market 33418
- Home prices YoY
- -32.4%
- Rents YoY
- 2.0%
- Active inventory
- 542
- Price-to-rent
- 7.9×
Monthly cashflow live
- Estimated rent
- $5,788 high interval (Pro) →
- Mortgage (P&I)
- −$2,884
- Tax from tax record
- −$901 /mo · $10,816/yr
- Insurance
- −$229
- HOA
- −$638
- Vacancy / Maint / Mgmt
- −$1,215
- Net cashflow
- $-80
Break-even live
Sensitivity live
| Price | -10% $231 | -5% $76 | +0% $-80 | +5% $-236 | +10% $-391 |
|---|---|---|---|---|---|
| Rent | -10% $-537 | -5% $-308 | +0% $-80 | +5% $149 | +10% $377 |
| Rate | -1.0pp $197 | -0.5pp $60 | base $-80 | +0.5pp $-222 | +1.0pp $-367 |
UW: 25.0% down · 7.5% · 30yr · 1.5% tax · 5.0% vac · 8.0% maint · 8.0% mgmt
Financing live
Cash to close
- Down payment
- $137,475
- Closing costs
- $16,497
- Reserves months
- —
- Total cash needed
- —
Loan-product check · same deal, 3 products live
Conventional
25% down · 7.5% · 30yr
- Down + closing
- —
- Monthly P&I
- —
- Monthly cashflow
- —
- DSCR
- —
- Eligible?
- —
Personal DTI + credit; lowest rate.
DSCR
20% down · 8.5% · 30yr
- Down + closing
- —
- Monthly P&I
- —
- Monthly cashflow
- —
- DSCR
- —
- Eligible?
- —
No personal income docs; deal must DSCR.
Hard money
10% down · 12.0% · 12mo
- Down + closing
- —
- Monthly P&I
- —
- Monthly cashflow
- —
- DSCR
- —
- Eligible?
- —
Short-term bridge; refi at stabilization.
Rent comps 14 comps
| Address | Beds | Baths | Sqft | Rent | $/sqft | DOM | Units | Dist |
|---|---|---|---|---|---|---|---|---|
| 6672 S Pine Ct Palm Beach Gardens, FL | 2.0 | 2.0 | 1778 | $6,900 | $3.88 | 22d | 1 | 0.08mi |
| 6198 Brandon St West Palm Beach, FL | 3.0 | 2.0 | 1905 | $5,000 | $2.62 | 26d | 1 | 0.52mi |
| 6198 Brandon St Unit 6198 West Palm Beach, FL | 3.0 | 2.0 | 1905 | $3,800 | $1.99 | 13d | 1 | 0.53mi |
| 195 Sedona Way Palm Beach Gardens, FL | 4.0 | 2.5 | 2617 | $6,500 | $2.48 | 14d | 1 | 0.68mi |
| 6204 Celadon Cir West Palm Beach, FL | 4.0 | 2.5 | 3192 | $20,000 | $6.27 | 22d | 1 | 0.69mi |
| 12921 Trevi Isle Dr Palm Beach Gardens, FL | 3.0 | 2.5 | 1930 | $4,500 | $2.33 | 26d | 1 | 0.69mi |
| 12885 Trevi Isle Dr Palm Beach Gardens, FL | 3.0 | 2.5 | 1832 | $4,100 | $2.24 | 15d | 1 | 0.72mi |
| 143 Isle Verde Way Palm Beach Gardens, FL | 4.0 | 2.5 | 2344 | $5,500 | $2.35 | 26d | 1 | 0.81mi |
| 13559 Artisan Cir Palm Beach Gardens, FL | 4.0 | 3.5 | 3574 | $9,000 | $2.52 | 26d | 1 | 0.82mi |
| 5623 Delacroix Ter Palm Beach Gardens, FL | 4.0 | 3.5 | 3591 | $9,800 | $2.73 | 26d | 1 | 1.10mi |
| 246 Barbados Dr Jupiter, FL | 3.0 | 2.0 | 2020 | $6,500 | $3.22 | 19d | 1 | 1.30mi |
| 114 Tranquilla Dr Palm Beach Gardens, FL | 3.0 | 3.5 | 2920 | $25,750 | $8.82 | 26d | 1 | 1.41mi |
| 207 Andalusia Dr Palm Beach Gardens, FL | 4.0 | 3.0 | 2678 | $7,500 | $2.80 | 26d | 1 | 1.47mi |
| 180 Barbados Dr Jupiter, FL | 4.0 | 2.0 | 1962 | $5,800 | $2.96 | 9d | 1 | 1.47mi |
HOA detail
- Monthly dues
- $638 · $7,656/yr
- Likely covers
- water
Listing history 50 events
-
2026-06-21days on market $549,900 Active 76 DOM
-
2026-06-18days on market $549,900 Active 73 DOM
-
2026-06-17days on market $549,900 Active 72 DOM
-
2026-06-16days on market $549,900 Active 71 DOM
-
2026-06-15days on market $549,900 Active 70 DOM
-
2026-06-13days on market $549,900 Active 68 DOM
-
2026-06-09days on market $549,900 Active 64 DOM
-
2026-06-08days on market $549,900 Active 63 DOM
-
2026-06-07days on market $549,900 Active 62 DOM
-
2026-06-04days on market $549,900 Active 59 DOM
-
2026-06-03days on market $549,900 Active 58 DOM
-
2026-06-02days on market $549,900 Active 57 DOM
-
2026-06-01days on market $549,900 Active 56 DOM
-
2026-05-31days on market $549,900 Active 55 DOM
-
2026-05-20price $549,900
-
2026-05-04price $565,000
-
2026-04-28price $575,900
-
2026-04-25price $579,900
-
2026-04-17price $589,900
-
2026-04-02$599,900 Active
-
2026-03-13status Active
-
2026-03-06historical Active Under Contract
-
2026-03-06historical
-
2026-02-11price $630,000
-
2026-02-07price $650,000
-
2026-01-19$700,000 Active
-
2025-08-23historical $4,000
-
2025-08-01$4,000
-
2025-08-01historical $4,000
-
2025-07-31$4,000
-
2025-06-26historical $4,000
-
2025-06-19historical
-
2025-06-12price $580,000
-
2025-04-09price $590,000
-
2025-03-19price $615,000
-
2025-03-14price $4,000
-
2025-03-13price $625,000
-
2025-03-12price $645,000
-
2025-03-05price $655,000
-
2025-03-05status Active
-
2025-03-02historical
-
2025-02-28price $665,000
-
2025-02-28price $685,000
-
2025-02-13price $5,000
-
2025-02-12price $695,000
-
2025-02-04price $5,500
-
2025-02-04price $715,900
-
2025-01-25price $6,000
-
2025-01-24price $735,900
-
2025-01-09price $6,500
ⓘ Source: listings_history table (triggers on properties + properties_extension) + one-shot
backfill from property_details.listing_events for pre-trigger history.
Tax reassessment forecast FL · Resets to sale price
- Current annual tax
- $10,816 · $901/mo
- Projected year-2 tax
- $10,816 · $901/mo
- Expected delta
- $0/yr ($0/mo · 0.0%)
ⓘ Screening estimate from a state-policy table — verify with the county assessor before closing.
Climate risk First Street
- Flood 1/10 Low FEMA zone X (unshaded) · 0% chance over 30 yrs
- Wildfire 5/10 Major
- Heat 10/10 Extreme 7 d/yr ≥106°F today · 24 d/yr by 30 yrs out
- Wind 10/10 Extreme 99% chance of damaging wind over 30 yrs
- Air quality 2/10 Low 1 unhealthy d/yr today · 2 by 30 yrs out
Nearby sold comps map
Loading sold comps map…
Walkable amenities ~0.75 mi
Loading nearby amenities…
Taxation est. · year 1
- Rental income
- $69,453
- − Mortgage interest
- −$30,803
- − Property taxes
- −$10,816
- − Insurance
- −$2,750
- − Repairs & maintenance
- −$5,556
- − Management
- −$5,556
- − HOA
- −$7,656
- − Depreciation
- −$15,997
- Taxable loss
- −$9,681
- Est. tax savings @ 24.0%
- +$2,323
- After-tax cash flow
- $1,365/yr
For passive investors: Depreciation is non-cash, so a rental often shows a tax loss while cash-flowing — sheltering income. Rental losses are passive: they offset passive income freely, and up to $25,000/yr can offset ordinary (W-2) income if you actively participate and your MAGI is under $100k (phasing out to $0 by $150k); unused losses carry forward. On sale, claimed depreciation is recaptured at up to 25%, and gains may owe capital-gains tax (a 1031 exchange can defer both). Figures are a year-1 estimate at your 24.0% rate — not tax advice; consult a CPA.
Schools (NCES district)
- District
- Palm Beach
- NCES district ID
- 1201500
- Math proficiency
- 46% ▼ -16.00%
- Reading proficiency
- 53% ▼ -4.00%
- Median HH income
- $53,943
- Composite
- 42.72/100
- National rank
- #3160
- State rank
- #34 of 73 in FL
Livability — Palm Beach Gardens
- Score
- 69/100
- State rank
- #464
- US rank
- #8366
Category grades
Schools grade is shown separately in the Schools card above.
Census & demographics
- County
- Palm Beach County · 1,438,312 people
- City population
- 96,294
- Metro
- Miami-Fort Lauderdale-Pompano Beach, FL
- Population (ZIP)
- 43,676
- Household income
- $125,497
- Rent vs Own
- Severe rent burden
- 1339.0
Population outlook (Palm Beach County) Hauer SSP2
- Today (2025)
- 1,637,487 people
- By 2030
- 1,743,255 · +6.5%
- By 2040
- 1,948,712 · +19.0%
- By 2050
- 2,132,979 · +30.3%
- By 2075
- 2,530,027 · +54.5%
- By 2100
- 2,706,979 · +65.3%
Race, ethnicity, and origin ACS 2023
- Neighborhood character
- Predominantly White (75%)
- Race & ethnicity
- White 75% Hispanic / Latino 13% Two or more races 9% Black 5% Asian 4%
- Hispanic origin (detail)
- Mexican 2% Puerto Rican 2% Cuban 2%
- Common ancestry
- Romanian 5% Lithuanian 4% Scotch-Irish 4%
- Foreign-born
- 15% · Canada, China, Jamaica
- Languages at home
- 83% English-only · Spanish 8% German/W. Germanic 2% Other Indo-European 2%
Political lean MEDSL · Palm Beach
- 2024 margin
- Toss-up / Even · D 50.0% · R 49.2%
- 2008→2024 swing
- -22.1pp toward R · 2008: 22.9pp · 2024: 0.8pp
- All cycles
- 2024: D+0.8 2020: D+12.8 2016: D+15.3 2012: D+17.0 2008: D+22.9
Not yet ingested
- Civics
- —
Market trends
- HPI YoY
- ▼ -172.79%
- Current HPI
- 361.1997
- Rent YoY
- ▲ 2.00%
- Metro
- Miami-Fort Lauderdale-Pompano Beach, FL
- State GDP YoY
- ▲ 3.28%
- F500 in state
- 36
Industry mix (Fortune 500 HQ in FL)
| Industry | F500 HQs | Revenue |
|---|---|---|
| Industrial Technology | 2 | $29B |
|
||
| Insurance | 2 | $17B |
|
||
| Retail | 1 | $60B |
|
||
| Technology Distribution | 1 | $58B |
|
||
| Homebuilding | 1 | $35B |
|
||
| Technology Manufacturing | 1 | $35B |
|
||
Price history
+125.0% since first listed110 events — show timeline
- 2026-05-20 Price Changed $549,900 Beaches MLS
- 2026-05-04 Price Changed $565,000 Beaches MLS
- 2026-04-28 Price Changed $575,900 Beaches MLS
- 2026-04-25 Price Changed $579,900 Beaches MLS
- 2026-04-17 Price Changed $589,900 Beaches MLS
- 2026-04-02 Listed $599,900 Beaches MLS
- 2026-03-13 Relisted — Beaches MLS
- 2026-03-06 Contingent — Beaches MLS
- 2026-03-06 Listing Removed — Beaches MLS
- 2026-02-11 Price Changed $630,000 Beaches MLS
- 2026-02-07 Price Changed $650,000 Beaches MLS
- 2026-01-19 Listed $700,000 Beaches MLS
- 2025-08-23 Rental Removed $4,000 RMLSFL
- 2025-08-01 Listed for Rent $4,000 RMLSFL
- 2025-08-01 Rental Removed $4,000 GFLMLS
- 2025-07-31 Listed for Rent $4,000 GFLMLS
- 2025-06-26 Rental Removed $4,000 RMLSFL
- 2025-06-19 Listing Removed — Beaches MLS
- 2025-06-12 Price Changed $580,000 Beaches MLS
- 2025-04-09 Price Changed $590,000 Beaches MLS
- 2025-03-19 Price Changed $615,000 Beaches MLS
- 2025-03-14 Price Changed $4,000 RMLSFL
- 2025-03-13 Price Changed $625,000 Beaches MLS
- 2025-03-12 Price Changed $645,000 Beaches MLS
- 2025-03-05 Price Changed $655,000 Beaches MLS
- 2025-03-05 Relisted — Beaches MLS
- 2025-03-02 Listing Removed — Beaches MLS
- 2025-02-28 Price Changed $665,000 Beaches MLS
- 2025-02-28 Price Changed $685,000 Beaches MLS
- 2025-02-13 Price Changed $5,000 RMLSFL
- 2025-02-12 Price Changed $695,000 Beaches MLS
- 2025-02-04 Price Changed $5,500 RMLSFL
- 2025-02-04 Price Changed $715,900 Beaches MLS
- 2025-01-25 Price Changed $6,000 RMLSFL
- 2025-01-24 Price Changed $735,900 Beaches MLS
- 2025-01-09 Price Changed $6,500 RMLSFL
- 2025-01-09 Price Changed $750,000 Beaches MLS
- 2025-01-09 Price Changed $7,500,000 Beaches MLS
- 2025-01-01 Price Changed $775,900 Beaches MLS
- 2024-12-16 Price Changed $799,000 Beaches MLS
- 2024-11-21 Price Changed $815,000 Beaches MLS
- 2024-11-03 Listed for Rent $8,000 RMLSFL
- 2024-11-02 Price Changed $950,000 Beaches MLS
- 2024-10-29 Price Changed $775,000 Beaches MLS
- 2024-10-25 Relisted — Beaches MLS
- 2024-10-14 Listing Removed — Beaches MLS
- 2024-10-14 Relisted — Beaches MLS
- 2024-10-11 Pending — Beaches MLS
- 2024-10-11 Price Changed $825,000 Beaches MLS
- 2024-09-18 Price Changed $875,000 Beaches MLS
- 2024-09-14 Price Changed $950,000 Beaches MLS
- 2024-09-14 Relisted — Beaches MLS
- 2024-03-13 Listing Removed — Beaches MLS
- 2024-02-28 Rental Removed $12,000 GFLMLS
- 2023-11-20 Price Changed $12,000 GFLMLS
- 2023-11-20 Price Changed $835,000 Beaches MLS
- 2023-11-18 Listed for Rent $14,000 GFLMLS
- 2023-10-23 Price Changed $899,000 Beaches MLS
- 2023-08-09 Price Changed $915,900 Beaches MLS
- 2023-06-02 Listed $975,000 Beaches MLS
- 2022-07-07 Listing Removed — Beaches MLS
- 2022-04-10 Price Changed $825,000 Beaches MLS
- 2022-01-15 Price Changed $749,900 Beaches MLS
- 2022-01-14 Price Changed $714,900 Beaches MLS
- 2021-11-23 Price Changed $650,000 Beaches MLS
- 2021-11-20 Price Changed $615,000 Beaches MLS
- 2021-09-19 Price Changed $549,000 Beaches MLS
- 2021-09-18 Relisted — Beaches MLS
- 2021-08-12 Listing Removed — Beaches MLS
- 2021-08-07 Price Changed $599,000 Beaches MLS
- 2021-08-07 Relisted — Beaches MLS
- 2021-07-22 Listing Removed — Beaches MLS
- 2021-07-16 Price Changed $650,000 Beaches MLS
- 2021-07-15 Relisted — Beaches MLS
- 2021-07-13 Listing Removed — Beaches MLS
- 2021-07-13 Price Changed $599,000 Beaches MLS
- 2021-07-06 Listed $650,000 Beaches MLS
- 2018-10-19 Listing Removed — Beaches MLS
- 2018-10-17 Price Changed $315,000 Beaches MLS
- 2018-10-17 Relisted — Beaches MLS
- 2018-10-13 Listing Removed — Beaches MLS
- 2018-10-09 Price Changed $290,000 Beaches MLS
- 2018-10-09 Relisted — Beaches MLS
- 2018-09-28 Relisted — Beaches MLS
- 2018-09-17 Listing Removed — Beaches MLS
- 2018-09-10 Listing Removed — Beaches MLS
- 2018-09-09 Price Changed $315,900 Beaches MLS
- 2018-09-08 Price Changed $3,090,950 Beaches MLS
- 2018-09-07 Price Changed $319,900 Beaches MLS
- 2018-09-07 Price Changed $324,900 Beaches MLS
- 2018-09-07 Price Changed $329,900 Beaches MLS
- 2018-08-26 Price Changed $334,900 Beaches MLS
- 2018-08-26 Relisted — Beaches MLS
- 2018-08-01 Listing Removed — Beaches MLS
- 2018-07-31 Price Changed $299,900 Beaches MLS
- 2018-07-31 Relisted — Beaches MLS
- 2018-07-15 Listing Removed — Beaches MLS
- 2018-07-14 Relisted — Beaches MLS
- 2018-06-27 Listing Removed — Beaches MLS
- 2018-06-14 Price Changed $324,900 Beaches MLS
- 2018-05-24 Relisted — Beaches MLS
- 2018-05-22 Listing Removed — Beaches MLS
- 2018-05-21 Price Changed $335,900 Beaches MLS
- 2018-05-15 Relisted — Beaches MLS
- 2018-05-08 Listing Removed — Beaches MLS
- 2018-04-21 Price Changed $365,900 Beaches MLS
- 2018-04-16 Price Changed $369,900 Beaches MLS
- 2018-04-01 Relisted — Beaches MLS
- 2018-03-26 Listing Removed — Beaches MLS
- 2014-10-22 Sold (Public Records) $244,400 Public Records
Property tax history
+6.3%/yrLatest (2025): $10,816 · +10.8% YoY. Source: county tax records.
Cash-flow waterfall
monthlySold comps — $/sqft
last 12 mo · ≤1 miLoading sold comps…