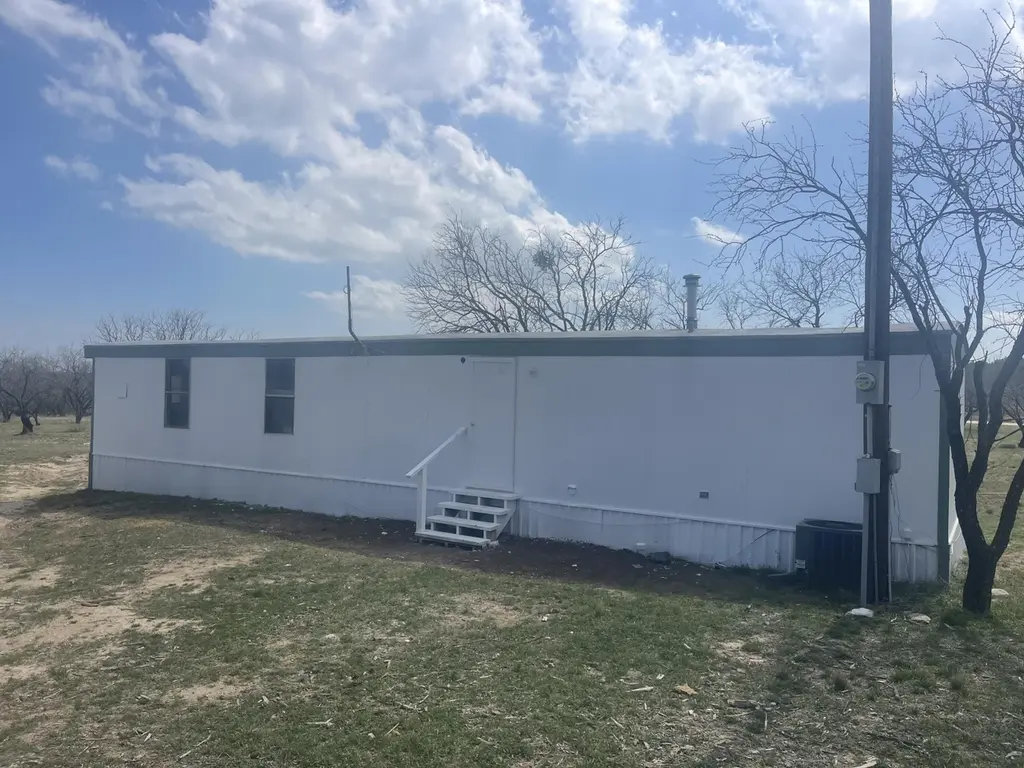
11005 Graham Way · Paint Rock, TX
Flood risk 1/10 · Minimal
- FEMA flood zone
- —
- Chance of flooding over 30 yrs
- 0.0%
- Est. flood insurance / yr
- —
Fire risk 7/10 · Major
- Est. fire insurance / yr
- $1,222 – $2,270
Heat risk 7/10 · Major
- Hot days now (above 105°F)
- 7 days/yr
- Hot days in 30 yrs
- 24 days/yr
Wind risk 6/10 · Moderate
- Chance of severe wind over 30 yrs
- 27.0%
Air-quality risk 1/10 · Minimal
- Unhealthy air days now
- 0 days/yr
- Unhealthy air days in 30 yrs
- 0 days/yr
Risk factors via First Street. Map © Google.
Why this score? — see what drove the C- grade
The composite is a weighted blend of 9 inputs, each scored 0–100. Each bar is that input's sub-score; the figure is the points it added to the 100-point composite (weight × sub-score).
- Cash flow +18.0/30.0
- ARV discount +7.5/15.0
- DSCR +5.7/10.0
- Appreciation +5.6/10.0
- 1% rule +3.8/10.0
- Schools +2.9/10.0
- Livability +2.9/5.0
- Rent growth +2.5/5.0
- Condition / age +2.5/5.0
$97,500
🖨 Deal sheet (PDF) 📄 Offer letter ✓ Due diligence
Listing remarks MLS
* * OWNER FINANCING AVALABLE * * If you are in the market for a cute little home in the country this is it. This home is in a HOA community full of very friendly neighbors. If youre looking for a quiet place to get away then look no further. We just finished our remodel with new flooring throughout, a new kitchen, and a new bathroom. The water well is brand new and produces 105 gallons per min.
Key facts
- New kitchen
- New bathroom
- Water well
Tags
Neighborhood map
What this means for you Summary
Snapshot
- This is a 2-bed/2.0-bath manufactured listed at $98k.
Deal economics
- At list price, monthly cash flow is $85 ($1k/yr) — positive.
- The deal already cash-flows at list — no discount required.
- To meet the 1% rule (rent ≥ 1% of price), the offer needs to be $86k (12.0% below list).
- Recommended offer: $86k (12.0% below list) — sets the bar for 1% rule.
Location & tenants
- Location reads 57/100 on livability (#1,245 in TX) — a working-class tenant base; expect higher turnover. Strengths: cost of living A+; Watch: employment C-, crime F, amenities F.
- Paint Rock ISD (rural): math 35% / reading 25% proficiency, ranked #1,008 of 1,141 in TX (top 88%) — families likely to look elsewhere, expect single-tenant / working-renter base with shorter leases.
- Market conditions: 11 active listings in the ZIP; 10 units permitted in Concho County in 2024 (10 in 5+ unit buildings).
Forward outlook
- In year one you build about $2k of equity ($674 loan paydown + $1k appreciation (1.1% local appreciation)).
- Concho County population projected at +17% by 2050 — long-run rental-demand tailwind backs the buy-and-hold thesis.
- At projected returns (1.1% appreciation + 3.0% rent growth), your $27k cash investment doubles in ~8 years — after that, you're playing with house money.
Negotiation context
- It's been on market 96 days — a 9% lower offer ($89k) is reasonable based on typical stale-listing flexibility.
Risks & watch-outs
- Climate carrying-cost: major wind risk, 27% chance of damaging wind over 30y; major wildfire risk; extreme-heat days projected 7→24/yr by 2055 (HVAC capex compounding) — expect insurance premiums to compound above CPI over the hold.
Questions for the listing agent
- It's been on market 96 days. Have you received any prior offers? Is the seller open to a 12% concession, seller financing, or rate buy-down credit?
- What does the HOA fee cover, when was the last increase, and are there any pending special assessments or reserve-fund shortfalls?
- Why hasn't it sold? Are there any deal-killer items the seller is aware of (foundation, flood, title, zoning, code violations)?
- Is there a deadline driving the sale (1031 exchange, divorce, estate, relocation)? That informs how much negotiation room exists.
- Schools are D-rated, which usually means shorter tenancies and higher turnover. Who's the typical renter profile here, and what's been the actual vacancy rate?
- Crime grade is F in this area — have there been break-ins, vandalism, or insurance claims at this property in the last 3 years? What carrier currently insures it and at what premium?
- What's the average days-on-market for RENTAL listings here right now (not sales)? A rising rental-DOM trend means longer vacancies and softer asking-rent achievability than the comps imply.
- What's the recent tenant-quality profile in this submarket — average credit score on applications, eviction rate, late-payment / NSF rate, and stable-employment percentage? A property-management company in the area should have these aggregated.
- How much new for-sale + rental construction is in the pipeline within 1–3 miles? Heavy new supply typically softens prices + rents 12–24 months out; constrained supply supports both.
Investment metrics
- 1% rule
- 0.88% ✗
- Cap rate
- 7.33%
- Cash-on-cash
- 3.72%
- DSCR
- 1.17
- GRM
- 9.5
CMA / ARV
No comps found within radius.
Projected returns pro-forma
1.14% appreciation · 3.0% rent growth · sell at horizon
- IRR
- 5.6%
- Equity multiple
- 1.29×
- Total profit
- $7,863
- Equity at exit
- $34,019
- IRR
- 9.7%
- Equity multiple
- 2.20×
- Total profit
- $32,799
- Equity at exit
- $45,780
Cash invested: $27,300 (down + closing). Projections, not guarantees.
Landlord ↔ Tenant lean methodology
- Overall (STATE)
- 87 Strongly Landlord-Friendly
- State Texas
- 87 Strongly Landlord-Friendly · R+5
- County
- — inherits STATE
- City
- — inherits STATE
ZIP-level market 76866
- Home prices YoY
- 1.1%
- Active inventory
- 11
- Price-to-rent
- 9.5×
Monthly cashflow live
- Estimated rent
- $858 medium interval (Pro) →
- Mortgage (P&I)
- −$511
- Tax from tax record
- −$32 /mo · $378/yr
- Insurance
- −$41
- HOA
- −$10
- Vacancy / Maint / Mgmt
- −$180
- Net cashflow
- $85
Break-even live
Sensitivity live
| Price | -10% $140 | -5% $112 | +0% $85 | +5% $57 | +10% $29 |
|---|---|---|---|---|---|
| Rent | -10% $17 | -5% $51 | +0% $85 | +5% $118 | +10% $152 |
| Rate | -1.0pp $134 | -0.5pp $109 | base $85 | +0.5pp $59 | +1.0pp $34 |
UW: 25.0% down · 7.5% · 30yr · 1.5% tax · 5.0% vac · 8.0% maint · 8.0% mgmt
Financing live
Cash to close
- Down payment
- $24,375
- Closing costs
- $2,925
- Reserves months
- —
- Total cash needed
- —
Loan-product check · same deal, 3 products live
Conventional
25% down · 7.5% · 30yr
- Down + closing
- —
- Monthly P&I
- —
- Monthly cashflow
- —
- DSCR
- —
- Eligible?
- —
Personal DTI + credit; lowest rate.
DSCR
20% down · 8.5% · 30yr
- Down + closing
- —
- Monthly P&I
- —
- Monthly cashflow
- —
- DSCR
- —
- Eligible?
- —
No personal income docs; deal must DSCR.
Hard money
10% down · 12.0% · 12mo
- Down + closing
- —
- Monthly P&I
- —
- Monthly cashflow
- —
- DSCR
- —
- Eligible?
- —
Short-term bridge; refi at stabilization.
HOA detail
- Monthly dues
- $10 · $120/yr
- Likely covers
- water
Listing history 20 events
-
2026-06-21days on market $97,500 Active 96 DOM
-
2026-06-21days on market $97,500 Active 95 DOM
-
2026-06-18days on market $97,500 Active 93 DOM
-
2026-06-17days on market $97,500 Active 92 DOM
-
2026-06-16days on market $97,500 Active 91 DOM
-
2026-06-15days on market $97,500 Active 90 DOM
-
2026-06-15days on market $97,500 Active 89 DOM
-
2026-06-13days on market $97,500 Active 88 DOM
-
2026-06-12days on market $97,500 Active 87 DOM
-
2026-06-10days on market $97,500 Active 84 DOM
-
2026-06-08days on market $97,500 Active 83 DOM
-
2026-06-08days on market $97,500 Active 82 DOM
-
2026-06-05days on market $97,500 Active 80 DOM
-
2026-06-03days on market $97,500 Active 78 DOM
-
2026-06-02days on market $97,500 Active 77 DOM
-
2026-06-01days on market $97,500 Active 76 DOM
-
2026-05-31days on market $97,500 Active 75 DOM
-
2026-05-19price $97,500 400-char remark
Show marketing remark (400 chars)
* * OWNER FINANCING AVALABLE * * If you are in the market for a cute little home in the country this is it. This home is in a HOA community full of very friendly neighbors. If youre looking for a quiet place to get away then look no further. We just finished our remodel with new flooring throughout, a new kitchen, and a new bathroom. The water well is brand new and produces 105 gallons per min.
-
2026-03-18$98,000 Active 400-char remark
Show marketing remark (400 chars)
* * OWNER FINANCING AVALABLE * * If you are in the market for a cute little home in the country this is it. This home is in a HOA community full of very friendly neighbors. If youre looking for a quiet place to get away then look no further. We just finished our remodel with new flooring throughout, a new kitchen, and a new bathroom. The water well is brand new and produces 105 gallons per min.
-
1996-03-01soldstatus
ⓘ Source: listings_history table (triggers on properties + properties_extension) + one-shot
backfill from property_details.listing_events for pre-trigger history.
Tax reassessment forecast TX · Resets to sale price
- Current annual tax
- $378 · $32/mo
- Projected year-2 tax
- $1,784 · $149/mo
- Expected delta
- +$1,406/yr (+$117/mo · 371.7%)
ⓘ Screening estimate from a state-policy table — verify with the county assessor before closing.
Climate risk First Street
- Flood 1/10 Low 0% chance over 30 yrs
- Wildfire 7/10 Severe
- Heat 7/10 Severe 7 d/yr ≥105°F today · 24 d/yr by 30 yrs out
- Wind 6/10 Major 27% chance of damaging wind over 30 yrs
- Air quality 1/10 Low 0 unhealthy d/yr today · 0 by 30 yrs out
Nearby sold comps map
Loading sold comps map…
Walkable amenities ~0.75 mi
Loading nearby amenities…
Taxation est. · year 1
- Rental income
- $10,299
- − Mortgage interest
- −$5,462
- − Property taxes
- −$378
- − Insurance
- −$488
- − Repairs & maintenance
- −$824
- − Management
- −$824
- − HOA
- −$120
- − Depreciation
- −$2,836
- Taxable loss
- −$632
- Est. tax savings @ 24.0%
- +$152
- After-tax cash flow
- $1,167/yr
For passive investors: Depreciation is non-cash, so a rental often shows a tax loss while cash-flowing — sheltering income. Rental losses are passive: they offset passive income freely, and up to $25,000/yr can offset ordinary (W-2) income if you actively participate and your MAGI is under $100k (phasing out to $0 by $150k); unused losses carry forward. On sale, claimed depreciation is recaptured at up to 25%, and gains may owe capital-gains tax (a 1031 exchange can defer both). Figures are a year-1 estimate at your 24.0% rate — not tax advice; consult a CPA.
Schools (NCES district)
- District
- Paint Rock ISD
- NCES district ID
- 4833980
- Math proficiency
- 35% ▲ 10.00%
- Reading proficiency
- 25% ▬ 0.00%
- Median HH income
- $44,480
- Composite
- 28.53/100
- National rank
- #12081
- State rank
- #1008 of 1141 in TX
Livability — Paint Rock
- Score
- 57/100
- State rank
- #1245
- US rank
- #21750
Category grades
Schools grade is shown separately in the Schools card above.
Census & demographics
- Population (ZIP)
- 918
Population outlook (Concho County) Hauer SSP2
- Today (2025)
- 4,538 people
- By 2030
- 4,681 · +3.2%
- By 2040
- 4,975 · +9.6%
- By 2050
- 5,329 · +17.4%
- By 2075
- 5,760 · +26.9%
- By 2100
- 4,903 · +8.0%
Race, ethnicity, and origin ACS 2023
- Neighborhood character
- Predominantly White (73%)
- Race & ethnicity
- White 73% Hispanic / Latino 23% Two or more races 21% Asian 1%
- Hispanic origin (detail)
- Mexican 22%
- Common ancestry
- Italian 26% Lithuanian 4% Romanian 1%
- Foreign-born
- 4% · Canada, China
- Languages at home
- 77% English-only · Spanish 23%
Political lean MEDSL · Concho
- 2024 margin
- Solid R (+73.9) · D 12.8% · R 86.6%
- 2008→2024 swing
- -22.8pp toward R · 2008: -51.1pp · 2024: -73.9pp
- All cycles
- 2024: R+73.9 2020: R+67.9 2016: R+69.1 2012: R+59.8 2008: R+51.1
Not yet ingested
- Civics
- —
Market trends
- HPI YoY
- ▲ 1.14%
- Current HPI
- 104.2078
- Rent YoY
- —
- Metro
- —
- State GDP YoY
- ▲ 3.95%
- F500 in state
- 110
Industry mix (Fortune 500 HQ in TX)
| Industry | F500 HQs | Revenue |
|---|---|---|
| Energy | 16 | $1,198B |
|
||
| Technology | 5 | $198B |
|
||
| Engineering / Construction | 4 | $72B |
|
||
| Energy Services | 3 | $60B |
|
||
| Utilities | 3 | $41B |
|
||
| Healthcare | 2 | $330B |
|
||
Price history
-0.5% since first listed3 events — show timeline
- 2026-05-19 Price Changed $97,500 SAAR TX
- 2026-03-18 Listed $98,000 SAAR TX
- 1996-03-01 Sold (Public Records) — Public Records
Property tax history
-4.4%/yrLatest (2025): $378 · -13.9% YoY. Source: county tax records.
Cash-flow waterfall
monthlySold comps — $/sqft
last 12 mo · ≤1 miLoading sold comps…