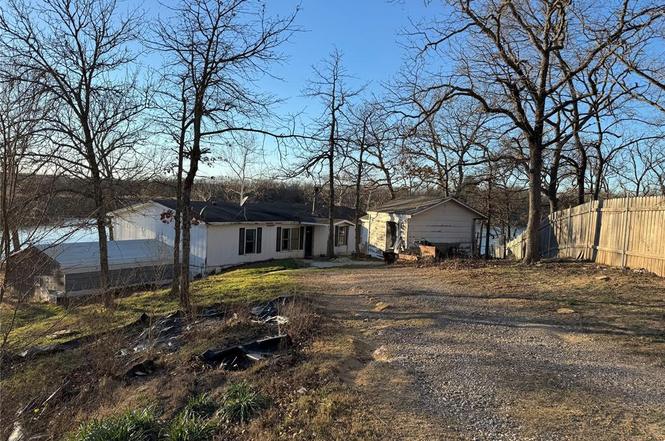
12383 N 365 Rd · Seminole, OK
Flood risk 1/10 · Minimal
- FEMA flood zone
- A
- Chance of flooding over 30 yrs
- 0.0%
- Est. flood insurance / yr
- $1,009 – $1,996
Fire risk 8/10 · Major
- Est. fire insurance / yr
- $2,463 – $4,575
Heat risk 5/10 · Moderate
- Hot days now (above 110°F)
- 7 days/yr
- Hot days in 30 yrs
- 19 days/yr
Wind risk 4/10 · Minor
- Chance of severe wind over 30 yrs
- 9.0%
Air-quality risk 2/10 · Minimal
- Unhealthy air days now
- 1 days/yr
- Unhealthy air days in 30 yrs
- 1 days/yr
Risk factors via First Street. Map © Google.
Why this score? — see what drove the B grade
The composite is a weighted blend of 9 inputs, each scored 0–100. Each bar is that input's sub-score; the figure is the points it added to the 100-point composite (weight × sub-score).
- Cash flow +30.0/30.0
- DSCR +10.0/10.0
- 1% rule +8.5/10.0
- Appreciation +8.2/10.0
- ARV discount +7.5/15.0
- Livability +3.2/5.0
- Rent growth +2.5/5.0
- Condition / age +2.5/5.0
- Schools +1.6/10.0
$90,000
🖨 Deal sheet (PDF) 📄 Offer letter ✓ Due diligence
Listing remarks
Enjoy peaceful waterfront living with this 1991 manufactured home offering 3 bedrooms, 2 bathrooms, and approximately 1680 square feet of living area. Situated directly on a reservoir, this property provides beautiful water views and a tranquil setting that's hard to find. The large, open family room features a corner fireplace, creating a warm and inviting gathering space, while the kitchen overlooks the water-perfect for enjoying the scenery while cooking or dining. A wood privacy fence with a gated entrance adds separation from the road and a sense of seclusion. The home is being sold as-is, with the seller making no repairs, offering a great opportunity for buyers looking to personalize
Key facts
- Open family room
- Waterfront living
- Wood privacy fence
Tags
Property features AI
Finance
- Other: Located in Del Marr legal addition; Vacant and available; Manual geocode; directions available
- Financial info: Property offered As Is
- HOA & community: No mandatory association dues
Exterior
- Parking: No parking details provided
- Security: No security details provided
- Utilities: Underground sprinkler; Flood insurance applies
- Home design: Single family residence; Residential property; One level; Existing structure; Homestead exempt
- Construction: Manufactured construction; Composition roof; Combination foundation; Built as existing (year not provided)
- Exterior features: Covered porch; Wood fencing; Rural setting; Waterfront
Interior
- Kitchen: No kitchen appliance details provided
- Bedrooms: 3 bedrooms
- Flooring: Carpet; Laminate
- Bathrooms: 2 full bathrooms
- Heating & cooling: No heating or cooling details provided
- Interior features: 1 living area; 1 dining area; Carpet and laminate flooring; Fireplace (1) with other fireplace features
- Laundry & utility: No laundry details provided
Neighborhood map
What this means for you Summary
Snapshot
- This is a 3-bed/2.0-bath single-family listed at $90k.
Deal economics
- At list price, monthly cash flow is $301 ($4k/yr) — positive.
- The deal already cash-flows at list — no discount required.
- Meets the 1% rule at list price ($1k rent vs $90k).
- Recommended offer: $79k (12.0% below list) — sets the bar for market timing.
- Cap rate 12.0% vs local median 4.8% in Seminole — top-decile yield for the area; either an underpriced asset or a hidden risk that comps aren't pricing in. Stress-test before assuming the spread holds.
Location & tenants
- Location reads 63/100 on livability (#222 in OK) — a middle-class / working-renter tenant base. Strengths: cost of living A+, housing A; Watch: crime D+, amenities F, commute F.
- Butner (rural): math 10% / reading 20% proficiency, ranked #475 of 513 in OK (top 93%) — low school quality limits family demand, transient renter base, plan for 1-2y turnover; 68% free/reduced lunch — lower-income household profile, screen leases tightly.
- Zoned schools: Butner Es (math 12% / reading 17%, grade F, #604 of 845 statewide, top 76%, 141 students, 0% FRL); Butner Hs (math 10% / reading 10%, grade F, #361 of 447 statewide, top 94%, 60 students, 0% FRL) — zoned schools average 0% FRL vs 68% district-wide (68 pts lower); this property's tenant base skews higher-income than the district average.
- Market conditions: 30 active listings in the ZIP; 93 units permitted in Seminole County in 2024 (43 in 5+ unit buildings).
Forward outlook
- In year one you build about $6k of equity ($622 loan paydown + $6k appreciation (6.5% local appreciation)).
- At projected returns (6.5% appreciation + 3.0% rent growth), your $25k cash investment doubles in ~3 years — after that, you're playing with house money.
- By year 6, paydown + projected appreciation supports a ~$35k cash-out refi (75% LTV) — recoverable capital for the next deal without selling this one.
Negotiation context
- It's been on market 155 days — a 12% lower offer ($79k) is reasonable based on typical stale-listing flexibility.
Risks & watch-outs
- Watch-outs: flood insurance adds $125/mo.
- Climate carrying-cost: in FEMA flood zone A (mandatory federal flood insurance); severe wildfire risk; extreme-heat days projected 7→19/yr by 2055 (HVAC capex compounding) — expect insurance premiums to compound above CPI over the hold.
Questions for the listing agent
- It's been on market 155 days. Have you received any prior offers? Is the seller open to a 12% concession, seller financing, or rate buy-down credit?
- What's the actual annual flood-insurance premium (NFIP or private), and is the property in a SFHA with mandatory coverage?
- Why hasn't it sold? Are there any deal-killer items the seller is aware of (foundation, flood, title, zoning, code violations)?
- Is there a deadline driving the sale (1031 exchange, divorce, estate, relocation)? That informs how much negotiation room exists.
- Schools are F-rated, which usually means shorter tenancies and higher turnover. Who's the typical renter profile here, and what's been the actual vacancy rate?
- Crime grade is D in this area — have there been break-ins, vandalism, or insurance claims at this property in the last 3 years? What carrier currently insures it and at what premium?
- What's the average days-on-market for RENTAL listings here right now (not sales)? A rising rental-DOM trend means longer vacancies and softer asking-rent achievability than the comps imply.
- What's the recent tenant-quality profile in this submarket — average credit score on applications, eviction rate, late-payment / NSF rate, and stable-employment percentage? A property-management company in the area should have these aggregated.
- How much new for-sale + rental construction is in the pipeline within 1–3 miles? Heavy new supply typically softens prices + rents 12–24 months out; constrained supply supports both.
Investment metrics
- 1% rule
- 1.35% ✓
- Cap rate
- 11.98%
- Cash-on-cash
- 20.30%
- DSCR
- 1.90
- GRM
- 6.2
CMA / ARV
No comps found within radius.
Projected returns pro-forma
6.46% appreciation · 3.0% rent growth · sell at horizon
- IRR
- 28.2%
- Equity multiple
- 2.89×
- Total profit
- $47,659
- Equity at exit
- $59,187
- IRR
- 26.1%
- Equity multiple
- 5.95×
- Total profit
- $124,675
- Equity at exit
- $109,661
Cash invested: $25,200 (down + closing). Projections, not guarantees.
Landlord ↔ Tenant lean methodology
- Overall (STATE)
- 83 Strongly Landlord-Friendly
- State Oklahoma
- 83 Strongly Landlord-Friendly · R+20
- County
- — inherits STATE
- City
- — inherits STATE
ZIP-level market 74884
- Home prices YoY
- 2.7%
- Active inventory
- 30
- Price-to-rent
- 6.2×
Monthly cashflow live
- Estimated rent
- $1,219 medium interval (Pro) →
- Mortgage (P&I)
- −$472
- Tax from tax record
- −$27 /mo · $329/yr
- Insurance
- −$38
- Flood insurance flood zone
- −$125 /mo · $1,502/yr
- HOA
- −$0
- Vacancy / Maint / Mgmt
- −$256
- Net cashflow
- $301
Break-even live
Sensitivity live
| Price | -10% $352 | -5% $327 | +0% $301 | +5% $276 | +10% $250 |
|---|---|---|---|---|---|
| Rent | -10% $205 | -5% $253 | +0% $301 | +5% $349 | +10% $397 |
| Rate | -1.0pp $346 | -0.5pp $324 | base $301 | +0.5pp $278 | +1.0pp $254 |
UW: 25.0% down · 7.5% · 30yr · 1.5% tax · 5.0% vac · 8.0% maint · 8.0% mgmt
Financing live
Cash to close
- Down payment
- $22,500
- Closing costs
- $2,700
- Reserves months
- —
- Total cash needed
- —
Loan-product check · same deal, 3 products live
Conventional
25% down · 7.5% · 30yr
- Down + closing
- —
- Monthly P&I
- —
- Monthly cashflow
- —
- DSCR
- —
- Eligible?
- —
Personal DTI + credit; lowest rate.
DSCR
20% down · 8.5% · 30yr
- Down + closing
- —
- Monthly P&I
- —
- Monthly cashflow
- —
- DSCR
- —
- Eligible?
- —
No personal income docs; deal must DSCR.
Hard money
10% down · 12.0% · 12mo
- Down + closing
- —
- Monthly P&I
- —
- Monthly cashflow
- —
- DSCR
- —
- Eligible?
- —
Short-term bridge; refi at stabilization.
Listing history 17 events
-
2026-06-21days on market $90,000 Active 155 DOM
-
2026-06-18days on market $90,000 Active 153 DOM
-
2026-06-17days on market $90,000 Active 152 DOM
-
2026-06-16days on market $90,000 Active 151 DOM
-
2026-06-15days on market $90,000 Active 150 DOM
-
2026-06-13days on market $90,000 Active 148 DOM
-
2026-06-12days on market $90,000 Active 147 DOM
-
2026-06-09days on market $90,000 Active 144 DOM
-
2026-06-08days on market $90,000 Active 143 DOM
-
2026-06-08days on market $90,000 Active 142 DOM
-
2026-06-05days on market $90,000 Active 140 DOM
-
2026-06-04days on market $90,000 Active 138 DOM
-
2026-06-02days on market $90,000 Active 137 DOM
-
2026-06-01days on market $90,000 Active 136 DOM
-
2026-05-31days on market $90,000 Active 135 DOM
-
2026-03-21price $90,000
-
2026-01-15$99,000 Active
ⓘ Source: listings_history table (triggers on properties + properties_extension) + one-shot
backfill from property_details.listing_events for pre-trigger history.
Tax reassessment forecast OK · Resets to sale price
- Current annual tax
- $329 · $27/mo
- Projected year-2 tax
- $810 · $67/mo
- Expected delta
- +$481/yr (+$40/mo · 146.2%)
ⓘ Screening estimate from a state-policy table — verify with the county assessor before closing.
Climate risk First Street
- Flood 1/10 Low FEMA zone A · 0% chance over 30 yrs
- Wildfire 8/10 Severe
- Heat 5/10 Major 7 d/yr ≥110°F today · 19 d/yr by 30 yrs out
- Wind 4/10 Moderate 9% chance of damaging wind over 30 yrs
- Air quality 2/10 Low 1 unhealthy d/yr today · 1 by 30 yrs out
Nearby sold comps map
Loading sold comps map…
Walkable amenities ~0.75 mi
Loading nearby amenities…
Taxation est. · year 1
- Rental income
- $14,631
- − Mortgage interest
- −$5,041
- − Property taxes
- −$329
- − Insurance
- −$1,952
- − Repairs & maintenance
- −$1,170
- − Management
- −$1,170
- − Depreciation
- −$2,618
- Taxable income
- $2,349
- Est. tax owed @ 24.0%
- −$564
- After-tax cash flow
- $3,050/yr
For passive investors: Depreciation is non-cash, so a rental often shows a tax loss while cash-flowing — sheltering income. Rental losses are passive: they offset passive income freely, and up to $25,000/yr can offset ordinary (W-2) income if you actively participate and your MAGI is under $100k (phasing out to $0 by $150k); unused losses carry forward. On sale, claimed depreciation is recaptured at up to 25%, and gains may owe capital-gains tax (a 1031 exchange can defer both). Figures are a year-1 estimate at your 24.0% rate — not tax advice; consult a CPA.
Schools (NCES district)
- District
- Butner
- NCES district ID
- 4006000
- Math proficiency
- 10% ▲ 4.00%
- Reading proficiency
- 20% ▲ 5.00%
- Median HH income
- $37,261
- Composite
- 15.98/100
- National rank
- #14305
- State rank
- #475 of 513 in OK
Livability — Seminole
- Score
- 63/100
- State rank
- #222
- US rank
- #15706
Category grades
Schools grade is shown separately in the Schools card above.
Census & demographics
- Population (ZIP)
- 5,558
Population outlook (Seminole County) Hauer SSP2
- Today (2025)
- 25,628 people
- By 2030
- 25,617 · +-0.0%
- By 2040
- 25,619 · +-0.0%
- By 2050
- 25,726 · +0.4%
- By 2075
- 26,261 · +2.5%
- By 2100
- 25,844 · +0.8%
Race, ethnicity, and origin ACS 2023
- Neighborhood character
- Diverse neighborhood (Simpson 0.69)
- Race & ethnicity
- White 55% Native American 20% Two or more races 13% Black 8% Hispanic / Latino 5%
- Hispanic origin (detail)
- Mexican 5%
- Common ancestry
- Slovak 2% Italian 1%
- Foreign-born
- 1% · Canada
- Languages at home
- 96% English-only · Spanish 2%
Political lean MEDSL · Seminole
- 2024 margin
- Solid R (+49.7) · D 24.2% · R 74.0% · Other 1.8%
- 2008→2024 swing
- -19.1pp toward R · 2008: -30.6pp · 2024: -49.7pp
- All cycles
- 2024: R+49.7 2020: R+46.3 2016: R+44.1 2012: R+30.3 2008: R+30.6
Not yet ingested
- Civics
- —
Market trends
- HPI YoY
- ▲ 6.46%
- Current HPI
- 245.5435
- Rent YoY
- —
- Metro
- —
- State GDP YoY
- ▲ 1.55%
- F500 in state
- 6
Industry mix (Fortune 500 HQ in OK)
| Industry | F500 HQs | Revenue |
|---|---|---|
| Energy | 3 | $48B |
|
||
Price history
-9.1% since first listed2 events — show timeline
- 2026-03-21 Price Changed $90,000 MLSOK
- 2026-01-15 Listed $99,000 MLSOK
Property tax history
-0.4%/yrLatest (2025): $329 · +3.1% YoY. Source: county tax records.
Cash-flow waterfall
monthlySold comps — $/sqft
last 12 mo · ≤1 miLoading sold comps…