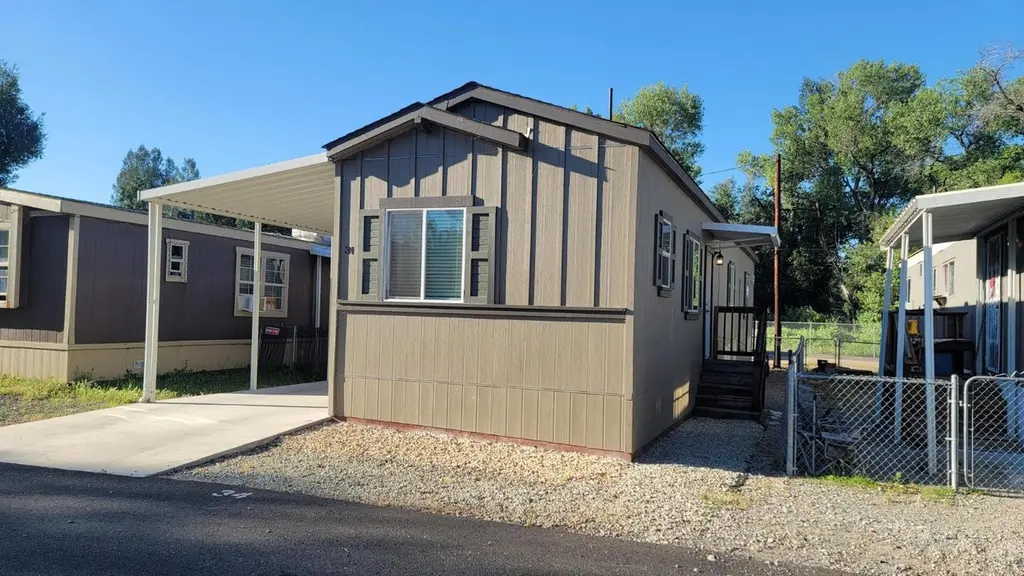
5812 Cedars Rd #34 · Redding, CA
Flood risk 1/10 · Minimal
- FEMA flood zone
- AE
- Chance of flooding over 30 yrs
- 0.0%
- Est. flood insurance / yr
- $1,737 – $8,500
Fire risk 8/10 · Major
- Est. fire insurance / yr
- $659 – $1,223
Heat risk 8/10 · Major
- Hot days now (above 105°F)
- 7 days/yr
- Hot days in 30 yrs
- 16 days/yr
Wind risk 1/10 · Minimal
- Chance of severe wind over 30 yrs
- —
Air-quality risk 10/10 · Severe
- Unhealthy air days now
- 33 days/yr
- Unhealthy air days in 30 yrs
- 38 days/yr
Risk factors via First Street. Map © Google.
Why this score? — see what drove the C grade
The composite is a weighted blend of 9 inputs, each scored 0–100. Each bar is that input's sub-score; the figure is the points it added to the 100-point composite (weight × sub-score).
- Cash flow +21.4/30.0
- ARV discount +7.5/15.0
- DSCR +6.8/10.0
- 1% rule +5.6/10.0
- Schools +4.6/10.0
- Rent growth +4.4/5.0
- Livability +3.8/5.0
- Condition / age +2.5/5.0
- Appreciation +0.0/10.0
$104,990
🖨 Deal sheet (PDF) 📄 Offer letter ✓ Due diligence
Listing remarks MLS
This is a very well cared for, 2/1 SUPER CUTE refurbished Mobile in a park, Newer siding, fresh Paint, Newer carpet, Newer Mini Blinds and screens, Newer Swamp cooler, New porches, Newer Stove & Frig stay as part of the sale. Great Storage. Completely Fenced Yard Dog OK, (No Pit Bulls). Buyer to verify All aspects of Mobile home, info from seller and HCD Reg. Card.
Key facts
- Greenbelt
- Parking
- Built 2021
Tags
Property features AI
Finance
- Other: Located at 5812 Cedars Rd #34, Redding, CA 96001; Cross street: Highway 273; Directions: S Bonneyville Rd to Cedars
- HOA & community: No homeowners association; Not a senior community; Land lease: No (listed land lease amount present separately)
Exterior
- Parking: Attached covered parking
- Utilities: Cable available; Individual electric meter; 220 volts in laundry; Public sewer; Water from water district
- Home design: Manufactured home in park (single wide); Clayton make; Year built 2021
- Construction: Vinyl skirting
- Exterior features: Composition roof; Lot described as Other
Interior
- Kitchen: Skylight; Dishwasher; Microwave
- Bedrooms: 3 bedrooms
- Flooring: Carpet; Vinyl; Wood
- Bathrooms: 2 full bathrooms; Tub with shower over
- Heating & cooling: Central heating; Ceiling fans; Wall air conditioning units
- Interior features: Skylights in living room and kitchen; Dishwasher; Microwave
- Laundry & utility: Laundry inside (individual electric meter, 220V in laundry)
Neighborhood map
What this means for you Summary
Snapshot
- This is a 2-bed/1.0-bath manufactured listed at $105k.
Deal economics
- At list price, monthly cash flow is $-270 ($-3k/yr) — negative.
- To cash-flow at today's rent, offer at most $66k (37.3% below list).
- Meets the 1% rule at list price ($1k rent vs $105k).
- Recommended offer: $66k (37.3% below list) — sets the bar for cash-flow.
- Cap rate 8.1% vs local median 3.3% in Redding — top-decile yield for the area; either an underpriced asset or a hidden risk that comps aren't pricing in. Stress-test before assuming the spread holds.
Location & tenants
- Location reads 76/100 on livability (#106 in CA, #3,726 nationally) — a middle-class / working-renter tenant base. Strengths: amenities A+, commute A+, health & safety A+; Watch: employment C-, crime F, cost of living F.
- Shasta Union High (urban): math 41% / reading 67% proficiency, ranked #122 of 517 in CA (top 24%) — acceptable for families but not a draw, mixed tenant base, ~2y average lease; only 16% free/reduced lunch — higher-income household profile.
- Zoned schools: Sycamore Elementary (math 27% / reading 37%, grade F, #779 of 1,571 statewide, top 52%, 244 students, 75% FRL); Sequoia Middle (math 31% / reading 45%, grade F, #162 of 498 statewide, top 33%, 411 students, 69% FRL); Shasta High (math 53% / reading 76%, grade B-, #165 of 1,170 statewide, top 15%, 1,333 students, 44% FRL) — zoned schools average 63% FRL vs 16% district-wide (47 pts higher); higher-poverty schools than district average — tighter screening recommended.
- Market conditions: Rents rising fast (+7.5%/yr); 339 active listings in the ZIP; 246 units permitted in Shasta County in 2024 (0 in 5+ unit buildings).
Forward outlook
- Local home prices are declining (-3.0%/yr); year-one equity from $726 of loan paydown is wiped out by about $3k of value loss. Plan a longer hold.
- Shasta County population projected to shrink 9% by 2050 — rents likely to lag national; underwrite the cash flow, not the appreciation.
Negotiation context
- It's been on market 18 days — a 2% lower offer ($103k) is reasonable based on typical stale-listing flexibility.
- Current owner paid $16k; list at $105k implies a 577% gain — meaningful room to come down on a strong offer.
Risks & watch-outs
- Watch-outs: flood insurance adds $427/mo.
- Climate carrying-cost: in FEMA flood zone AE (mandatory federal flood insurance); severe wildfire risk; extreme-heat days projected 7→16/yr by 2055 (HVAC capex compounding) — expect insurance premiums to compound above CPI over the hold.
Questions for the listing agent
- What do current leases actually rent for vs. the listed asking? Can we see a recent rent roll and the last 12 months of T-12 income?
- What's the actual annual flood-insurance premium (NFIP or private), and is the property in a SFHA with mandatory coverage?
- Is there a deadline driving the sale (1031 exchange, divorce, estate, relocation)? That informs how much negotiation room exists.
- Schools are B-rated — typically a magnet for longer-tenancy family renters. What's the average tenant stay here, and is there a school-zone premium baked into asking?
- Crime grade is F in this area — have there been break-ins, vandalism, or insurance claims at this property in the last 3 years? What carrier currently insures it and at what premium?
- What's the average days-on-market for RENTAL listings here right now (not sales)? A rising rental-DOM trend means longer vacancies and softer asking-rent achievability than the comps imply.
- What's the recent tenant-quality profile in this submarket — average credit score on applications, eviction rate, late-payment / NSF rate, and stable-employment percentage? A property-management company in the area should have these aggregated.
- How much new for-sale + rental construction is in the pipeline within 1–3 miles? Heavy new supply typically softens prices + rents 12–24 months out; constrained supply supports both.
Investment metrics
- 1% rule
- 1.06% ✓
- Cap rate
- 8.08%
- Cash-on-cash
- 6.37%
- DSCR
- 1.28
- GRM
- 7.8
CMA / ARV
- ARV (on-the-fly)
- $40,880
- Comps found
- 11
Show comp detail 11 sales within ~0.75 mi
| Address | Dist | Beds/Ba | Sqft | Sold | Price | $/sf | Match |
|---|---|---|---|---|---|---|---|
| 2200 Jewell Ln #16 | 0.16mi | 2/1.0 | 742 (+2%) | 2mo | $59,999 | $81 | 88 |
| 2200 Jewell Ln #28 Ln Unit Rolling Ranch Mobile Home | 0.16mi | 2/1.0 | 728 (-0%) | 12mo | $62,000 | $85 | 82 |
| 5812 Cedars Rd #19 | 0.05mi | 2/1.0 | 660 (-10%) | 5mo | $12,500 | $19 | 78 |
| 2237 Jewell Ln #2 | 0.34mi | 2/1.0 | 720 (-1%) | 6mo | $27,500 | $38 | 77 |
| 5812 Cedars Rd #35 | 0.04mi | 2/1.0 | 672 (-8%) | 12mo | $14,000 | $21 | 74 |
| 2237 Jewell Ln #4 | 0.34mi | 2/1.0 | 750 (+3%) | 8mo | $49,900 | $67 | 73 |
| 2237 Jewell Ln #7 | 0.34mi | 2/1.0 | 728 (-0%) | 15mo | $30,000 | $41 | 71 |
| 5812 Cedars Rd #31 | 0.00mi | 2/1.0 | 800 (+10%) | 16mo | $45,000 | $56 | 70 |
| 2200 Jewell Ln #8 Ln Unit Rolling Ranch Mobile Home Park | 0.16mi | 2/1.0 | 798 (+9%) | 16mo | $59,900 | $75 | 64 |
| 2237 Jewell Ln Ln #20 | 0.34mi | 1/1.0 (-1) | 660 (-10%) | 20mo | $24,000 | $36 | 47 |
| 1595 Branstetter Cir | 0.60mi | 2/1.0 | 800 (+10%) | 16mo | $128,500 | $161 | 43 |
Match score weights: distance 35% · size 25% · config 20% · recency 20%. Top-matched comps best support the ARV.
Projected returns pro-forma
-3.0% appreciation · 7.55% rent growth · sell at horizon
- IRR
- -27.3%
- Equity multiple
- 0.03×
- Total profit
- $-28,617
- Equity at exit
- $15,654
- IRR
- -9.2%
- Equity multiple
- 0.26×
- Total profit
- $-21,879
- Equity at exit
- $9,078
Cash invested: $29,397 (down + closing). Projections, not guarantees.
Landlord ↔ Tenant lean methodology
- Overall (STATE)
- 18 Strongly Tenant-Friendly
- State California
- 18 Strongly Tenant-Friendly · D+13
- County
- — inherits STATE
- City
- — inherits STATE
ZIP-level market 96001
- Rents YoY
- 7.5%
- Active inventory
- 339
- Price-to-rent
- 7.8×
Monthly cashflow live
- Estimated rent
- $1,116 medium interval (Pro) →
- Mortgage (P&I)
- −$551
- Tax est. 1.5%
- −$131 /mo · $1,575/yr
- Insurance
- −$44
- Flood insurance flood zone
- −$427 /mo · $5,118/yr
- HOA
- −$0
- Lot rent leased land?
- −$0
- Vacancy / Maint / Mgmt
- −$234
- Net cashflow
- $-270
Break-even live
Sensitivity live
| Price | -10% $-198 | -5% $-234 | +0% $-270 | +5% $-307 | +10% $-343 |
|---|---|---|---|---|---|
| Rent | -10% $-359 | -5% $-315 | +0% $-270 | +5% $-226 | +10% $-182 |
| Rate | -1.0pp $-218 | -0.5pp $-244 | base $-270 | +0.5pp $-298 | +1.0pp $-325 |
UW: 25.0% down · 7.5% · 30yr · 1.5% tax · 5.0% vac · 8.0% maint · 8.0% mgmt
Financing live
Cash to close
- Down payment
- $26,248
- Closing costs
- $3,150
- Reserves months
- —
- Total cash needed
- —
Loan-product check · same deal, 3 products live
Conventional
25% down · 7.5% · 30yr
- Down + closing
- —
- Monthly P&I
- —
- Monthly cashflow
- —
- DSCR
- —
- Eligible?
- —
Personal DTI + credit; lowest rate.
DSCR
20% down · 8.5% · 30yr
- Down + closing
- —
- Monthly P&I
- —
- Monthly cashflow
- —
- DSCR
- —
- Eligible?
- —
No personal income docs; deal must DSCR.
Hard money
10% down · 12.0% · 12mo
- Down + closing
- —
- Monthly P&I
- —
- Monthly cashflow
- —
- DSCR
- —
- Eligible?
- —
Short-term bridge; refi at stabilization.
Listing history 14 events
-
2026-06-21days on market $104,990 Active 18 DOM
-
2026-06-19days on market $104,990 Active 16 DOM
-
2026-06-18days on market $104,990 Active 15 DOM
-
2026-06-17days on market $104,990 Active 14 DOM
-
2026-06-16days on market $104,990 Active 13 DOM
-
2026-06-15days on market $104,990 Active 12 DOM
-
2026-06-14days on market $104,990 Active 10 DOM
-
2026-06-13days on market $104,990 Active 9 DOM
-
2026-06-10days on market $104,990 Active 7 DOM
-
2026-06-09days on market $104,990 Active 6 DOM
-
2026-06-08days on market $104,990 Active 5 DOM
-
2026-06-07days on market $104,990 Active 4 DOM
-
2026-06-05remarks 326-char remark
-
2026-06-05$104,990 Active 1 DOM
ⓘ Source: listings_history table (triggers on properties + properties_extension) + one-shot
backfill from property_details.listing_events for pre-trigger history.
Climate risk First Street
- Flood 1/10 Low FEMA zone AE · 0% chance over 30 yrs
- Wildfire 8/10 Severe
- Heat 8/10 Severe 7 d/yr ≥105°F today · 16 d/yr by 30 yrs out
- Wind 1/10 Low
- Air quality 10/10 Extreme 33 unhealthy d/yr today · 38 by 30 yrs out
Nearby sold comps map
Loading sold comps map…
Walkable amenities ~0.75 mi
Loading nearby amenities…
Taxation est. · year 1
- Rental income
- $13,392
- − Mortgage interest
- −$5,881
- − Property taxes
- −$1,575
- − Insurance
- −$5,643
- − Repairs & maintenance
- −$1,071
- − Management
- −$1,071
- − Depreciation
- −$3,054
- Taxable loss
- −$4,904
- Est. tax savings @ 24.0%
- +$1,177
- After-tax cash flow
- $-2,069/yr
For passive investors: Depreciation is non-cash, so a rental often shows a tax loss while cash-flowing — sheltering income. Rental losses are passive: they offset passive income freely, and up to $25,000/yr can offset ordinary (W-2) income if you actively participate and your MAGI is under $100k (phasing out to $0 by $150k); unused losses carry forward. On sale, claimed depreciation is recaptured at up to 25%, and gains may owe capital-gains tax (a 1031 exchange can defer both). Figures are a year-1 estimate at your 24.0% rate — not tax advice; consult a CPA.
Schools (NCES district)
- District
- Shasta Union High
- NCES district ID
- 0636600
- Math proficiency
- 41% ▲ 3.00%
- Reading proficiency
- 67% ▲ 9.00%
- Median HH income
- $50,080
- Composite
- 46.01/100
- National rank
- #2532
- State rank
- #122 of 517 in CA
Livability — Redding
- Score
- 76/100
- State rank
- #106
- US rank
- #3726
Category grades
Schools grade is shown separately in the Schools card above.
Census & demographics
- Census place
- Redding, CA
- County
- Shasta County · 147,641 people
- City population
- 112,523
- Metro
- Redding, CA
- Population (ZIP)
- 33,817
- Household income
- $72,484
- Rent vs Own
- Severe rent burden
- 1458.0
Population outlook (Shasta County) Hauer SSP2
- Today (2025)
- 179,231 people
- By 2030
- 176,953 · -1.3%
- By 2040
- 169,982 · -5.2%
- By 2050
- 162,547 · -9.3%
- By 2075
- 145,649 · -18.7%
- By 2100
- 123,025 · -31.4%
Race, ethnicity, and origin ACS 2023
- Neighborhood character
- Predominantly White (79%)
- Race & ethnicity
- White 79% Hispanic / Latino 10% Two or more races 10% Asian 2% Native American 1% Black 1%
- Hispanic origin (detail)
- Mexican 6%
- Common ancestry
- Italian 4% Lithuanian 3% Portuguese 2%
- Foreign-born
- 3% · Canada
- Languages at home
- 94% English-only · Spanish 3% Other Indo-European 1% Other Asian/Pacific 1%
Political lean MEDSL · Shasta
- 2024 margin
- Solid R (+36.5) · D 30.5% · R 67.0% · Other 2.5%
- 2008→2024 swing
- -10.7pp toward R · 2008: -25.8pp · 2024: -36.5pp
- All cycles
- 2024: R+36.5 2020: R+33.1 2016: R+37.4 2012: R+30.3 2008: R+25.8
Not yet ingested
- Civics
- —
Market trends
- HPI YoY
- ▼ -199.25%
- Current HPI
- 291.6191
- Rent YoY
- ▲ 7.55%
- Metro
- Redding, CA
- State GDP YoY
- ▲ 3.21%
- F500 in state
- 116
Industry mix (Fortune 500 HQ in CA)
| Industry | F500 HQs | Revenue |
|---|---|---|
| Technology | 27 | $1,492B |
|
||
| Financial Services | 3 | $174B |
|
||
| Retail | 3 | $44B |
|
||
| Insurance | 3 | $26B |
|
||
| Media / Entertainment | 2 | $115B |
|
||
| Pharmaceuticals / Biotech | 2 | $62B |
|
||
Price history
+0.0% since first listed2 events — show timeline
- 2019-07-05 Sold (MLS) $15,500 SAOR
- 2019-03-22 Listed $15,500 SAOR
Property tax history
+0.2%/yrLatest (2018): $27 · -1.3% YoY. Source: county tax records.
Cash-flow waterfall
monthlySold comps — $/sqft
last 12 mo · ≤1 miLoading sold comps…