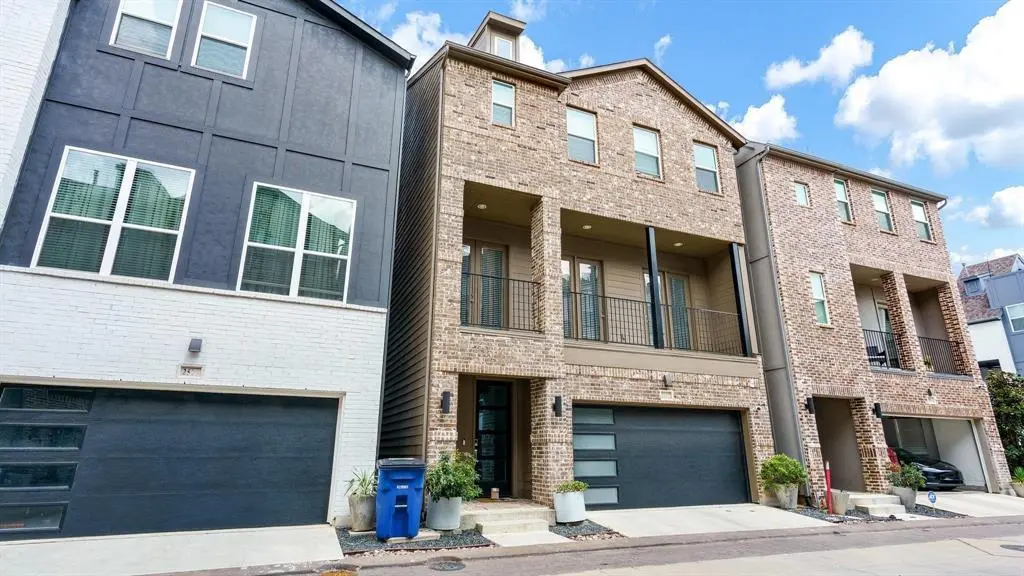
2512 Carolwood Ln · Dallas, TX
Flood risk 1/10 · Minimal
- FEMA flood zone
- X
- Chance of flooding over 30 yrs
- 0.0%
- Est. flood insurance / yr
- $507 – $1,088
Fire risk 1/10 · Minimal
- Est. fire insurance / yr
- $1,222 – $2,270
Heat risk 7/10 · Major
- Hot days now (above 109°F)
- 7 days/yr
- Hot days in 30 yrs
- 23 days/yr
Wind risk 6/10 · Moderate
- Chance of severe wind over 30 yrs
- 27.0%
Air-quality risk 3/10 · Minor
- Unhealthy air days now
- 2 days/yr
- Unhealthy air days in 30 yrs
- 3 days/yr
Risk factors via First Street. Map © Google.
Why this score? — see what drove the D- grade
The composite is a weighted blend of 9 inputs, each scored 0–100. Each bar is that input's sub-score; the figure is the points it added to the 100-point composite (weight × sub-score).
- ARV discount +15.0/15.0
- Appreciation +10.0/10.0
- Livability +4.0/5.0
- Schools +2.8/10.0
- Cash flow +2.7/30.0
- Condition / age +2.5/5.0
- Rent growth +1.4/5.0
- 1% rule +0.9/10.0
- DSCR +0.0/10.0
$519,900
🖨 Deal sheet (PDF) 📄 Offer letter ✓ Due diligence
Listing remarks MLS
Showings will begin on Monday, March 22. Discover this stunning, 2022 build featuring 3 bedrooms and 2.5 baths. This home boasts modern finishes, a large kitchen, and an open living space with a spacious balcony perfect for entertaining. The large primary suite includes an en-suite bath and an oversized closet. Unique to this community, this floor plan offers a large covered patio right off the yard. Enjoy luxury community amenities including a large pool, bowling alley, fitness center, golf simulator, and hosting space. Plus, you'll soon have direct access to the upcoming 5-acre lagoon. These amenities are incredibly unique to a single family home community. Come see this exceptional home for yourself! Buyer and buyer’s agent to verify accuracy of all information including room & lot sizes, schools, taxes, amenities, HOA, etc. Neither Seller nor Listing Agent makes any warranties or representation as to accuracy.
Key facts
- Spacious balcony
- Large pool
- Large kitchen
Tags
Neighborhood map
What this means for you Summary
Snapshot
- This is a 3-bed/2.5-bath townhouse listed at $520k.
Deal economics
- At list price, monthly cash flow is $-2k ($-21k/yr) — negative.
- To cash-flow at today's rent, offer at most $239k (54.0% below list).
- To meet the 1% rule (rent ≥ 1% of price), the offer needs to be $309k (40.6% below list).
- Recommended offer: $239k (54.0% below list) — sets the bar for cash-flow.
Location & tenants
- Location reads 81/100 on livability (#24 in TX, #1,380 nationally) — a professional / high-income tenant draw. Strengths: amenities A+, commute A+, housing A+; Watch: crime F.
- Dallas ISD (urban): math 31% / reading 36% proficiency, ranked #559 of 826 in TX (top 68%) — families likely to look elsewhere, expect single-tenant / working-renter base with shorter leases; 83% free/reduced lunch — lower-income household profile, screen leases tightly.
- Zoned schools: Jesus Moroles Expressive Arts Vanguard (math 23% / reading 43%, grade F, #2,208 of 4,322 statewide, top 52%, 627 students, 75% FRL); D A Hulcy Steam Middle (math 33% / reading 32%, grade F, #947 of 1,662 statewide, top 58%, 423 students, 88% FRL); L G Pinkston H S (math 10% / reading 21%, grade F, #1,505 of 1,632 statewide, top 92%, 1,139 students, 92% FRL) — zoned schools at 85% FRL track the district average.
- Market conditions: Rents falling (-4.2%/yr); 249 active listings in the ZIP; 40 comparable units currently listed for rent nearby; rentals at typical pace (median 21d on market — plan ~3-4 weeks tenant-placement turnaround); 12,577 units permitted in Dallas County in 2024 (6,829 in 5+ unit buildings).
- At $3,089/mo this rent would consume 62% of the median local household income ($60k/yr) (locally 892% of renters already pay >50% of income on rent) — very limited rent-growth headroom before tenants either downsize or default.
Forward outlook
- In year one you build about $56k of equity ($4k loan paydown + $52k appreciation (10.0% local appreciation)).
- Dallas County population projected at +35% by 2050 — long-run rental-demand tailwind backs the buy-and-hold thesis.
- By year 2, paydown + projected appreciation supports a ~$89k cash-out refi (75% LTV) — recoverable capital for the next deal without selling this one.
Negotiation context
- It's been on market 93 days — a 9% lower offer ($473k) is reasonable based on typical stale-listing flexibility.
- 6 sale attempts since 5y ago; this cycle's ask is 14342% above the opening price — seller raised mid-cycle; expect resistance to lowballs.
Risks & watch-outs
- Climate carrying-cost: major wind risk, 27% chance of damaging wind over 30y; extreme-heat days projected 7→23/yr by 2055 (HVAC capex compounding) — expect insurance premiums to compound above CPI over the hold.
Questions for the listing agent
- What do current leases actually rent for vs. the listed asking? Can we see a recent rent roll and the last 12 months of T-12 income?
- It's been on market 93 days. Have you received any prior offers? Is the seller open to a 54% concession, seller financing, or rate buy-down credit?
- What does the HOA fee cover, when was the last increase, and are there any pending special assessments or reserve-fund shortfalls?
- Why hasn't it sold? Are there any deal-killer items the seller is aware of (foundation, flood, title, zoning, code violations)?
- Is there a deadline driving the sale (1031 exchange, divorce, estate, relocation)? That informs how much negotiation room exists.
- Crime grade is F in this area — have there been break-ins, vandalism, or insurance claims at this property in the last 3 years? What carrier currently insures it and at what premium?
- The area grade is low — what's the realistic commute time and amenity access for the typical tenant pool here? Any planned neighborhood developments (good or bad) we should know about?
- What's the average days-on-market for RENTAL listings here right now (not sales)? A rising rental-DOM trend means longer vacancies and softer asking-rent achievability than the comps imply.
- What's the recent tenant-quality profile in this submarket — average credit score on applications, eviction rate, late-payment / NSF rate, and stable-employment percentage? A property-management company in the area should have these aggregated.
- How much new for-sale + rental construction is in the pipeline within 1–3 miles? Heavy new supply typically softens prices + rents 12–24 months out; constrained supply supports both.
Investment metrics
- 1% rule
- 0.59% ✗
- Cap rate
- 2.23%
- Cash-on-cash
- -14.52%
- DSCR
- 0.35
- GRM
- 14.0
CMA / ARV
- ARV (median comp)
- $631,967
- List price
- $519,900
- Delta
- -17.73%
- Verdict
- UNDERPRICED
- Comps
- 20 within 1.0 mi
Show comp detail 1 sale within ~0.75 mi
| Address | Dist | Beds/Ba | Sqft | Sold | Price | $/sf | Match |
|---|---|---|---|---|---|---|---|
| 1012 Bastion Ct | 0.27mi | 3/3.5 | 1,800 (-6%) | 12mo | $564,000 | $313 | 63 |
Match score weights: distance 35% · size 25% · config 20% · recency 20%. Top-matched comps best support the ARV.
Projected returns pro-forma
10.0% appreciation · 0.0% rent growth · sell at horizon
- IRR
- 13.5%
- Equity multiple
- 2.12×
- Total profit
- $162,341
- Equity at exit
- $468,367
- IRR
- 13.2%
- Equity multiple
- 4.78×
- Total profit
- $550,912
- Equity at exit
- $1,010,051
Cash invested: $145,572 (down + closing). Projections, not guarantees.
Landlord ↔ Tenant lean methodology
- Overall (STATE)
- 87 Strongly Landlord-Friendly
- State Texas
- 87 Strongly Landlord-Friendly · R+5
- County
- — inherits STATE
- City
- — inherits STATE
ZIP-level market 75212
- Rents YoY
- -4.2%
- Active inventory
- 249
- Price-to-rent
- 14.0×
Monthly cashflow live
- Estimated rent
- $3,089 high interval (Pro) →
- Mortgage (P&I)
- −$2,726
- Tax from tax record
- −$995 /mo · $11,945/yr
- Insurance
- −$217
- HOA
- −$263
- Vacancy / Maint / Mgmt
- −$649
- Net cashflow
- $-1,761
Break-even live
Sensitivity live
| Price | -10% $-1,467 | -5% $-1,614 | +0% $-1,761 | +5% $-1,908 | +10% $-2,056 |
|---|---|---|---|---|---|
| Rent | -10% $-2,005 | -5% $-1,883 | +0% $-1,761 | +5% $-1,639 | +10% $-1,517 |
| Rate | -1.0pp $-1,499 | -0.5pp $-1,629 | base $-1,761 | +0.5pp $-1,896 | +1.0pp $-2,033 |
UW: 25.0% down · 7.5% · 30yr · 1.5% tax · 5.0% vac · 8.0% maint · 8.0% mgmt
Financing live
Cash to close
- Down payment
- $129,975
- Closing costs
- $15,597
- Reserves months
- —
- Total cash needed
- —
Loan-product check · same deal, 3 products live
Conventional
25% down · 7.5% · 30yr
- Down + closing
- —
- Monthly P&I
- —
- Monthly cashflow
- —
- DSCR
- —
- Eligible?
- —
Personal DTI + credit; lowest rate.
DSCR
20% down · 8.5% · 30yr
- Down + closing
- —
- Monthly P&I
- —
- Monthly cashflow
- —
- DSCR
- —
- Eligible?
- —
No personal income docs; deal must DSCR.
Hard money
10% down · 12.0% · 12mo
- Down + closing
- —
- Monthly P&I
- —
- Monthly cashflow
- —
- DSCR
- —
- Eligible?
- —
Short-term bridge; refi at stabilization.
Rent comps 40 comps
| Address | Beds | Baths | Sqft | Rent | $/sqft | DOM | Units | Dist |
|---|---|---|---|---|---|---|---|---|
| 2635 Carmelita St Dallas, TX | 3.0 | 3.5 | 2237 | $3,399 | $1.52 | 26d | 1 | 0.07mi |
| 2601 La Altura Ln Dallas, TX | 3.0 | 3.5 | 2233 | $4,200 | $1.88 | 45d | 1 | 0.07mi |
| 2654 Carolwood Ln Dallas, TX | 3.0 | 3.5 | 2174 | $3,500 | $1.61 | 45d | 1 | 0.09mi |
| 2633 La Altura Ln Dallas, TX | 3.0 | 3.5 | 2170 | $3,650 | $1.68 | 14d | 1 | 0.09mi |
| 2806 Chicago St Dallas, TX | 4.0 | 3.5 | 1976 | $2,900 | $1.47 | 26d | 1 | 0.15mi |
| 1190 Manacor Ln Dallas, TX | 3.0 | 3.5 | 1849 | $2,999 | $1.62 | 14d | 1 | 0.23mi |
| 1130 Tea Olive Ln Dallas, TX | 3.0 | 2.5 | 1751 | $3,000 | $1.71 | 45d | 1 | 0.27mi |
| 1115 Manacor Ln Dallas, TX | 3.0 | 2.5 | 1827 | $3,200 | $1.75 | 26d | 1 | 0.27mi |
| 1293 Clifftop Ln Dallas, TX | 2.0 | 2.5 | 1411 | $2,900 | $2.06 | 45d | 1 | 0.29mi |
| 1040 Tea Olive Ln Dallas, TX | 3.0 | 3.5 | 2326 | $3,800 | $1.63 | 6d | 1 | 0.31mi |
| 1010 Singleton Blvd Unit 1043 Dallas, TX | 3.0 | 2.0 | 1581 | $3,127 | $1.98 | 0d | 1 | 0.34mi |
| 3105 Chihuahua Ave Dallas, TX | 4.0 | 2.5 | 2214 | $3,200 | $1.45 | 17d | 1 | 0.34mi |
| 3122 Chihuahua Ave Unit 1510240P Dallas, TX | 4.0 | 3.0 | 2174 | $5,369 | $2.47 | 1d | 1 | 0.36mi |
| 990 Singleton Blvd Dallas, TX | 2.0 | 1.0–2.5 | 942 | $2,235 | $2.37 | 1d | 26 | 0.38mi |
| 909 Bayonne St Dallas, TX | 4.0 | 3.5 | 2300 | $4,300 | $1.87 | 45d | 1 | 0.38mi |
| 3129 Rutz St Dallas, TX | 4.0 | 2.5 | 2102 | $7,850 | $3.73 | 45d | 1 | 0.39mi |
| 3129 Rutz St Unit 1241909P Dallas, TX | 4.0 | 2.5 | 2098 | $9,353 | $4.46 | 24d | 1 | 0.39mi |
| 1849 Pollard St Dallas, TX | 4.0 | 4.5 | 2438 | $3,995 | $1.64 | 45d | 1 | 0.41mi |
| 2811 Harston St Dallas, TX | 3.0 | 2.0 | 1937 | $2,950 | $1.52 | 45d | 1 | 0.43mi |
| 3226 Navaro St Dallas, TX | 3.0 | 2.0 | 1547 | $2,500 | $1.62 | 45d | 1 | 0.45mi |
| 3237 Chihuahua Ave Dallas, TX | 4.0 | 2.5 | 2251 | $4,500 | $2.00 | 45d | 1 | 0.47mi |
| 3321 Rutz St Dallas, TX | 3.0 | 2.5 | 1436 | $2,550 | $1.78 | 6d | 1 | 0.53mi |
| 1907 Nomas St Dallas, TX | 3.0 | 2.0 | 1368 | $2,900 | $2.12 | 20d | 1 | 0.58mi |
| 1000 Fort Worth Ave Dallas, TX | 2.0–3.0 | 2.0–2.5 | 1951 | $4,722 | $2.42 | 0d | 5 | 0.58mi |
| 718 Fort Worth Ave Dallas, TX | 3.0 | 3.0 | 1452 | $2,672 | $1.84 | 24d | 1 | 0.60mi |
| 718 Fort Worth Ave Dallas, TX | 3.0 | 3.0 | 1452 | $2,672 | $1.84 | 14d | 1 | 0.60mi |
| 750 Fort Worth Ave Dallas, TX | 2.0 | 1.0–2.0 | 930 | $1,903 | $2.05 | 26d | 10 | 0.67mi |
| 750 Fort Worth Ave Dallas, TX | 2.0 | 2.0 | 1268 | $2,057 | $1.62 | 45d | 1 | 0.67mi |
| 750 Fort Worth Ave Dallas, TX | 3.0 | 1.0–2.0 | 1000 | $2,149 | $2.15 | 0d | 23 | 0.67mi |
| 660 Yorktown St Dallas, TX | 2.0 | 1.0–2.5 | 922 | $1,915 | $2.08 | 0d | 20 | 0.70mi |
| 3517 Chicago St Dallas, TX | 3.0 | 3.0 | 1538 | $1,200 | $0.78 | 8d | 1 | 0.71mi |
| 3525 Rutz St Dallas, TX | 3.0 | 2.5 | 2451 | $4,000 | $1.63 | 9d | 1 | 0.73mi |
| 1723 Shaw St Dallas, TX | 4.0 | 3.0 | 1720 | $2,699 | $1.57 | 9d | 1 | 0.76mi |
| 1610 Life Ave Dallas, TX | 3.0 | 2.5 | 1657 | $2,800 | $1.69 | 45d | 1 | 0.77mi |
| 411 W Commerce St Dallas, TX | 3.0 | 1.0–3.0 | 1155 | $1,930 | $1.67 | 0d | 21 | 0.81mi |
| 1916 Shaw St Dallas, TX | 4.0 | 3.0 | 2283 | $2,675 | $1.17 | 22d | 1 | 0.81mi |
| 444 W Commerce St Dallas, TX | 2.0 | 1.0–2.5 | 971 | $2,193 | $2.26 | 0d | 17 | 0.82mi |
| 320 Singleton Blvd Dallas, TX | 2.0 | 1.0–2.0 | 874 | $2,069 | $2.37 | 0d | 15 | 0.89mi |
| 1330 Winding Brook Ln Unit 1363 Dallas, TX | 3.0 | 2.0 | 1536 | $1,875 | $1.22 | 0d | 1 | 0.91mi |
| 1834 Bayside St Dallas, TX | 3.0 | 2.0 | 1322 | $2,000 | $1.51 | 19d | 1 | 0.98mi |
HOA detail
- Monthly dues
- $263 · $3,156/yr
- Likely covers
- poolgym
Listing history 39 events
-
2026-06-21days on market $519,900 Active 93 DOM
-
2026-06-18days on market $519,900 Active 90 DOM
-
2026-06-17days on market $519,900 Active 89 DOM
-
2026-06-16days on market $519,900 Active 88 DOM
-
2026-06-15days on market $519,900 Active 87 DOM
-
2026-06-13days on market $519,900 Active 85 DOM
-
2026-06-09days on market $519,900 Active 81 DOM
-
2026-06-08days on market $519,900 Active 80 DOM
-
2026-06-07days on market $519,900 Active 79 DOM
-
2026-06-04days on market $519,900 Active 76 DOM
-
2026-06-03days on market $519,900 Active 75 DOM
-
2026-06-02days on market $519,900 Active 74 DOM
-
2026-06-02days on market $519,900 Active 73 DOM
-
2026-05-31days on market $519,900 Active 72 DOM
-
2026-05-05historical $3,600
-
2026-03-21$3,600
-
2026-03-20$519,900 Active 937-char remark
Show marketing remark (937 chars)
Showings will begin on Monday, March 22. Discover this stunning, 2022 build featuring 3 bedrooms and 2.5 baths. This home boasts modern finishes, a large kitchen, and an open living space with a spacious balcony perfect for entertaining. The large primary suite includes an en-suite bath and an oversized closet. Unique to this community, this floor plan offers a large covered patio right off the yard. Enjoy luxury community amenities including a large pool, bowling alley, fitness center, golf simulator, and hosting space. Plus, you'll soon have direct access to the upcoming 5-acre lagoon. These amenities are incredibly unique to a single family home community. Come see this exceptional home for yourself! Buyer and buyer’s agent to verify accuracy of all information including room & lot sizes, schools, taxes, amenities, HOA, etc. Neither Seller nor Listing Agent makes any warranties or representation as to accuracy.
-
2025-03-25soldstatus
-
2025-02-04historical $3,250
-
2025-01-21price $3,250
-
2024-12-04price $3,450
-
2024-11-23historical
-
2024-10-20price $3,600
-
2024-08-22price $3,950
-
2024-08-21price $639,900
-
2024-08-06$4,000
-
2024-07-31$649,900 Active
-
2022-10-27soldstatus Closed
-
2022-08-30status Pending
-
2022-08-06price $629,000
-
2022-07-08$643,000 Active
-
2022-03-21status Pending
-
2022-03-14historical
-
2022-03-04price $643,000
-
2022-02-17price $623,000
-
2022-01-10price $613,000
-
2021-08-23price $553,000
-
2021-05-14price $533,000
-
2021-05-13$513,000 Active
ⓘ Source: listings_history table (triggers on properties + properties_extension) + one-shot
backfill from property_details.listing_events for pre-trigger history.
Tax reassessment forecast TX · Resets to sale price
- Current annual tax
- $11,945 · $995/mo
- Projected year-2 tax
- $11,945 · $995/mo
- Expected delta
- $0/yr ($0/mo · 0.0%)
ⓘ Screening estimate from a state-policy table — verify with the county assessor before closing.
Climate risk First Street
- Flood 1/10 Low FEMA zone X · 0% chance over 30 yrs
- Wildfire 1/10 Low
- Heat 7/10 Severe 7 d/yr ≥109°F today · 23 d/yr by 30 yrs out
- Wind 6/10 Major 27% chance of damaging wind over 30 yrs
- Air quality 3/10 Moderate 2 unhealthy d/yr today · 3 by 30 yrs out
Nearby sold comps map
Loading sold comps map…
Walkable amenities ~0.75 mi
Loading nearby amenities…
Taxation est. · year 1
- Rental income
- $37,065
- − Mortgage interest
- −$29,122
- − Property taxes
- −$11,945
- − Insurance
- −$2,600
- − Repairs & maintenance
- −$2,965
- − Management
- −$2,965
- − HOA
- −$3,156
- − Depreciation
- −$15,124
- Taxable loss
- −$30,812
- Est. tax savings @ 24.0%
- +$7,395
- After-tax cash flow
- $-13,741/yr
For passive investors: Depreciation is non-cash, so a rental often shows a tax loss while cash-flowing — sheltering income. Rental losses are passive: they offset passive income freely, and up to $25,000/yr can offset ordinary (W-2) income if you actively participate and your MAGI is under $100k (phasing out to $0 by $150k); unused losses carry forward. On sale, claimed depreciation is recaptured at up to 25%, and gains may owe capital-gains tax (a 1031 exchange can defer both). Figures are a year-1 estimate at your 24.0% rate — not tax advice; consult a CPA.
Schools (NCES district)
- District
- Dallas ISD
- NCES district ID
- 4816230
- Math proficiency
- 31% ▼ -16.00%
- Reading proficiency
- 36% ▼ -4.00%
- Median HH income
- $42,881
- Composite
- 28.41/100
- National rank
- #6763
- State rank
- #559 of 826 in TX
Livability — Dallas
- Score
- 81/100
- State rank
- #24
- US rank
- #1380
Category grades
Schools grade is shown separately in the Schools card above.
Census & demographics
- Census place
- Dallas, TX
- County
- Dallas County · 2,612,404 people
- City population
- 1,168,437
- Metro
- Dallas-Fort Worth-Arlington, TX
- Population (ZIP)
- 28,259
- Household income
- $59,750
- Rent vs Own
- Severe rent burden
- 892.0
Population outlook (Dallas County) Hauer SSP2
- Today (2025)
- 2,979,839 people
- By 2030
- 3,191,823 · +7.1%
- By 2040
- 3,619,611 · +21.5%
- By 2050
- 4,026,915 · +35.1%
- By 2075
- 4,957,073 · +66.4%
- By 2100
- 5,508,725 · +84.9%
Race, ethnicity, and origin ACS 2023
- Neighborhood character
- Predominantly Hispanic (67%)
- Race & ethnicity
- Hispanic / Latino 67% Two or more races 26% Black 23% White 6% Asian 2%
- Hispanic origin (detail)
- Mexican 55%
- Common ancestry
- Slovak 1%
- Foreign-born
- 27% · Canada, Vietnam, Jamaica
- Languages at home
- 42% English-only · Spanish 52% Vietnamese 1%
Political lean MEDSL · Dallas
- 2024 margin
- Strong D (+22.2) · D 60.2% · R 38.0% · Other 1.8%
- 2008→2024 swing
- +6.9pp toward D · 2008: 15.3pp · 2024: 22.2pp
- All cycles
- 2024: D+22.2 2020: D+31.6 2016: D+26.2 2012: D+15.4 2008: D+15.3
Not yet ingested
- Civics
- —
Market trends
- HPI YoY
- ▲ 138.69%
- Current HPI
- 477.2035
- Rent YoY
- ▼ -4.21%
- Metro
- Dallas-Fort Worth-Arlington, TX
- State GDP YoY
- ▲ 3.95%
- F500 in state
- 110
Industry mix (Fortune 500 HQ in TX)
| Industry | F500 HQs | Revenue |
|---|---|---|
| Energy | 16 | $1,198B |
|
||
| Technology | 5 | $198B |
|
||
| Engineering / Construction | 4 | $72B |
|
||
| Energy Services | 3 | $60B |
|
||
| Utilities | 3 | $41B |
|
||
| Healthcare | 2 | $330B |
|
||
Price history
-99.3% since first listed25 events — show timeline
- 2026-05-05 Rental Removed $3,600 NTREIS
- 2026-03-21 Listed for Rent $3,600 NTREIS
- 2026-03-20 Listed $519,900 NTREIS
- 2025-03-25 Sold (Public Records) — Public Records
- 2025-02-04 Rental Removed $3,250 NTREIS
- 2025-01-21 Price Changed $3,250 NTREIS
- 2024-12-04 Price Changed $3,450 NTREIS
- 2024-11-23 Listing Removed — NTREIS
- 2024-10-20 Price Changed $3,600 NTREIS
- 2024-08-22 Price Changed $3,950 NTREIS
- 2024-08-21 Price Changed $639,900 NTREIS
- 2024-08-06 Listed for Rent $4,000 NTREIS
- 2024-07-31 Listed $649,900 NTREIS
- 2022-10-27 Sold (MLS) — NTREIS
- 2022-08-30 Pending — NTREIS
- 2022-08-06 Price Changed $629,000 NTREIS
- 2022-07-08 Listed $643,000 NTREIS
- 2022-03-21 Pending — NTREIS
- 2022-03-14 Listing Removed — NTREIS
- 2022-03-04 Price Changed $643,000 NTREIS
- 2022-02-17 Price Changed $623,000 NTREIS
- 2022-01-10 Price Changed $613,000 NTREIS
- 2021-08-23 Price Changed $553,000 NTREIS
- 2021-05-14 Price Changed $533,000 NTREIS
- 2021-05-13 Listed $513,000 NTREIS
Property tax history
+30.1%/yrLatest (2025): $11,945 · -0.4% YoY. Source: county tax records.
Cash-flow waterfall
monthlySold comps — $/sqft
last 12 mo · ≤1 miLoading sold comps…