19 Saint Thomas Ave · El Cerro Mission, NM
Flood risk 5/10 · Moderate
- FEMA flood zone
- X (unshaded)
- Chance of flooding over 30 yrs
- 0.58%
- Est. flood insurance / yr
- $507 – $1,088
Fire risk 5/10 · Moderate
- Est. fire insurance / yr
- $706 – $1,312
Heat risk 5/10 · Moderate
- Hot days now (above 96°F)
- 7 days/yr
- Hot days in 30 yrs
- 19 days/yr
Wind risk 1/10 · Minimal
- Chance of severe wind over 30 yrs
- —
Air-quality risk 1/10 · Minimal
- Unhealthy air days now
- 0 days/yr
- Unhealthy air days in 30 yrs
- 0 days/yr
Risk factors via First Street. Map © Google.
Why this score? — see what drove the D+ grade
The composite is a weighted blend of 9 inputs, each scored 0–100. Each bar is that input's sub-score; the figure is the points it added to the 100-point composite (weight × sub-score).
- Cash flow +14.1/30.0
- ARV discount +11.2/15.0
- Rent growth +5.0/5.0
- DSCR +4.3/10.0
- 1% rule +3.9/10.0
- Schools +2.6/10.0
- Condition / age +2.5/5.0
- Livability +2.3/5.0
- Appreciation +0.0/10.0
$275,000
🖨 Deal sheet (PDF) 📄 Offer letter ✓ Due diligence
Listing remarks
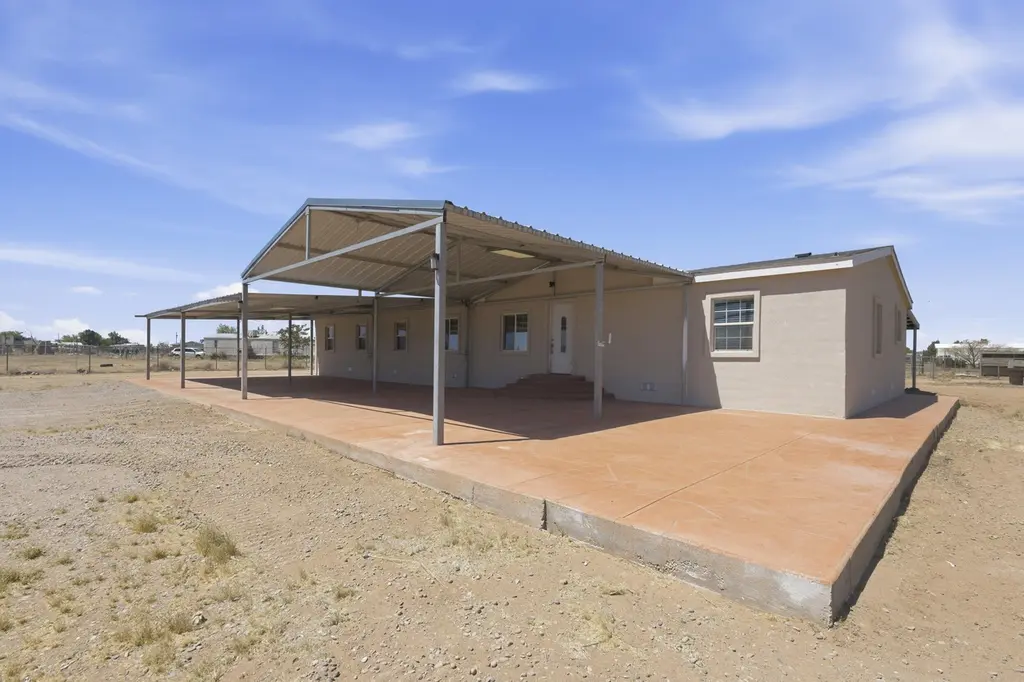
Welcome to this beautifully updated 5bedroom, 2bath doublewide manufactured home situated on 1.33 acres of land. This property offers the perfect blend of space, comfort, and country living with modern upgrades throughout. Step inside to an open-concept floor plan featuring a spacious living area, fresh finishes, and stylish flooring that flows seamlessly into the upgraded kitchen. The kitchen boasts rich wood cabinetry, sleek countertops, stainless steel appliances, and a large island, making it ideal for both everyday living and entertaining. Outside, Enjoy the convenience of an automatic gated entry for added privacy and security. The expansive lot provides plenty of room for all your ne
Key facts
- Expansive lot
- Upgraded kitchen
- 1.33 acre lot
Tags
Property features AI
Exterior
- Parking: Carport with 6 spaces
- Utilities: Electricity connected; Propane; Sewer connected (septic tank); Water connected (shared well)
- Home design: Single-story property; Faces south; Permanent foundation; Resale mobile home model Value Master 6080-V (76' x 32')
- Construction: Stucco construction; Pitched shingle roof
- Exterior features: Private yard; Covered patio; Owned propane tank; Stable(s); Shed(s); Full fencing; Off-grid lot features; County road frontage with dirt/gravel road surface; Horses allowed / currently used for horses
Interior
- Kitchen: Convection oven; Microwave; Refrigerator; Kitchen island
- Bedrooms: Main level bedrooms (several on the main level)
- Flooring: Laminate flooring; Vinyl flooring
- Bathrooms: One full bathroom; One three-quarter bathroom
- Heating & cooling: Central forced air heating; Refrigerated cooling
- Interior features: Ceiling fans; Kitchen island; Multiple living areas; Main-level primary; Shower-only bathroom with separate shower; Double pane insulated sliding windows
- Laundry & utility: Washer hookup; Electric dryer hookup; Gas dryer hookup
Neighborhood map
What this means for you Summary
Snapshot
- This is a 5-bed/2.0-bath other listed at $275k.
Deal economics
- At list price, monthly cash flow is $42 ($498/yr) — positive.
- The deal already cash-flows at list — no discount required.
- To meet the 1% rule (rent ≥ 1% of price), the offer needs to be $246k (10.6% below list).
- Recommended offer: $246k (10.6% below list) — sets the bar for 1% rule.
- Cap rate 6.5% vs local median 4.8% in El Cerro Mission — top-decile yield for the area; either an underpriced asset or a hidden risk that comps aren't pricing in. Stress-test before assuming the spread holds.
Location & tenants
- Location reads 46/100 on livability (#330 in NM) — a working-class tenant base; expect higher turnover. Strengths: cost of living A+; Watch: schools F, crime F, amenities F.
- Los Lunas Public Schools (suburban): math 20% / reading 34% proficiency, ranked #34 of 95 in NM (top 36%) — low school quality limits family demand, transient renter base, plan for 1-2y turnover; 63% free/reduced lunch — lower-income household profile, screen leases tightly.
- Market conditions: Rents rising fast (+33.2%/yr); 567 active listings in the ZIP; 303 units permitted in Valencia County in 2024 (0 in 5+ unit buildings).
- At $2,458/mo this rent would consume 48% of the median local household income ($61k/yr) (locally 602% of renters already pay >50% of income on rent) — very limited rent-growth headroom before tenants either downsize or default.
Forward outlook
- Local home prices are declining (-3.0%/yr); year-one equity from $2k of loan paydown is wiped out by about $8k of value loss. Plan a longer hold.
- Valencia County population projected at -14% by 2050 — secular population decline; favor cash flow + early exit over multi-decade hold.
Negotiation context
- It's been on market 48 days — a 3% lower offer ($267k) is reasonable based on typical stale-listing flexibility.
- 2 sale attempts with the ask held roughly flat each time — persistent listings suggest the price (not the market) is what's stuck; bring a comps-based counter.
Risks & watch-outs
- Climate carrying-cost: moderate flood risk; moderate wildfire risk; extreme-heat days projected 7→19/yr by 2055 (HVAC capex compounding) — expect insurance premiums to compound above CPI over the hold.
Questions for the listing agent
- It's been on market 48 days. Have you received any prior offers? Is the seller open to a 11% concession, seller financing, or rate buy-down credit?
- Is there a deadline driving the sale (1031 exchange, divorce, estate, relocation)? That informs how much negotiation room exists.
- Schools are F-rated, which usually means shorter tenancies and higher turnover. Who's the typical renter profile here, and what's been the actual vacancy rate?
- Crime grade is F in this area — have there been break-ins, vandalism, or insurance claims at this property in the last 3 years? What carrier currently insures it and at what premium?
- The area grade is low — what's the realistic commute time and amenity access for the typical tenant pool here? Any planned neighborhood developments (good or bad) we should know about?
- What's the average days-on-market for RENTAL listings here right now (not sales)? A rising rental-DOM trend means longer vacancies and softer asking-rent achievability than the comps imply.
- What's the recent tenant-quality profile in this submarket — average credit score on applications, eviction rate, late-payment / NSF rate, and stable-employment percentage? A property-management company in the area should have these aggregated.
- How much new for-sale + rental construction is in the pipeline within 1–3 miles? Heavy new supply typically softens prices + rents 12–24 months out; constrained supply supports both.
Investment metrics
- 1% rule
- 0.89% ✗
- Cap rate
- 6.47%
- Cash-on-cash
- 0.65%
- DSCR
- 1.03
- GRM
- 9.3
CMA / ARV
- ARV (median comp)
- $300,000
- List price
- $275,000
- Delta
- -8.33%
- Verdict
- FAIR
- Comps
- 1 within 2.0 mi
Projected returns pro-forma
-3.0% appreciation · 8.0% rent growth · sell at horizon
- IRR
- -9.8%
- Equity multiple
- 0.62×
- Total profit
- $-28,888
- Equity at exit
- $41,003
- IRR
- 5.4%
- Equity multiple
- 1.49×
- Total profit
- $37,530
- Equity at exit
- $23,777
Cash invested: $77,000 (down + closing). Projections, not guarantees.
Landlord ↔ Tenant lean methodology
- Overall (STATE)
- 55 Moderately Landlord-Leaning
- State New Mexico
- 55 Moderately Landlord-Leaning · D+3
- County
- — inherits STATE
- City
- — inherits STATE
ZIP-level market 87031
- Home prices YoY
- -29.8%
- Rents YoY
- 33.2%
- Active inventory
- 567
- Price-to-rent
- 9.3×
Monthly cashflow live
- Estimated rent
- $2,458 medium interval (Pro) →
- Mortgage (P&I)
- −$1,442
- Tax est. 1.5%
- −$344 /mo · $4,125/yr
- Insurance
- −$115
- HOA
- −$0
- Vacancy / Maint / Mgmt
- −$516
- Net cashflow
- $42
Break-even live
Sensitivity live
| Price | -10% $232 | -5% $137 | +0% $42 | +5% $-53 | +10% $-149 |
|---|---|---|---|---|---|
| Rent | -10% $-153 | -5% $-56 | +0% $42 | +5% $139 | +10% $236 |
| Rate | -1.0pp $180 | -0.5pp $111 | base $42 | +0.5pp $-30 | +1.0pp $-102 |
UW: 25.0% down · 7.5% · 30yr · 1.5% tax · 5.0% vac · 8.0% maint · 8.0% mgmt
Financing live
Cash to close
- Down payment
- $68,750
- Closing costs
- $8,250
- Reserves months
- —
- Total cash needed
- —
Loan-product check · same deal, 3 products live
Conventional
25% down · 7.5% · 30yr
- Down + closing
- —
- Monthly P&I
- —
- Monthly cashflow
- —
- DSCR
- —
- Eligible?
- —
Personal DTI + credit; lowest rate.
DSCR
20% down · 8.5% · 30yr
- Down + closing
- —
- Monthly P&I
- —
- Monthly cashflow
- —
- DSCR
- —
- Eligible?
- —
No personal income docs; deal must DSCR.
Hard money
10% down · 12.0% · 12mo
- Down + closing
- —
- Monthly P&I
- —
- Monthly cashflow
- —
- DSCR
- —
- Eligible?
- —
Short-term bridge; refi at stabilization.
Listing history 19 events
-
2026-06-19status $275,000 Pending 48 DOM
-
2026-06-18days on market $275,000 Active 48 DOM
-
2026-06-17days on market $275,000 Active 47 DOM
-
2026-06-16days on market $275,000 Active 46 DOM
-
2026-06-15days on market $275,000 Active 45 DOM
-
2026-06-13days on market $275,000 Active 43 DOM
-
2026-06-10days on market $275,000 Active 40 DOM
-
2026-06-09days on market $275,000 Active 39 DOM
-
2026-06-08days on market $275,000 Active 38 DOM
-
2026-06-07days on market $275,000 Active 37 DOM
-
2026-06-05days on market $275,000 Active 34 DOM
-
2026-06-03days on market $275,000 Active 33 DOM
-
2026-06-02days on market $275,000 Active 32 DOM
-
2026-06-01days on market $275,000 Active 31 DOM
-
2026-05-31days on market $275,000 Active 30 DOM
-
2026-05-11status Active 754-char remark
-
2026-04-30status Pending 754-char remark
-
2026-04-09$275,000 Active 754-char remark
-
2017-09-18soldstatus
ⓘ Source: listings_history table (triggers on properties + properties_extension) + one-shot
backfill from property_details.listing_events for pre-trigger history.
Climate risk First Street
- Flood 5/10 Major FEMA zone X (unshaded) · 58% chance over 30 yrs
- Wildfire 5/10 Major
- Heat 5/10 Major 7 d/yr ≥96°F today · 19 d/yr by 30 yrs out
- Wind 1/10 Low
- Air quality 1/10 Low 0 unhealthy d/yr today · 0 by 30 yrs out
Nearby sold comps map
Loading sold comps map…
Walkable amenities ~0.75 mi
Loading nearby amenities…
Taxation est. · year 1
- Rental income
- $29,499
- − Mortgage interest
- −$15,404
- − Property taxes
- −$4,125
- − Insurance
- −$1,375
- − Repairs & maintenance
- −$2,360
- − Management
- −$2,360
- − Depreciation
- −$8,000
- Taxable loss
- −$4,125
- Est. tax savings @ 24.0%
- +$990
- After-tax cash flow
- $1,489/yr
For passive investors: Depreciation is non-cash, so a rental often shows a tax loss while cash-flowing — sheltering income. Rental losses are passive: they offset passive income freely, and up to $25,000/yr can offset ordinary (W-2) income if you actively participate and your MAGI is under $100k (phasing out to $0 by $150k); unused losses carry forward. On sale, claimed depreciation is recaptured at up to 25%, and gains may owe capital-gains tax (a 1031 exchange can defer both). Figures are a year-1 estimate at your 24.0% rate — not tax advice; consult a CPA.
Schools (NCES district)
- District
- Los Lunas Public Schools
- NCES district ID
- 3501680
- Math proficiency
- 20% —
- Reading proficiency
- 34% —
- Median HH income
- $44,438
- Composite
- 26.11/100
- National rank
- #12724
- State rank
- #34 of 95 in NM
Livability — El Cerro Mission
- Score
- 46/100
- State rank
- #330
- US rank
- #26434
Category grades
Schools grade is shown separately in the Schools card above.
Census & demographics
- Census place
- El Cerro Mission, NM
- County
- Valencia County · 68,779 people
- Metro
- Albuquerque, NM
- Population (ZIP)
- 47,514
- Household income
- $60,902
- Rent vs Own
- Severe rent burden
- 602.0
Population outlook (Valencia County) Hauer SSP2
- Today (2025)
- 73,788 people
- By 2030
- 72,101 · -2.3%
- By 2040
- 67,930 · -7.9%
- By 2050
- 63,191 · -14.4%
- By 2075
- 53,644 · -27.3%
- By 2100
- 40,882 · -44.6%
Race, ethnicity, and origin ACS 2023
- Neighborhood character
- Majority Hispanic (63%)
- Race & ethnicity
- Hispanic / Latino 63% White 30% Two or more races 29% Native American 4% Black 1%
- Hispanic origin (detail)
- Mexican 38%
- Common ancestry
- Serbian 1% Russian 1% Slovak 1%
- Foreign-born
- 8% · Canada
- Languages at home
- 71% English-only · Spanish 27%
Political lean MEDSL · Valencia
- 2024 margin
- R (+16.4) · D 40.9% · R 57.3% · Other 1.8%
- 2008→2024 swing
- -24.1pp toward R · 2008: 7.7pp · 2024: -16.4pp
- All cycles
- 2024: R+16.4 2020: R+9.6 2016: R+8.7 2012: D+2.5 2008: D+7.7
Not yet ingested
- Civics
- —
Market trends
- HPI YoY
- ▼ -85.17%
- Current HPI
- 201.0508
- Rent YoY
- ▲ 33.16%
- Metro
- Albuquerque, NM
- State GDP YoY
- —
- F500 in state
- 0
Price history
5 events — show timeline
- 2026-06-18 Pending — Southwest MLS
- 2026-05-11 Relisted — Southwest MLS
- 2026-04-30 Pending — Southwest MLS
- 2026-04-09 Listed $275,000 Southwest MLS
- 2017-09-18 Sold (Public Records) — Public Records
Property tax history
+12.4%/yrLatest (2025): $248 · +27.1% YoY. Source: county tax records.
Cash-flow waterfall
monthlySold comps — $/sqft
last 12 mo · ≤1 miLoading sold comps…