2636 Tinosa Cir · Bellview, FL
Flood risk 1/10 · Minimal
- FEMA flood zone
- X (unshaded)
- Chance of flooding over 30 yrs
- 0.0%
- Est. flood insurance / yr
- $507 – $1,088
Fire risk 1/10 · Minimal
- Est. fire insurance / yr
- $947 – $1,759
Heat risk 10/10 · Severe
- Hot days now (above 105°F)
- 6 days/yr
- Hot days in 30 yrs
- 20 days/yr
Wind risk 9/10 · Severe
- Chance of severe wind over 30 yrs
- 99.0%
Air-quality risk 1/10 · Minimal
- Unhealthy air days now
- 0 days/yr
- Unhealthy air days in 30 yrs
- 0 days/yr
Risk factors via First Street. Map © Google.
Why this score? — see what drove the D grade
The composite is a weighted blend of 9 inputs, each scored 0–100. Each bar is that input's sub-score; the figure is the points it added to the 100-point composite (weight × sub-score).
- Cash flow +14.9/30.0
- ARV discount +8.6/15.0
- DSCR +4.6/10.0
- Rent growth +3.6/5.0
- Schools +3.6/10.0
- Livability +3.4/5.0
- 1% rule +3.0/10.0
- Condition / age +2.5/5.0
- Appreciation +0.0/10.0
$250,000
🖨 Deal sheet (PDF) 📄 Offer letter ✓ Due diligence
Listing remarks
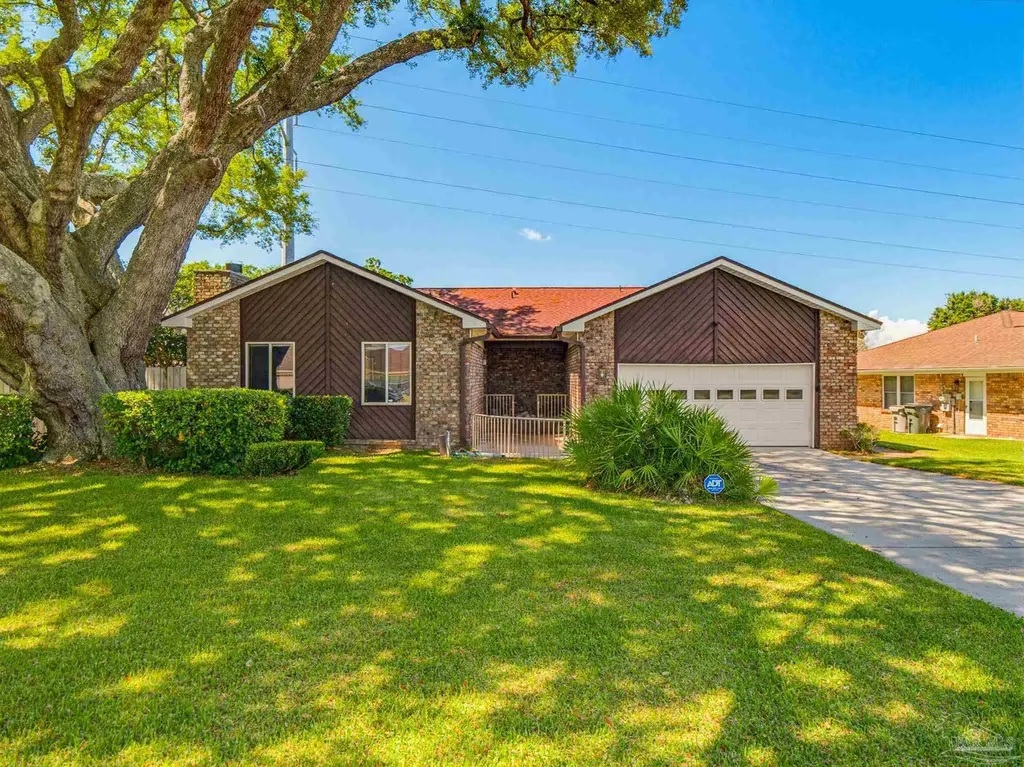
This lovingly cared for single story home is situation on a . 34 acre lot that also include one half of the adjacent vacated alley and an expertly maintained mature oak tree in the front yard. . The sellers use the SIDE ALLEY for ADDITIONAL PARKING and an entrance to the back yard which has space for an RV or BOAT. The home is ready for new owners who can update in their personal taste or move in as is. The kichen has granite countertops and stainless steel appliances. A beautiful set of cabinetry allow for great storage, soft close drawers and doors as well features a new glasstop electric range/oven. In the back yard, an in ground pool provides a great recreational and entertainment area
Key facts
- Mature oak tree
- Additional parking
- Raised deck
Tags
Property features AI
Finance
- HOA & community: Homeowners association with an annual fee of $45 (association fee covers association services)
Exterior
- Parking: Detached 2-car garage; Additional covered parking for 2 vehicles; Guest parking; Garage door opener; Total of 4 parking spaces
- Utilities: Public water; Public sewer; Electric with circuit breakers; Well for irrigation
- Home design: Single-story brick home; One level; Resale property; Not attached to other properties; Homestead exempt
- Construction: Composition roof; Slab foundation; Brick construction; Built on one level
- Exterior features: In-ground pool; Irrigation well; Rain gutters; Deck; Privacy and partial backyard fencing
Interior
- Kitchen: Remodeled kitchen with granite counters; Dishwasher; Disposal; Refrigerator; Electric water heater
- Bedrooms: Master bedroom on the first floor; Additional bedrooms on the first floor
- Flooring: Tile; Carpet
- Bathrooms: 2 full bathrooms
- Heating & cooling: Central heating; Fireplace(s) for supplemental heat; Central air conditioning
- Interior features: Shutters on windows
- Laundry & utility: Inside laundry with washer/dryer hookups
Neighborhood map
What this means for you Summary
Snapshot
- This is a 3-bed/2.0-bath single-family listed at $250k.
Deal economics
- At list price, monthly cash flow is $74 ($883/yr) — positive.
- The deal already cash-flows at list — no discount required.
- To meet the 1% rule (rent ≥ 1% of price), the offer needs to be $201k (19.6% below list).
- Recommended offer: $201k (19.6% below list) — sets the bar for 1% rule.
- Cap rate 6.6% vs local median 5.2% in Bellview — meaningfully above typical; check what's discounted (condition, days-on-market, listing class) to confirm the premium yield is real.
Location & tenants
- Location reads 67/100 on livability (#561 in FL) — a middle-class / working-renter tenant base. Strengths: cost of living A+, housing A+; Watch: amenities F, commute F, health & safety F.
- Escambia (suburban): math 40% / reading 45% proficiency, ranked #56 of 73 in FL (top 77%) — families likely to look elsewhere, expect single-tenant / working-renter base with shorter leases.
- Zoned schools: Longleaf Elementary School (math 37% / reading 43%, grade F, #1,491 of 2,144 statewide, top 70%, 548 students, 77% FRL); Bellview Middle School (math 17% / reading 23%, grade F, #558 of 571 statewide, top 98%, 992 students, 76% FRL); Pine Forest High School (math 20% / reading 32%, grade F, #494 of 667 statewide, top 75%, 1,870 students, 62% FRL).
- Zoned-school proficiency averages 29% at this address vs 42% district-wide (-14 pts) — the specific schools serving this property underperform the Escambia average; the district grade overstates school quality for this exact location.
- Market conditions: Rents rising fast (+4.4%/yr); 421 active listings in the ZIP; 15 comparable units currently listed for rent nearby; rentals at typical pace (median 25d on market — plan ~3-4 weeks tenant-placement turnaround); solid renter incomes; 1,479 units permitted in Escambia County in 2024 (0 in 5+ unit buildings).
- This rent runs 32% of the median local income ($75k/yr) — at the standard rent-burdened threshold; future hikes will face affordability resistance.
Forward outlook
- Local home prices are declining (-3.0%/yr); year-one equity from $2k of loan paydown is wiped out by about $8k of value loss. Plan a longer hold.
- Escambia County population projected at +13% by 2050 — modest demand growth; plan on rents tracking national, not racing it.
Negotiation context
- It's been on market 19 days — a 2% lower offer ($246k) is reasonable based on typical stale-listing flexibility.
- Current owner paid $80k; list at $250k implies a 214% gain — meaningful room to come down on a strong offer.
Risks & watch-outs
- Climate carrying-cost: severe wind risk, 99% chance of damaging wind over 30y; extreme-heat days projected 6→20/yr by 2055 (HVAC capex compounding) — expect insurance premiums to compound above CPI over the hold.
Questions for the listing agent
- Built in 1978 — when were the roof, HVAC, electrical panel, plumbing, and water heater last replaced?
- What does the HOA fee cover, when was the last increase, and are there any pending special assessments or reserve-fund shortfalls?
- Is there a deadline driving the sale (1031 exchange, divorce, estate, relocation)? That informs how much negotiation room exists.
- Schools are D-rated, which usually means shorter tenancies and higher turnover. Who's the typical renter profile here, and what's been the actual vacancy rate?
- The area grade is low — what's the realistic commute time and amenity access for the typical tenant pool here? Any planned neighborhood developments (good or bad) we should know about?
- What's the average days-on-market for RENTAL listings here right now (not sales)? A rising rental-DOM trend means longer vacancies and softer asking-rent achievability than the comps imply.
- What's the recent tenant-quality profile in this submarket — average credit score on applications, eviction rate, late-payment / NSF rate, and stable-employment percentage? A property-management company in the area should have these aggregated.
- How much new for-sale + rental construction is in the pipeline within 1–3 miles? Heavy new supply typically softens prices + rents 12–24 months out; constrained supply supports both.
Investment metrics
- 1% rule
- 0.80% ✗
- Cap rate
- 6.65%
- Cash-on-cash
- 1.26%
- DSCR
- 1.06
- GRM
- 10.4
CMA / ARV
- ARV (on-the-fly)
- $256,304
- Comps found
- 12
Show comp detail 12 sales within ~0.75 mi
| Address | Dist | Beds/Ba | Sqft | Sold | Price | $/sf | Match |
|---|---|---|---|---|---|---|---|
| 2637 Tinosa Cir | 0.04mi | 3/2.0 | 1,600 (+4%) | 4mo | $300,000 | $188 | 89 |
| 6056 West Shore Dr | 0.08mi | 3/2.0 | 1,463 (-5%) | 3mo | $280,000 | $191 | 85 |
| 2634 Tinosa Cir | 0.01mi | 3/2.0 | 1,711 (+11%) | 2mo | $324,900 | $190 | 80 |
| 6036 W Shore Dr | 0.11mi | 3/2.0 | 1,431 (-7%) | 4mo | $235,000 | $164 | 80 |
| 2626 Tinosa Cir | 0.07mi | 3/2.0 | 1,657 (+7%) | 6mo | $215,000 | $130 | 80 |
| 5897 Somerset Dr | 0.26mi | 3/2.0 | 1,646 (+7%) | 1mo | $272,500 | $166 | 76 |
| 6116 E Shore Dr | 0.50mi | 3/2.0 | 1,543 (-0%) | 6mo | $220,000 | $143 | 71 |
| 921 Lagoon Dr | 0.59mi | 3/1.5 | 1,546 (+0%) | 3mo | $244,700 | $158 | 68 |
| 6649 Black Oak Pl | 0.57mi | 4/2.0 (+1) | 1,488 (-4%) | 3mo | $250,000 | $168 | 60 |
| 6718 Bellview Pines Rd | 0.71mi | 3/2.0 | 1,494 (-3%) | 3mo | $190,000 | $127 | 59 |
| 2238 White Pines Dr | 0.46mi | 3/2.0 | 1,400 (-9%) | 6mo | $222,000 | $159 | 58 |
| 5650 Talquin Ave | 0.52mi | 3/2.0 | 1,381 (-11%) | 1mo | $257,000 | $186 | 57 |
Match score weights: distance 35% · size 25% · config 20% · recency 20%. Top-matched comps best support the ARV.
Projected returns pro-forma
-3.0% appreciation · 4.42% rent growth · sell at horizon
- IRR
- -12.9%
- Equity multiple
- 0.53×
- Total profit
- $-33,011
- Equity at exit
- $37,276
- IRR
- -2.2%
- Equity multiple
- 0.85×
- Total profit
- $-10,812
- Equity at exit
- $21,615
Cash invested: $70,000 (down + closing). Projections, not guarantees.
Landlord ↔ Tenant lean methodology
- Overall (STATE)
- 87 Strongly Landlord-Friendly
- State Florida
- 87 Strongly Landlord-Friendly · R+3
- County
- — inherits STATE
- City
- — inherits STATE
ZIP-level market 32526
- Home prices YoY
- -28.3%
- Rents YoY
- 4.4%
- Active inventory
- 421
- Price-to-rent
- 10.4×
Monthly cashflow live
- Estimated rent
- $2,011 high interval (Pro) →
- Mortgage (P&I)
- −$1,311
- Tax from tax record
- −$96 /mo · $1,149/yr
- Insurance
- −$104
- HOA
- −$4
- Vacancy / Maint / Mgmt
- −$422
- Net cashflow
- $74
Break-even live
Sensitivity live
| Price | -10% $215 | -5% $144 | +0% $74 | +5% $3 | +10% $-68 |
|---|---|---|---|---|---|
| Rent | -10% $-85 | -5% $-6 | +0% $74 | +5% $153 | +10% $232 |
| Rate | -1.0pp $199 | -0.5pp $137 | base $74 | +0.5pp $9 | +1.0pp $-57 |
UW: 25.0% down · 7.5% · 30yr · 1.5% tax · 5.0% vac · 8.0% maint · 8.0% mgmt
Financing live
Cash to close
- Down payment
- $62,500
- Closing costs
- $7,500
- Reserves months
- —
- Total cash needed
- —
Loan-product check · same deal, 3 products live
Conventional
25% down · 7.5% · 30yr
- Down + closing
- —
- Monthly P&I
- —
- Monthly cashflow
- —
- DSCR
- —
- Eligible?
- —
Personal DTI + credit; lowest rate.
DSCR
20% down · 8.5% · 30yr
- Down + closing
- —
- Monthly P&I
- —
- Monthly cashflow
- —
- DSCR
- —
- Eligible?
- —
No personal income docs; deal must DSCR.
Hard money
10% down · 12.0% · 12mo
- Down + closing
- —
- Monthly P&I
- —
- Monthly cashflow
- —
- DSCR
- —
- Eligible?
- —
Short-term bridge; refi at stabilization.
Rent comps 15 comps
| Address | Beds | Baths | Sqft | Rent | $/sqft | DOM | Units | Dist |
|---|---|---|---|---|---|---|---|---|
| 2143 Yardley Cir Pensacola, FL | 3.0 | 2.0 | 1725 | $2,300 | $1.33 | 15d | 1 | 0.29mi |
| 5877 Tryton Cir Pensacola, FL | 4.0 | 2.0 | 1419 | $1,825 | $1.29 | 25d | 1 | 0.54mi |
| 2300 W Michigan Ave #12 Pensacola, FL | 2.0 | 2.0 | 1050 | $1,300 | $1.24 | 25d | 1 | 0.64mi |
| 925 Twinbrook Ave Pensacola, FL | 3.0 | 1.0 | 1105 | $1,750 | $1.58 | 25d | 1 | 0.74mi |
| 2301 W Michigan Ave #21 Pensacola, FL | 2.0 | 2.5 | 1164 | $1,325 | $1.14 | 25d | 1 | 0.83mi |
| 2121 Pin High Dr Pensacola, FL | 3.0 | 2.5 | 1918 | $2,065 | $1.08 | 25d | 1 | 0.91mi |
| 6740 Scotts Pl Pensacola, FL | 3.0 | 2.5 | 1663 | $2,350 | $1.41 | 25d | 1 | 1.02mi |
| 6740 Scotts Pl Pensacola, FL | 3.0 | 2.5 | 1663 | $2,350 | $1.41 | 15d | 1 | 1.02mi |
| 902 Lucerne Ave Pensacola, FL | 3.0 | 2.0 | 1276 | $1,600 | $1.25 | 25d | 1 | 1.17mi |
| 6111 Enterprise Dr Pensacola, FL | 1.0–3.0 | 1.0–2.0 | 1224 | $1,688 | $1.38 | 15d | 19 | 1.18mi |
| 6379 Mers Ln Pensacola, FL | 3.0 | 2.5 | 1811 | $1,900 | $1.05 | 23d | 1 | 1.26mi |
| 918 Fremont Ave Pensacola, FL | 3.0 | 1.0 | 1756 | $1,450 | $0.83 | 15d | 1 | 1.34mi |
| 1860 Broyhill Ln Pensacola, FL | 3.0 | 2.0 | 1561 | $1,600 | $1.02 | 25d | 1 | 1.38mi |
| 6225 Mobile Hwy Pensacola, FL | 1.0–3.0 | 1.0–2.0 | 1036 | $2,595 | $2.50 | 15d | 15 | 1.40mi |
| 3177 Two Sisters Way Pensacola, FL | 4.0 | 2.5 | 2244 | $1,975 | $0.88 | 25d | 1 | 1.50mi |
HOA detail
- Monthly dues
- $4 · $48/yr
- Likely covers
- electricpool
Listing history 12 events
-
2026-06-09statusdays on market $250,000 Pending 19 DOM
-
2026-06-08days on market $250,000 Contingent 18 DOM
-
2026-06-07days on market $250,000 Contingent 17 DOM
-
2026-06-03days on market $250,000 Contingent 13 DOM
-
2026-06-02days on market $250,000 Contingent 12 DOM
-
2026-06-01days on market $250,000 Contingent 11 DOM
-
2026-05-31days on market $250,000 Contingent 10 DOM
-
2026-05-31days on market $250,000 Contingent 9 DOM
-
2026-05-21$250,000 Active
-
1982-08-01soldstatus $79,500
-
1980-07-01soldstatus $60,300
-
1978-01-01soldstatus $50,900
ⓘ Source: listings_history table (triggers on properties + properties_extension) + one-shot
backfill from property_details.listing_events for pre-trigger history.
Tax reassessment forecast FL · Resets to sale price
- Current annual tax
- $1,149 · $96/mo
- Projected year-2 tax
- $2,075 · $173/mo
- Expected delta
- +$926/yr (+$77/mo · 80.6%)
ⓘ Screening estimate from a state-policy table — verify with the county assessor before closing.
Climate risk First Street
- Flood 1/10 Low FEMA zone X (unshaded) · 0% chance over 30 yrs
- Wildfire 1/10 Low
- Heat 10/10 Extreme 6 d/yr ≥105°F today · 20 d/yr by 30 yrs out
- Wind 9/10 Extreme 99% chance of damaging wind over 30 yrs
- Air quality 1/10 Low 0 unhealthy d/yr today · 0 by 30 yrs out
Nearby sold comps map
Loading sold comps map…
Walkable amenities ~0.75 mi
Loading nearby amenities…
Taxation est. · year 1
- Rental income
- $24,129
- − Mortgage interest
- −$14,004
- − Property taxes
- −$1,149
- − Insurance
- −$1,250
- − Repairs & maintenance
- −$1,930
- − Management
- −$1,930
- − HOA
- −$48
- − Depreciation
- −$7,273
- Taxable loss
- −$3,455
- Est. tax savings @ 24.0%
- +$829
- After-tax cash flow
- $1,712/yr
For passive investors: Depreciation is non-cash, so a rental often shows a tax loss while cash-flowing — sheltering income. Rental losses are passive: they offset passive income freely, and up to $25,000/yr can offset ordinary (W-2) income if you actively participate and your MAGI is under $100k (phasing out to $0 by $150k); unused losses carry forward. On sale, claimed depreciation is recaptured at up to 25%, and gains may owe capital-gains tax (a 1031 exchange can defer both). Figures are a year-1 estimate at your 24.0% rate — not tax advice; consult a CPA.
Schools (NCES district)
- District
- Escambia
- NCES district ID
- 1200510
- Math proficiency
- 40% ▼ -9.00%
- Reading proficiency
- 45% ▼ -4.00%
- Median HH income
- $44,649
- Composite
- 36.04/100
- National rank
- #4773
- State rank
- #56 of 73 in FL
Livability — Bellview
- Score
- 67/100
- State rank
- #561
- US rank
- #10731
Category grades
Schools grade is shown separately in the Schools card above.
Census & demographics
- Census place
- Bellview, FL
- County
- Escambia County · 301,722 people
- Metro
- Pensacola-Ferry Pass-Brent, FL
- Population (ZIP)
- 44,680
- Household income
- $75,098
- Rent vs Own
- Severe rent burden
- 1166.0
Population outlook (Escambia County) Hauer SSP2
- Today (2025)
- 334,637 people
- By 2030
- 345,779 · +3.3%
- By 2040
- 364,828 · +9.0%
- By 2050
- 378,514 · +13.1%
- By 2075
- 403,220 · +20.5%
- By 2100
- 386,125 · +15.4%
Race, ethnicity, and origin ACS 2023
- Neighborhood character
- Predominantly White (66%)
- Race & ethnicity
- White 66% Black 19% Two or more races 8% Hispanic / Latino 5% Asian 3%
- Common ancestry
- Lithuanian 2% Slovak 2% Serbian 2%
- Foreign-born
- 5% · Canada, China
- Languages at home
- 94% English-only · Spanish 2% Tagalog/Filipino 1% Other Indo-European 1%
Political lean MEDSL · Escambia
- 2024 margin
- R (+19.5) · D 39.7% · R 59.2% · Other 1.1%
- 2008→2024 swing
- -0.2pp no change · 2008: -19.3pp · 2024: -19.5pp
- All cycles
- 2024: R+19.5 2020: R+15.1 2016: R+20.6 2012: R+20.6 2008: R+19.3
Not yet ingested
- Civics
- —
Market trends
- HPI YoY
- ▼ -99.68%
- Current HPI
- 252.6406
- Rent YoY
- ▲ 4.42%
- Metro
- Pensacola-Ferry Pass-Brent, FL
- State GDP YoY
- ▲ 3.28%
- F500 in state
- 36
Industry mix (Fortune 500 HQ in FL)
| Industry | F500 HQs | Revenue |
|---|---|---|
| Industrial Technology | 2 | $29B |
|
||
| Insurance | 2 | $17B |
|
||
| Retail | 1 | $60B |
|
||
| Technology Distribution | 1 | $58B |
|
||
| Homebuilding | 1 | $35B |
|
||
| Technology Manufacturing | 1 | $35B |
|
||
Price history
+391.2% since first listed6 events — show timeline
- 2026-06-09 Pending — PARMLS
- 2026-05-28 Contingent — PARMLS
- 2026-05-21 Listed $250,000 PARMLS
- 1982-08-01 Sold (Public Records) $79,500 Public Records
- 1980-07-01 Sold (Public Records) $60,300 Public Records
- 1978-01-01 Sold (Public Records) $50,900 Public Records
Property tax history
+2.8%/yrLatest (2025): $1,149 · +17.7% YoY. Source: county tax records.
Cash-flow waterfall
monthlySold comps — $/sqft
last 12 mo · ≤1 miLoading sold comps…