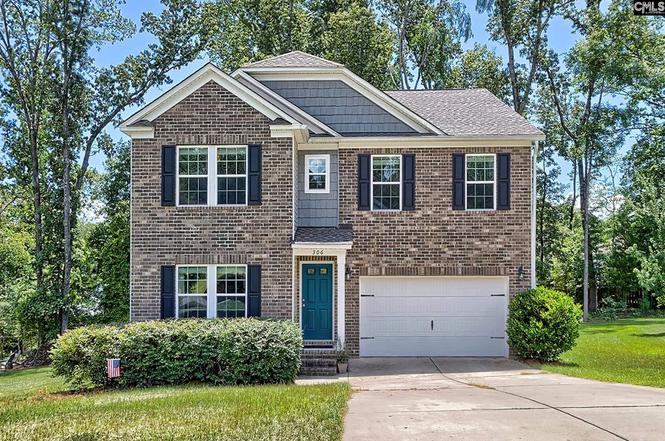
306 Dolly Horn Ln · Lake Murray of Richland, SC
Flood risk 1/10 · Minimal
- FEMA flood zone
- X (unshaded)
- Chance of flooding over 30 yrs
- 0.0%
- Est. flood insurance / yr
- $507 – $1,088
Fire risk 3/10 · Minor
- Est. fire insurance / yr
- $783 – $1,453
Heat risk 6/10 · Moderate
- Hot days now (above 108°F)
- 7 days/yr
- Hot days in 30 yrs
- 16 days/yr
Wind risk 6/10 · Moderate
- Chance of severe wind over 30 yrs
- 52.0%
Air-quality risk 3/10 · Minor
- Unhealthy air days now
- 2 days/yr
- Unhealthy air days in 30 yrs
- 3 days/yr
Risk factors via First Street. Map © Google.
Why this score? — see what drove the D- grade
The composite is a weighted blend of 9 inputs, each scored 0–100. Each bar is that input's sub-score; the figure is the points it added to the 100-point composite (weight × sub-score).
- Cash flow +9.2/30.0
- ARV discount +7.5/15.0
- Appreciation +5.0/10.0
- Schools +4.5/10.0
- Livability +3.4/5.0
- DSCR +2.6/10.0
- Rent growth +2.5/5.0
- Condition / age +2.5/5.0
- 1% rule +2.2/10.0
$357,000
🖨 Deal sheet (PDF) 📄 Offer letter ✓ Due diligence
Listing remarks
Welcome to this beautifully maintained home in the highly desirable Hidden Cove—complete with shared access to Lake Murray and a day dock for convenient pick-up and drop-off! Nestled in a peaceful neighborhood known for its excellent schools, this home blends comfort, style, and practicality. Step through the inviting front porch into a light-filled foyer that flows seamlessly into the formal living and dining rooms. The heart of the home is the spacious open-concept kitchen and great room featuring a gas fireplace, stainless steel appliances, gas range, granite countertops, a large island with seating, walk-in pantry, built-in sound system, and a charming breakfast nook. Upstairs, yo
Key facts
- Excellent schools
- Open-concept kitchen
- Gas fireplace
Tags
Property features AI
Finance
- HOA & community: Property is part of an association
Exterior
- Parking: Attached garage with 2 garage spaces (total 2 parking spaces)
- Utilities: Public water; Public sewer
- Home design: Two-story single-family home
- Construction: Slab foundation
- Exterior features: Deck; Sprinkler system; Shared dock; Stone and vinyl exterior finish; Paved road access
Interior
- Kitchen: Kitchen on main level with island, pantry, granite countertops, recessed lights, and luxury vinyl plank flooring
- Bedrooms: Master suite on second floor with cathedral ceilings, double vanity, his-and-hers closet, private bath with separate shower, walk-in closet, and carpeted floors; Three additional bedrooms on second floor with ceiling fans, private closets, shared baths, and carpeted floors
- Flooring: Luxury vinyl plank on main living areas (living room, formal living, formal dining, kitchen); Carpet in bedrooms
- Bathrooms: Two full baths; One half bath; Additional two full secondary baths (as listed)
- Heating & cooling: Central cooling; Central heating with gas on first and second levels
- Interior features: Gas log (natural) fireplace; Ceiling fans in living areas and bedrooms; Recessed lighting; Pantry; Island; Granite countertops
- Laundry & utility: Laundry on second floor in a heated utility room
Neighborhood map
What this means for you Summary
Snapshot
- This is a 4-bed/3.0-bath single-family listed at $357k.
Deal economics
- At list price, monthly cash flow is $-267 ($-3k/yr) — negative.
- To cash-flow at today's rent, offer at most $310k (13.2% below list).
- To meet the 1% rule (rent ≥ 1% of price), the offer needs to be $258k (27.6% below list).
- Recommended offer: $258k (27.6% below list) — sets the bar for 1% rule.
Location & tenants
- Location reads 67/100 on livability (#102 in SC) — a middle-class / working-renter tenant base. Strengths: crime A+, employment A+, housing A+; Watch: amenities F, commute F, cost of living F.
- Lexington 05 (suburban): math 47% / reading 55% proficiency, ranked #5 of 80 in SC (top 6%) — acceptable for families but not a draw, mixed tenant base, ~2y average lease.
- Zoned schools: Lake Murray Elementary (math 78% / reading 82%, grade A+, #4 of 597 statewide, top 1%, 809 students, 18% FRL); Chapin High (math 82% / reading 91%, grade A, #7 of 196 statewide, top 4%, 1,615 students, 100% FRL) — zoned schools average 59% FRL vs 27% district-wide (32 pts higher); higher-poverty schools than district average — tighter screening recommended.
- Zoned-school proficiency averages 83% at this address vs 51% district-wide (+32 pts) — the actual schools serving this property are materially stronger than the Lexington 05 average implies; a family-tenant draw the district grade alone would hide.
- Market conditions: 1 active listings in the ZIP; 3 comparable units currently listed for rent nearby; rentals leasing fast (median 13d on market — plan ~1-2 weeks tenant-placement turnaround); 3,472 units permitted in Richland County in 2024 (1,096 in 5+ unit buildings).
Forward outlook
- In year one you build about $13k of equity ($2k loan paydown + $11k appreciation (3.0% local appreciation)).
- Richland County population projected at +30% by 2050 — long-run rental-demand tailwind backs the buy-and-hold thesis.
- By year 3, paydown + projected appreciation supports a ~$33k cash-out refi (75% LTV) — recoverable capital for the next deal without selling this one.
Negotiation context
- It's been on market 280 days — a 12% lower offer ($314k) is reasonable based on typical stale-listing flexibility.
- 4 sale attempts since 4y ago; this cycle's ask has dropped $38k (10%) from the opening price — seller is motivated, your offer sets the floor, not the list.
Risks & watch-outs
- Climate carrying-cost: major wind risk, 52% chance of damaging wind over 30y; extreme-heat days projected 7→16/yr by 2055 (HVAC capex compounding) — expect insurance premiums to compound above CPI over the hold.
Questions for the listing agent
- What do current leases actually rent for vs. the listed asking? Can we see a recent rent roll and the last 12 months of T-12 income?
- It's been on market 280 days. Have you received any prior offers? Is the seller open to a 28% concession, seller financing, or rate buy-down credit?
- What does the HOA fee cover, when was the last increase, and are there any pending special assessments or reserve-fund shortfalls?
- Why hasn't it sold? Are there any deal-killer items the seller is aware of (foundation, flood, title, zoning, code violations)?
- Is there a deadline driving the sale (1031 exchange, divorce, estate, relocation)? That informs how much negotiation room exists.
- Schools are D-rated, which usually means shorter tenancies and higher turnover. Who's the typical renter profile here, and what's been the actual vacancy rate?
- The area grade is low — what's the realistic commute time and amenity access for the typical tenant pool here? Any planned neighborhood developments (good or bad) we should know about?
- What's the average days-on-market for RENTAL listings here right now (not sales)? A rising rental-DOM trend means longer vacancies and softer asking-rent achievability than the comps imply.
- What's the recent tenant-quality profile in this submarket — average credit score on applications, eviction rate, late-payment / NSF rate, and stable-employment percentage? A property-management company in the area should have these aggregated.
- How much new for-sale + rental construction is in the pipeline within 1–3 miles? Heavy new supply typically softens prices + rents 12–24 months out; constrained supply supports both.
Investment metrics
- 1% rule
- 0.72% ✗
- Cap rate
- 5.39%
- Cash-on-cash
- -3.21%
- DSCR
- 0.86
- GRM
- 11.5
CMA / ARV
No comps found within radius.
Projected returns pro-forma
3.0% appreciation · 3.0% rent growth · sell at horizon
- IRR
- 4.5%
- Equity multiple
- 1.26×
- Total profit
- $25,922
- Equity at exit
- $160,523
- IRR
- 7.7%
- Equity multiple
- 2.16×
- Total profit
- $116,115
- Equity at exit
- $247,385
Cash invested: $99,960 (down + closing). Projections, not guarantees.
Landlord ↔ Tenant lean methodology
- Overall (STATE)
- 90 Strongly Landlord-Friendly
- State South Carolina
- 90 Strongly Landlord-Friendly · R+6
- County
- — inherits STATE
- City
- — inherits STATE
ZIP-level market 29036-6006
- Active inventory
- 1
- Price-to-rent
- 11.5×
Monthly cashflow live
- Estimated rent
- $2,583 medium interval (Pro) →
- Mortgage (P&I)
- −$1,872
- Tax from tax record
- −$254 /mo · $3,052/yr
- Insurance
- −$149
- HOA
- −$33
- Vacancy / Maint / Mgmt
- −$543
- Net cashflow
- $-267
Break-even live
Sensitivity live
| Price | -10% $-65 | -5% $-166 | +0% $-267 | +5% $-368 | +10% $-469 |
|---|---|---|---|---|---|
| Rent | -10% $-471 | -5% $-369 | +0% $-267 | +5% $-165 | +10% $-63 |
| Rate | -1.0pp $-88 | -0.5pp $-177 | base $-267 | +0.5pp $-360 | +1.0pp $-454 |
UW: 25.0% down · 7.5% · 30yr · 1.5% tax · 5.0% vac · 8.0% maint · 8.0% mgmt
Financing live
Cash to close
- Down payment
- $89,250
- Closing costs
- $10,710
- Reserves months
- —
- Total cash needed
- —
Loan-product check · same deal, 3 products live
Conventional
25% down · 7.5% · 30yr
- Down + closing
- —
- Monthly P&I
- —
- Monthly cashflow
- —
- DSCR
- —
- Eligible?
- —
Personal DTI + credit; lowest rate.
DSCR
20% down · 8.5% · 30yr
- Down + closing
- —
- Monthly P&I
- —
- Monthly cashflow
- —
- DSCR
- —
- Eligible?
- —
No personal income docs; deal must DSCR.
Hard money
10% down · 12.0% · 12mo
- Down + closing
- —
- Monthly P&I
- —
- Monthly cashflow
- —
- DSCR
- —
- Eligible?
- —
Short-term bridge; refi at stabilization.
Rent comps 3 comps
| Address | Beds | Baths | Sqft | Rent | $/sqft | DOM | Units | Dist |
|---|---|---|---|---|---|---|---|---|
| 628 Willowood Pkwy Chapin, SC | 4.0 | 2.0 | 2000 | $2,760 | $1.38 | 4d | 1 | 0.72mi |
| 40 Rustyred Ct Chapin, SC | 4.0 | 2.5 | 2400 | $2,450 | $1.02 | 12d | 1 | 1.16mi |
| 756 Helmsman Ln Chapin, SC | 4.0 | 2.5 | 1948 | $2,450 | $1.26 | 15d | 1 | 1.20mi |
HOA detail
- Monthly dues
- $33 · $396/yr
- Likely covers
- gas
Listing history 10 events
-
2026-05-04status Active
-
2026-02-05status Active
-
2026-02-01historical
-
2025-11-20price $357,000
-
2025-09-25price $370,000
-
2025-08-14price $385,000
-
2025-07-28$395,000 Active
-
2022-08-01soldstatus $390,000
-
2022-06-24historical
-
2022-06-04$390,000 Active
ⓘ Source: listings_history table (triggers on properties + properties_extension) + one-shot
backfill from property_details.listing_events for pre-trigger history.
Tax reassessment forecast SC · Resets to sale price
- Current annual tax
- $3,052 · $254/mo
- Projected year-2 tax
- $3,052 · $254/mo
- Expected delta
- $0/yr ($0/mo · 0.0%)
ⓘ Screening estimate from a state-policy table — verify with the county assessor before closing.
Climate risk First Street
- Flood 1/10 Low FEMA zone X (unshaded) · 0% chance over 30 yrs
- Wildfire 3/10 Moderate
- Heat 6/10 Major 7 d/yr ≥108°F today · 16 d/yr by 30 yrs out
- Wind 6/10 Major 52% chance of damaging wind over 30 yrs
- Air quality 3/10 Moderate 2 unhealthy d/yr today · 3 by 30 yrs out
Nearby sold comps map
Loading sold comps map…
Walkable amenities ~0.75 mi
Loading nearby amenities…
Taxation est. · year 1
- Rental income
- $31,001
- − Mortgage interest
- −$19,998
- − Property taxes
- −$3,052
- − Insurance
- −$1,785
- − Repairs & maintenance
- −$2,480
- − Management
- −$2,480
- − HOA
- −$396
- − Depreciation
- −$10,385
- Taxable loss
- −$9,575
- Est. tax savings @ 24.0%
- +$2,298
- After-tax cash flow
- $-910/yr
For passive investors: Depreciation is non-cash, so a rental often shows a tax loss while cash-flowing — sheltering income. Rental losses are passive: they offset passive income freely, and up to $25,000/yr can offset ordinary (W-2) income if you actively participate and your MAGI is under $100k (phasing out to $0 by $150k); unused losses carry forward. On sale, claimed depreciation is recaptured at up to 25%, and gains may owe capital-gains tax (a 1031 exchange can defer both). Figures are a year-1 estimate at your 24.0% rate — not tax advice; consult a CPA.
Schools (NCES district)
- District
- Lexington 05
- NCES district ID
- 4502820
- Math proficiency
- 47% ▼ -7.00%
- Reading proficiency
- 55% ▼ -4.00%
- Median HH income
- $67,732
- Composite
- 45.28/100
- National rank
- #2656
- State rank
- #5 of 80 in SC
Livability — Lake Murray of Richland
- Score
- 67/100
- State rank
- #102
- US rank
- #10903
Category grades
Schools grade is shown separately in the Schools card above.
Census & demographics
- Census place
- Lake Murray of Richland, SC
Population outlook (Richland County) Hauer SSP2
- Today (2025)
- 459,667 people
- By 2030
- 487,524 · +6.1%
- By 2040
- 542,035 · +17.9%
- By 2050
- 595,371 · +29.5%
- By 2075
- 732,998 · +59.5%
- By 2100
- 820,415 · +78.5%
Not yet ingested
- Political lean
- —
- Race & ethnicity
- —
- Common origin
- —
- Civics
- —
Market trends
- HPI YoY
- —
- Current HPI
- —
- Rent YoY
- —
- Metro
- —
- State GDP YoY
- ▲ 4.51%
- F500 in state
- 2
Industry mix (Fortune 500 HQ in SC)
| Industry | F500 HQs | Revenue |
|---|---|---|
| Packaging | 1 | $7B |
|
||
Price history
-8.5% since first listed10 events — show timeline
- 2026-05-04 Relisted — Consolidated MLS
- 2026-02-05 Relisted — Consolidated MLS
- 2026-02-01 Delisted — Consolidated MLS
- 2025-11-20 Price Changed $357,000 Consolidated MLS
- 2025-09-25 Price Changed $370,000 Consolidated MLS
- 2025-08-14 Price Changed $385,000 Consolidated MLS
- 2025-07-28 Listed $395,000 Consolidated MLS
- 2022-08-01 Sold (Public Records) $390,000 Public Records
- 2022-06-24 Delisted — Consolidated MLS
- 2022-06-04 Listed $390,000 Consolidated MLS
Property tax history
+16.6%/yrLatest (2025): $3,052 · +4.1% YoY. Source: county tax records.
Cash-flow waterfall
monthlySold comps — $/sqft
last 12 mo · ≤1 miLoading sold comps…