5447 WILLOW Dr · Croswell, MI
Flood risk No data
- FEMA flood zone
- —
- Chance of flooding over 30 yrs
- —
- Est. flood insurance / yr
- —
Fire risk No data
- Est. fire insurance / yr
- —
Heat risk No data
- Hot days now (above threshold)
- —
- Hot days in 30 yrs
- —
Wind risk No data
- Chance of severe wind over 30 yrs
- —
Air-quality risk No data
- Unhealthy air days now
- —
- Unhealthy air days in 30 yrs
- —
Risk factors via First Street. Map © Google.
Why this score? — see what drove the D+ grade
The composite is a weighted blend of 9 inputs, each scored 0–100. Each bar is that input's sub-score; the figure is the points it added to the 100-point composite (weight × sub-score).
- Cash flow +15.2/30.0
- 1% rule +10.0/10.0
- ARV discount +7.5/15.0
- DSCR +4.7/10.0
- Schools +3.2/10.0
- Livability +3.1/5.0
- Rent growth +2.5/5.0
- Condition / age +2.5/5.0
- Appreciation +0.0/10.0
$40,000
🖨 Deal sheet (PDF) 📄 Offer letter ✓ Due diligence
Listing remarks
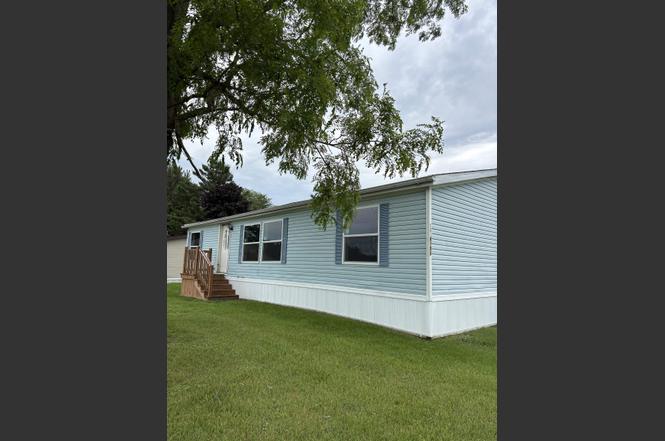
FINANCING AVAILABLE. Freshly Remodeled 3 bed 2 full bath Double wide manufactured home. New flooring, fresh paint, new kitchen, remodeled bathrooms. Primary bedroom has its own bathroom and walk in closet. Truly a spacious home that doesn't break the bank. Just turn key ready waiting for its owner. Located Close to Downtown Lexington and Lake Huron.
Key facts
- New kitchen
- New flooring
- Walk in closet
Tags
Property features AI
Finance
- Other: Property type: Residential; Frontage faces a road; Mailing city: Croswell (Buel Township area)
- HOA & community: Part of Country Hill Pines association; Monthly association fee of $460; Association contact available
Exterior
- Parking: Paved driveway
- Utilities: Natural gas heat fuel; Community well water; Shared septic system
- Home design: Manufactured double-wide home (manufactured after 1976); Residential, single-story (1 story); Built in 1990
- Construction: Crawlspace and piers foundation
- Exterior features: Vinyl siding with vinyl trim; Paved street frontage; Paved driveway; Pets allowed (call for restrictions)
Interior
- Bedrooms: Three bedrooms on the entry level (approx. 13 x 14, 12 x 13, and 13 wide)
- Bathrooms: Two full bathrooms on the first floor
- Heating & cooling: Forced air heating; Central A/C
- Interior features: Entry-level bedrooms; Living room
Neighborhood map
What this means for you Summary
Snapshot
- This is a 3-bed/2.0-bath single-family listed at $40k.
Deal economics
- At list price, monthly cash flow is $14 ($169/yr) — positive.
- The deal already cash-flows at list — no discount required.
- Meets the 1% rule at list price ($950 rent vs $40k).
- Recommended offer: $35k (12.0% below list) — sets the bar for market timing.
Location & tenants
- Location reads 62/100 on livability (#549 in MI) — a middle-class / working-renter tenant base. Strengths: cost of living A+, housing A+; Watch: schools C-, crime D, employment D.
- Croswell-Lexington Community Schools (rural): math 30% / reading 47% proficiency, ranked #239 of 540 in MI (top 44%) — families likely to look elsewhere, expect single-tenant / working-renter base with shorter leases.
- Market conditions: 51 active listings in the ZIP; 1 comparable units currently listed for rent nearby; 63 units permitted in Sanilac County in 2024 (0 in 5+ unit buildings).
Forward outlook
- Local home prices are declining (-3.0%/yr); year-one equity from $277 of loan paydown is wiped out by about $1k of value loss. Plan a longer hold.
- Sanilac County population projected at -31% by 2050 — secular population decline; favor cash flow + early exit over multi-decade hold.
Negotiation context
- It's been on market 355 days — a 12% lower offer ($35k) is reasonable based on typical stale-listing flexibility.
- 2 sale attempts; this cycle's ask has dropped $10k (20%) from the opening price — seller is motivated, your offer sets the floor, not the list.
Risks & watch-outs
- Watch-outs: HOA is 48% of rent.
Questions for the listing agent
- It's been on market 355 days. Have you received any prior offers? Is the seller open to a 12% concession, seller financing, or rate buy-down credit?
- What does the HOA fee cover, when was the last increase, and are there any pending special assessments or reserve-fund shortfalls?
- Why hasn't it sold? Are there any deal-killer items the seller is aware of (foundation, flood, title, zoning, code violations)?
- Is there a deadline driving the sale (1031 exchange, divorce, estate, relocation)? That informs how much negotiation room exists.
- Crime grade is D in this area — have there been break-ins, vandalism, or insurance claims at this property in the last 3 years? What carrier currently insures it and at what premium?
- The area grade is low — what's the realistic commute time and amenity access for the typical tenant pool here? Any planned neighborhood developments (good or bad) we should know about?
- What's the average days-on-market for RENTAL listings here right now (not sales)? A rising rental-DOM trend means longer vacancies and softer asking-rent achievability than the comps imply.
- What's the recent tenant-quality profile in this submarket — average credit score on applications, eviction rate, late-payment / NSF rate, and stable-employment percentage? A property-management company in the area should have these aggregated.
- How much new for-sale + rental construction is in the pipeline within 1–3 miles? Heavy new supply typically softens prices + rents 12–24 months out; constrained supply supports both.
Investment metrics
- 1% rule
- 2.38% ✓
- Cap rate
- 6.72%
- Cash-on-cash
- 1.51%
- DSCR
- 1.07
- GRM
- 3.5
CMA / ARV
- ARV (on-the-fly)
- $190,400
- Comps found
- 9
Show comp detail 9 sales within ~0.75 mi
| Address | Dist | Beds/Ba | Sqft | Sold | Price | $/sf | Match |
|---|---|---|---|---|---|---|---|
| 42 S Flower St | 0.17mi | 3/2.0 | 1,512 (+8%) | 7mo | $250,000 | $165 | 73 |
| 33 S Flower St | 0.20mi | 3/2.0 | 1,391 (-1%) | 22mo | $190,000 | $137 | 71 |
| 22 Church St | 0.27mi | 4/2.0 (+1) | 1,529 (+9%) | 8mo | $208,292 | $136 | 60 |
| 9 Pack St | 0.31mi | 3/2.0 | 1,244 (-11%) | 12mo | $195,000 | $157 | 57 |
| 86 Gaige St | 0.72mi | 3/1.0 | 1,428 (+2%) | 8mo | $48,000 | $34 | 52 |
| 140 N Howard Ave | 0.71mi | 3/2.0 | 1,450 (+4%) | 13mo | $195,000 | $134 | 50 |
| 65 W Sanborn Ave | 0.26mi | 3/1.0 | 1,220 (-13%) | 20mo | $93,900 | $77 | 45 |
| 29 Pack St | 0.37mi | 3/1.5 | 1,600 (+14%) | 16mo | $169,900 | $106 | 43 |
| 39 N Flower St | 0.41mi | 3/1.0 | 1,200 (-14%) | 13mo | $205,000 | $171 | 42 |
Match score weights: distance 35% · size 25% · config 20% · recency 20%. Top-matched comps best support the ARV.
Projected returns pro-forma
-3.0% appreciation · 3.0% rent growth · sell at horizon
- IRR
- -13.0%
- Equity multiple
- 0.53×
- Total profit
- $-5,289
- Equity at exit
- $5,964
- IRR
- -2.9%
- Equity multiple
- 0.80×
- Total profit
- $-2,245
- Equity at exit
- $3,458
Cash invested: $11,200 (down + closing). Projections, not guarantees.
Landlord ↔ Tenant lean methodology
- Overall (STATE)
- 62 Landlord-Friendly
- State Michigan
- 62 Landlord-Friendly · EVEN
- County
- — inherits STATE
- City
- — inherits STATE
ZIP-level market 48422
- Home prices YoY
- -10.2%
- Active inventory
- 51
- Price-to-rent
- 3.5×
Monthly cashflow live
- Estimated rent
- $950 medium interval (Pro) →
- Mortgage (P&I)
- −$210
- Tax est. 1.5%
- −$50 /mo · $600/yr
- Insurance
- −$17
- HOA
- −$460
- Vacancy / Maint / Mgmt
- −$200
- Net cashflow
- $14
Break-even live
Sensitivity live
| Price | -10% $42 | -5% $28 | +0% $14 | +5% $0 | +10% $-14 |
|---|---|---|---|---|---|
| Rent | -10% $-61 | -5% $-23 | +0% $14 | +5% $52 | +10% $89 |
| Rate | -1.0pp $34 | -0.5pp $24 | base $14 | +0.5pp $4 | +1.0pp $-7 |
UW: 25.0% down · 7.5% · 30yr · 1.5% tax · 5.0% vac · 8.0% maint · 8.0% mgmt
Financing live
Cash to close
- Down payment
- $10,000
- Closing costs
- $1,200
- Reserves months
- —
- Total cash needed
- —
Loan-product check · same deal, 3 products live
Conventional
25% down · 7.5% · 30yr
- Down + closing
- —
- Monthly P&I
- —
- Monthly cashflow
- —
- DSCR
- —
- Eligible?
- —
Personal DTI + credit; lowest rate.
DSCR
20% down · 8.5% · 30yr
- Down + closing
- —
- Monthly P&I
- —
- Monthly cashflow
- —
- DSCR
- —
- Eligible?
- —
No personal income docs; deal must DSCR.
Hard money
10% down · 12.0% · 12mo
- Down + closing
- —
- Monthly P&I
- —
- Monthly cashflow
- —
- DSCR
- —
- Eligible?
- —
Short-term bridge; refi at stabilization.
Rent comps 1 comps
| Address | Beds | Baths | Sqft | Rent | $/sqft | DOM | Units | Dist |
|---|---|---|---|---|---|---|---|---|
| 12 N Black River Rd Unit 12 Croswell, MI | 3.0 | 1.5 | 932 | $950 | $1.02 | 6d | 1 | 0.32mi |
HOA detail
- Monthly dues
- $460 · $5,520/yr
Listing history 17 events
-
2026-06-15status $40,000 Pending 355 DOM
-
2026-06-15days on market $40,000 Active 355 DOM
-
2026-06-13days on market $40,000 Active 353 DOM
-
2026-06-13days on market $40,000 Active 352 DOM
-
2026-06-09days on market $40,000 Active 349 DOM
-
2026-06-08days on market $40,000 Active 348 DOM
-
2026-06-07days on market $40,000 Active 347 DOM
-
2026-06-04days on market $40,000 Active 344 DOM
-
2026-06-03days on market $40,000 Active 343 DOM
-
2026-06-02days on market $40,000 Active 342 DOM
-
2026-06-01days on market $40,000 Active 341 DOM
-
2026-05-31days on market $40,000 Active 340 DOM
-
2026-04-09price $40,000
-
2025-12-31status Active
-
2025-12-31historical
-
2025-11-04price $45,000
-
2025-06-25$50,000 Active
ⓘ Source: listings_history table (triggers on properties + properties_extension) + one-shot
backfill from property_details.listing_events for pre-trigger history.
Nearby sold comps map
Loading sold comps map…
Walkable amenities ~0.75 mi
Loading nearby amenities…
Taxation est. · year 1
- Rental income
- $11,400
- − Mortgage interest
- −$2,241
- − Property taxes
- −$600
- − Insurance
- −$200
- − Repairs & maintenance
- −$912
- − Management
- −$912
- − HOA
- −$5,520
- − Depreciation
- −$1,164
- Taxable loss
- −$148
- Est. tax savings @ 24.0%
- +$36
- After-tax cash flow
- $204/yr
For passive investors: Depreciation is non-cash, so a rental often shows a tax loss while cash-flowing — sheltering income. Rental losses are passive: they offset passive income freely, and up to $25,000/yr can offset ordinary (W-2) income if you actively participate and your MAGI is under $100k (phasing out to $0 by $150k); unused losses carry forward. On sale, claimed depreciation is recaptured at up to 25%, and gains may owe capital-gains tax (a 1031 exchange can defer both). Figures are a year-1 estimate at your 24.0% rate — not tax advice; consult a CPA.
Schools (NCES district)
- District
- Croswell-Lexington Community Schools
- NCES district ID
- 2611140
- Math proficiency
- 30% ▼ -7.00%
- Reading proficiency
- 47% ▼ -6.00%
- Median HH income
- $42,784
- Composite
- 32.49/100
- National rank
- #5707
- State rank
- #239 of 540 in MI
Livability — Croswell
- Score
- 62/100
- State rank
- #549
- US rank
- #17207
Category grades
Schools grade is shown separately in the Schools card above.
Census & demographics
- Census place
- Croswell, MI
- Population (ZIP)
- 6,172
Population outlook (Sanilac County) Hauer SSP2
- Today (2025)
- 37,948 people
- By 2030
- 35,772 · -5.7%
- By 2040
- 30,996 · -18.3%
- By 2050
- 26,280 · -30.7%
- By 2075
- 17,471 · -54.0%
- By 2100
- 10,572 · -72.1%
Race, ethnicity, and origin ACS 2023
- Neighborhood character
- Predominantly White (89%)
- Race & ethnicity
- White 89% Hispanic / Latino 7% Two or more races 4% Black 1%
- Hispanic origin (detail)
- Mexican 7%
- Common ancestry
- Romanian 9% Slovak 5% Lithuanian 3%
- Foreign-born
- 1% · Canada
- Languages at home
- 95% English-only · Spanish 5%
Political lean MEDSL · Sanilac
- 2024 margin
- Solid R (+47.7) · D 25.5% · R 73.2% · Other 1.3%
- 2008→2024 swing
- -39.6pp toward R · 2008: -8.1pp · 2024: -47.7pp
- All cycles
- 2024: R+47.7 2020: R+45.6 2016: R+44.5 2012: R+20.4 2008: R+8.1
Not yet ingested
- Civics
- —
Market trends
- HPI YoY
- ▼ -30.65%
- Current HPI
- 268.6695
- Rent YoY
- —
- Metro
- —
- State GDP YoY
- ▲ 1.37%
- F500 in state
- 28
Industry mix (Fortune 500 HQ in MI)
| Industry | F500 HQs | Revenue |
|---|---|---|
| Automotive Parts | 3 | $48B |
|
||
| Automotive | 2 | $372B |
|
||
| Chemicals | 1 | $45B |
|
||
| Automotive Retail | 1 | $29B |
|
||
| Healthcare / Medical Devices | 1 | $23B |
|
||
| Automotive Technology | 1 | $20B |
|
||
Price history
-20.0% since first listed5 events — show timeline
- 2026-04-09 Price Changed $40,000 MiRealSource-MiMLS
- 2025-12-31 Relisted — MiRealSource-MiMLS
- 2025-12-31 Listing Removed — MiRealSource-MiMLS
- 2025-11-04 Price Changed $45,000 MiRealSource-MiMLS
- 2025-06-25 Listed $50,000 MiRealSource-MiMLS
Cash-flow waterfall
monthlySold comps — $/sqft
last 12 mo · ≤1 miLoading sold comps…