1266 Private Road 1060 · West Plains, MO
Flood risk 1/10 · Minimal
- FEMA flood zone
- X (unshaded)
- Chance of flooding over 30 yrs
- 0.0%
- Est. flood insurance / yr
- $473 – $860
Fire risk 6/10 · Moderate
- Est. fire insurance / yr
- $1,054 – $1,958
Heat risk 5/10 · Moderate
- Hot days now (above 106°F)
- 7 days/yr
- Hot days in 30 yrs
- 20 days/yr
Wind risk 2/10 · Minimal
- Chance of severe wind over 30 yrs
- 4.0%
Air-quality risk 1/10 · Minimal
- Unhealthy air days now
- 0 days/yr
- Unhealthy air days in 30 yrs
- 0 days/yr
Risk factors via First Street. Map © Google.
Why this score? — see what drove the B- grade
The composite is a weighted blend of 9 inputs, each scored 0–100. Each bar is that input's sub-score; the figure is the points it added to the 100-point composite (weight × sub-score).
- Cash flow +30.0/30.0
- DSCR +10.0/10.0
- 1% rule +8.0/10.0
- ARV discount +7.5/15.0
- Livability +3.9/5.0
- Schools +3.4/10.0
- Rent growth +2.5/5.0
- Condition / age +2.5/5.0
- Appreciation +0.0/10.0
$84,000
🖨 Deal sheet 📄 Offer letter ✓ Due diligence
Listing remarks
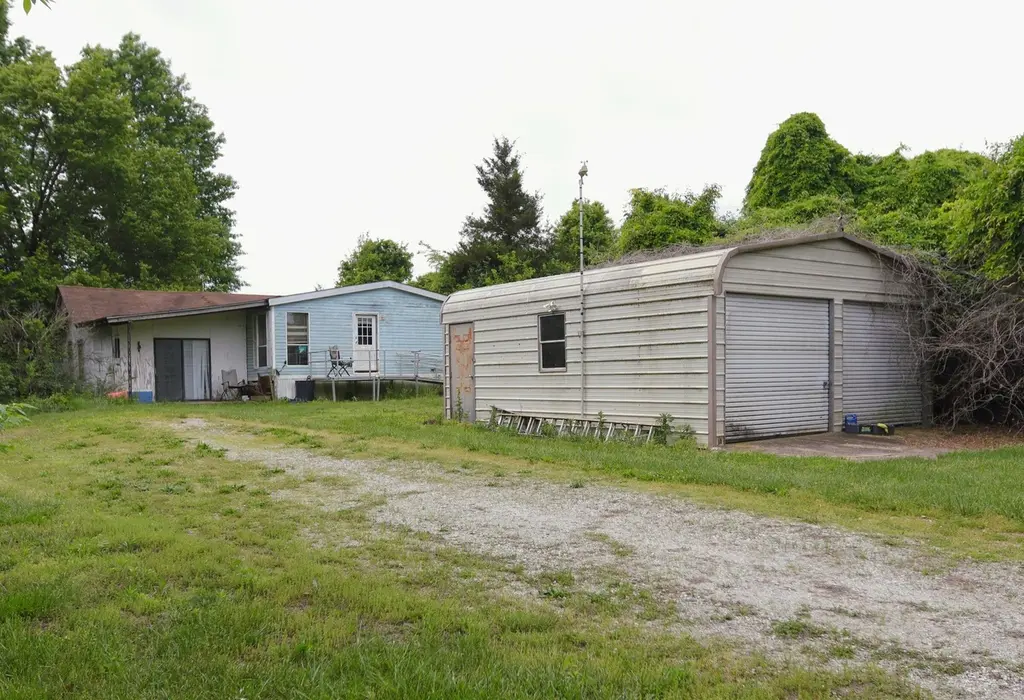
This 4.76-acre property offers endless potential and is priced to sell! Located just minutes from West Plains, this property features a 3-bedroom, 2-bath double wide that would be perfect for someone looking to remodel and make it their own. The beautiful park-like setting provides plenty of room to enjoy the outdoors while still being conveniently close to town. The property also includes an excellent detached 2-car garage that could easily serve as a workshop or hoppy shop. Whether you're looking for an investment opportunity, a fixer-upper, or a peaceful place to call home, this property has all the potential.
Key facts
- Park-like setting
- 4.76 acre lot
- 2 garage spots
Tags
Property features AI
Exterior
- Parking: 2-car garage; Driveway; Garage faces front
- Utilities: Propane; Other water source
- Home design: Residential mobile home (double wide); One level
- Construction: Vinyl siding; Asphalt roof
- Exterior features: Side porch; Shed(s); Level lot; Gravel road frontage on a county road
Interior
- Kitchen: Gas oven; Refrigerator
- Flooring: Carpet; Vinyl
- Bathrooms: 2 full bathrooms
- Heating & cooling: Central heating; Propane heating; Window cooling units
- Interior features: Walk-in closet(s)
- Laundry & utility: Washer and dryer on the main level; Electric water heater
Neighborhood map
What this means for you Summary
Snapshot
- This is a 3-bed/2.0-bath other listed at $84k.
Deal economics
- At list price, monthly cash flow is $365 ($4k/yr) — positive.
- The deal already cash-flows at list — no discount required.
- Meets the 1% rule at list price ($1k rent vs $84k).
- Recommended offer: $81k (3.0% below list) — sets the bar for market timing.
- Cap rate 11.5% vs local median 3.1% in West Plains — top-decile yield for the area; either an underpriced asset or a hidden risk that comps aren't pricing in. Stress-test before assuming the spread holds.
Location & tenants
- Location reads 77/100 on livability (#34 in MO, #2,977 nationally) — a middle-class / working-renter tenant base. Strengths: cost of living A+, health & safety A+, housing A-; Watch: crime C-, commute C-, amenities D.
- West Plains R-VII (rural): math 36% / reading 46% proficiency, ranked #152 of 324 in MO (top 47%) — families likely to look elsewhere, expect single-tenant / working-renter base with shorter leases.
- Zoned schools: West Plains Elem. (math 41% / reading 40%, grade F, #525 of 1,115 statewide, top 47%, 766 students, 66% FRL); West Plains Middle (math 33% / reading 39%, grade F, #237 of 391 statewide, top 61%, 611 students, 58% FRL); West Plains Sr. High (math 27% / reading 65%, grade D-, #170 of 521 statewide, top 33%, 1,162 students, 42% FRL) — zoned schools at 55% FRL track the district average.
- Market conditions: 315 active listings in the ZIP; 53 units permitted in Howell County in 2024 (0 in 5+ unit buildings).
Forward outlook
- Local home prices are declining (-3.0%/yr); year-one equity from $581 of loan paydown is wiped out by about $3k of value loss. Plan a longer hold.
- Howell County population projected at -18% by 2050 — secular population decline; favor cash flow + early exit over multi-decade hold.
- At projected returns (-3.0% appreciation + 3.0% rent growth), your $24k cash investment doubles in ~7 years — after that, you're playing with house money.
Negotiation context
- It's been on market 37 days — a 3% lower offer ($81k) is reasonable based on typical stale-listing flexibility.
Risks & watch-outs
- Climate carrying-cost: major wildfire risk; extreme-heat days projected 7→20/yr by 2055 (HVAC capex compounding) — expect insurance premiums to compound above CPI over the hold.
Questions for the listing agent
- It's been on market 37 days. Have you received any prior offers? Is the seller open to a 3% concession, seller financing, or rate buy-down credit?
- Is there a deadline driving the sale (1031 exchange, divorce, estate, relocation)? That informs how much negotiation room exists.
- Schools are D-rated, which usually means shorter tenancies and higher turnover. Who's the typical renter profile here, and what's been the actual vacancy rate?
- What's the average days-on-market for RENTAL listings here right now (not sales)? A rising rental-DOM trend means longer vacancies and softer asking-rent achievability than the comps imply.
- What's the recent tenant-quality profile in this submarket — average credit score on applications, eviction rate, late-payment / NSF rate, and stable-employment percentage? A property-management company in the area should have these aggregated.
- How much new for-sale + rental construction is in the pipeline within 1–3 miles? Heavy new supply typically softens prices + rents 12–24 months out; constrained supply supports both.
Investment metrics
- 1% rule
- 1.30% ✓
- Cap rate
- 11.51%
- Cash-on-cash
- 18.62%
- DSCR
- 1.83
- GRM
- 6.4
CMA / ARV
- ARV (median comp)
- $200,000
- List price
- $84,000
- Delta
- -58.00%
- Verdict
- UNDERPRICED
- Comps
- 1 within 2.0 mi
Projected returns pro-forma
-3.0% appreciation · 3.0% rent growth · sell at horizon
- IRR
- 10.3%
- Equity multiple
- 1.41×
- Total profit
- $9,598
- Equity at exit
- $12,525
- IRR
- 19.4%
- Equity multiple
- 2.62×
- Total profit
- $38,150
- Equity at exit
- $7,263
Cash invested: $23,520 (down + closing). Projections, not guarantees.
Landlord ↔ Tenant lean methodology
- Overall (STATE)
- 81 Strongly Landlord-Friendly
- State Missouri
- 81 Strongly Landlord-Friendly · R+10
- County
- — inherits STATE
- City
- — inherits STATE
ZIP-level market 65775
- Home prices YoY
- -16.4%
- Active inventory
- 315
- Price-to-rent
- 6.4×
Monthly cashflow live
- Estimated rent
- $1,093 medium interval (Pro) →
- Mortgage (P&I)
- −$441
- Tax from tax record
- −$23 /mo · $276/yr
- Insurance
- −$35
- HOA
- −$0
- Vacancy / Maint / Mgmt
- −$230
- Net cashflow
- $365
Break-even live
UW: 25.0% down · 7.5% · 30yr · 1.5% tax · 5.0% vac · 8.0% maint · 8.0% mgmt
Financing live
Cash to close
- Down payment
- $21,000
- Closing costs
- $2,520
- Reserves months
- —
- Total cash needed
- —
Loan-product check · same deal, 3 products live
Conventional
25% down · 7.5% · 30yr
- Down + closing
- —
- Monthly P&I
- —
- Monthly cashflow
- —
- DSCR
- —
- Eligible?
- —
Personal DTI + credit; lowest rate.
DSCR
20% down · 8.5% · 30yr
- Down + closing
- —
- Monthly P&I
- —
- Monthly cashflow
- —
- DSCR
- —
- Eligible?
- —
No personal income docs; deal must DSCR.
Hard money
10% down · 12.0% · 12mo
- Down + closing
- —
- Monthly P&I
- —
- Monthly cashflow
- —
- DSCR
- —
- Eligible?
- —
Short-term bridge; refi at stabilization.
Listing history 16 events
-
2026-06-18days on market $84,000 Active 37 DOM
-
2026-06-17days on market $84,000 Active 36 DOM
-
2026-06-16days on market $84,000 Active 35 DOM
-
2026-06-15days on market $84,000 Active 34 DOM
-
2026-06-13days on market $84,000 Active 32 DOM
-
2026-06-12days on market $84,000 Active 31 DOM
-
2026-06-09days on market $84,000 Active 28 DOM
-
2026-06-08days on market $84,000 Active 27 DOM
-
2026-06-07days on market $84,000 Active 26 DOM
-
2026-06-07days on market $84,000 Active 25 DOM
-
2026-06-04days on market $84,000 Active 22 DOM
-
2026-06-02days on market $84,000 Active 21 DOM
-
2026-06-01days on market $84,000 Active 20 DOM
-
2026-05-31days on market $84,000 Active 19 DOM
-
2026-05-12$84,000 Active 620-char remark
-
1992-06-22soldstatus
ⓘ Source: listings_history table (triggers on properties + properties_extension) + one-shot
backfill from property_details.listing_events for pre-trigger history.
Tax reassessment forecast MO · Resets to sale price
- Current annual tax
- $276 · $23/mo
- Projected year-2 tax
- $815 · $68/mo
- Expected delta
- +$539/yr (+$45/mo · 195.3%)
ⓘ Screening estimate from a state-policy table — verify with the county assessor before closing.
Climate risk First Street
- Flood 1/10 Low FEMA zone X (unshaded) · 0% chance over 30 yrs
- Wildfire 6/10 Major
- Heat 5/10 Major 7 d/yr ≥106°F today · 20 d/yr by 30 yrs out
- Wind 2/10 Low 4% chance of damaging wind over 30 yrs
- Air quality 1/10 Low 0 unhealthy d/yr today · 0 by 30 yrs out
Nearby sold comps map
Loading sold comps map…
Walkable amenities ~0.75 mi
Loading nearby amenities…
Taxation est. · year 1
- Rental income
- $13,116
- − Mortgage interest
- −$4,705
- − Property taxes
- −$276
- − Insurance
- −$420
- − Repairs & maintenance
- −$1,049
- − Management
- −$1,049
- − Depreciation
- −$2,444
- Taxable income
- $3,172
- Est. tax owed @ 24.0%
- −$761
- After-tax cash flow
- $3,618/yr
For passive investors: Depreciation is non-cash, so a rental often shows a tax loss while cash-flowing — sheltering income. Rental losses are passive: they offset passive income freely, and up to $25,000/yr can offset ordinary (W-2) income if you actively participate and your MAGI is under $100k (phasing out to $0 by $150k); unused losses carry forward. On sale, claimed depreciation is recaptured at up to 25%, and gains may owe capital-gains tax (a 1031 exchange can defer both). Figures are a year-1 estimate at your 24.0% rate — not tax advice; consult a CPA.
Schools (NCES district)
- District
- West Plains R-VII
- NCES district ID
- 2931680
- Math proficiency
- 36% ▼ -5.00%
- Reading proficiency
- 46% ▲ 1.00%
- Median HH income
- $32,206
- Composite
- 33.59/100
- National rank
- #5419
- State rank
- #152 of 324 in MO
Livability — West Plains
- Score
- 77/100
- State rank
- #34
- US rank
- #2977
Category grades
Schools grade is shown separately in the Schools card above.
Census & demographics
- Population (ZIP)
- 24,950
Population outlook (Howell County) Hauer SSP2
- Today (2025)
- 38,462 people
- By 2030
- 37,240 · -3.2%
- By 2040
- 34,495 · -10.3%
- By 2050
- 31,450 · -18.2%
- By 2075
- 23,660 · -38.5%
- By 2100
- 16,373 · -57.4%
Race, ethnicity, and origin ACS 2023
- Neighborhood character
- Predominantly White (94%)
- Race & ethnicity
- White 94% Two or more races 4% Hispanic / Latino 2%
- Common ancestry
- Lithuanian 2% Portuguese 2% Slovak 1%
- Foreign-born
- 1% · Canada
- Languages at home
- 97% English-only · Spanish 1% German/W. Germanic 1%
Political lean MEDSL · Howell
- 2024 margin
- Solid R (+66.8) · D 16.2% · R 83.0%
- 2008→2024 swing
- -36.0pp toward R · 2008: -30.8pp · 2024: -66.8pp
- All cycles
- 2024: R+66.8 2020: R+64.2 2016: R+63.2 2012: R+43.8 2008: R+30.8
Not yet ingested
- Civics
- —
Market trends
- HPI YoY
- ▼ -44.99%
- Current HPI
- 228.8763
- Rent YoY
- —
- Metro
- —
- State GDP YoY
- ▲ 1.84%
- F500 in state
- 20
Industry mix (Fortune 500 HQ in MO)
| Industry | F500 HQs | Revenue |
|---|---|---|
| Healthcare | 1 | $163B |
|
||
| Insurance | 1 | $21B |
|
||
| Industrial Technology | 1 | $17B |
|
||
| Retail | 1 | $16B |
|
||
| Industrial Distribution | 1 | $10B |
|
||
| Utilities | 1 | $9B |
|
||
Price history
2 events — show timeline
- 2026-05-12 Listed $84,000 SOMO
- 1992-06-22 Sold (Public Records) — Public Records
Property tax history
+1.4%/yrLatest (2025): $276 · +9.6% YoY. Source: county tax records.
Cash-flow waterfall
monthlySold comps — $/sqft
last 12 mo · ≤1 miLoading sold comps…