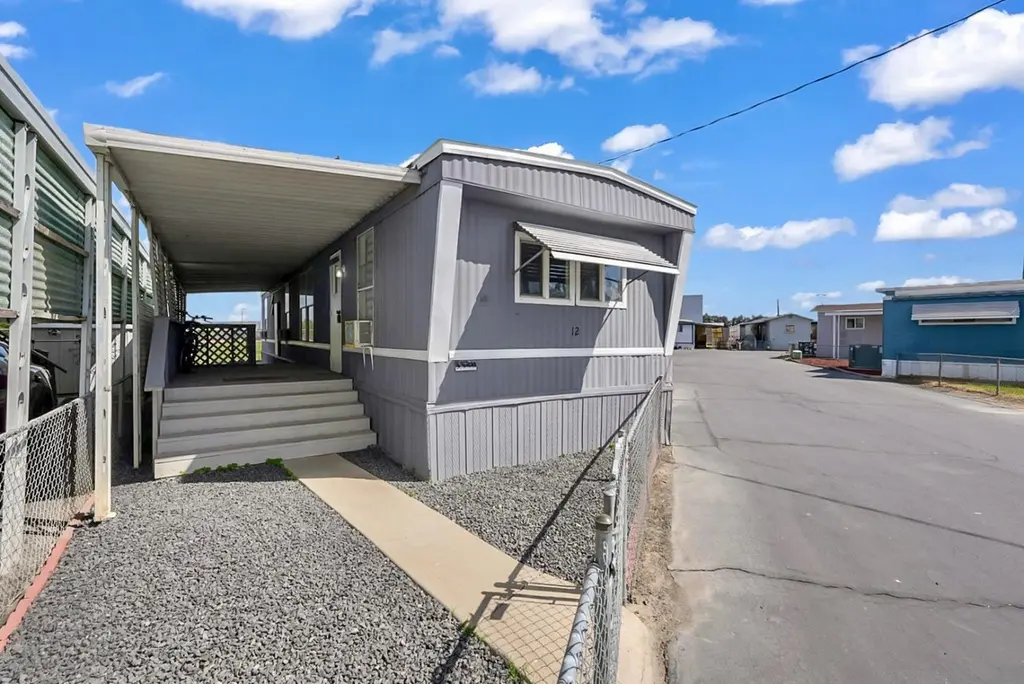
5538 Keith Ct #12 · Keyes, CA
Flood risk 7/10 · Major
- FEMA flood zone
- X (unshaded)
- Chance of flooding over 30 yrs
- 0.96%
- Est. flood insurance / yr
- $507 – $1,088
Fire risk 6/10 · Moderate
- Est. fire insurance / yr
- $659 – $1,223
Heat risk 7/10 · Major
- Hot days now (above 102°F)
- 7 days/yr
- Hot days in 30 yrs
- 16 days/yr
Wind risk 1/10 · Minimal
- Chance of severe wind over 30 yrs
- —
Air-quality risk 10/10 · Severe
- Unhealthy air days now
- 33 days/yr
- Unhealthy air days in 30 yrs
- 35 days/yr
Risk factors via First Street. Map © Google.
Why this score? — see what drove the C- grade
The composite is a weighted blend of 9 inputs, each scored 0–100. Each bar is that input's sub-score; the figure is the points it added to the 100-point composite (weight × sub-score).
- Cash flow +15.0/30.0
- ARV discount +15.0/15.0
- 1% rule +5.0/10.0
- DSCR +5.0/10.0
- Schools +5.0/10.0
- Rent growth +3.0/5.0
- Condition / age +2.8/5.0
- Livability +2.3/5.0
- Appreciation +0.0/10.0
$44,900
🖨 Deal sheet 📄 Offer letter ✓ Due diligence
Listing remarks
Welcome to this charming 2-Bedroom, 1-Bath Mobile Home, located in a peaceful 55+ community on the outskirts of Turlock, CA with 720 SQ FT of cozy living space. This home is perfect for those seeking a low-maintenance lifestyle, in an established neighborhood. The property is conveniently located near a major freeway for easy access and it is just minutes from shopping centers, restaurants and other amenities. Enjoy the tranquility of a quiet community while being close to everything you may need.
Key facts
- Parking
- Built 1976
- Listed 21 days
Property features AI
Finance
- HOA & community: No homeowners association; Located in a senior community; Land lease listed ($700) but land lease flagged as No
Exterior
- Parking: Covered parking
- Utilities: Public water; Public sewer; 220 volts available in kitchen
- Home design: Manufactured home in a park; Single-wide model; Concord make; Built in 1976
- Construction: Aluminum skirting; Roof: other (unspecified)
- Exterior features: Backyard; Fenced yard; Front yard
Interior
- Kitchen: Synthetic countertops; 220-volt circuit in kitchen
- Bedrooms: 2 bedrooms
- Flooring: Carpet; Laminate
- Bathrooms: 1 full bathroom with tub/shower combination
- Heating & cooling: Wall-mounted cooling units; Window air conditioning units; Heating: other (unspecified)
- Interior features: Dining and living area combined; Living room with undefined/other features
- Laundry & utility: Laundry: other (unspecified)
Neighborhood map
What this means for you Summary
Snapshot
- This is a 2-bed/1.0-bath manufactured listed at $45k. Condition is rated average.
Deal economics
- At list price, monthly cash flow is $1k ($15k/yr) — positive.
- The deal already cash-flows at list — no discount required.
- Meets the 1% rule at list price ($2k rent vs $45k).
- Recommended offer: $44k (1.5% below list) — sets the bar for market timing.
- Cap rate 42.3% vs local median 4.0% in Keyes — top-decile yield for the area; either an underpriced asset or a hidden risk that comps aren't pricing in. Stress-test before assuming the spread holds.
Location & tenants
- Location reads 46/100 on livability (#1,280 in CA) — a working-class tenant base; expect higher turnover. Strengths: housing A; Watch: schools D, employment D, crime F.
- Market conditions: Rents rising (+2.0%/yr); 131 active listings in the ZIP; 1 comparable units currently listed for rent nearby; solid renter incomes; 923 units permitted in Stanislaus County in 2024 (63 in 5+ unit buildings).
Forward outlook
- Local home prices are declining (-3.0%/yr); year-one equity from $310 of loan paydown is wiped out by about $1k of value loss. Plan a longer hold.
- Stanislaus County population projected at +14% by 2050 — modest demand growth; plan on rents tracking national, not racing it.
- At projected returns (-3.0% appreciation + 2.0% rent growth), your $13k cash investment doubles in ~1 year — after that, you're playing with house money.
Negotiation context
- It's been on market 21 days — a 2% lower offer ($44k) is reasonable based on typical stale-listing flexibility.
Risks & watch-outs
- Watch-outs: flood insurance adds $66/mo.
- Climate carrying-cost: major flood risk; major wildfire risk; extreme-heat days projected 7→16/yr by 2055 (HVAC capex compounding) — expect insurance premiums to compound above CPI over the hold.
Questions for the listing agent
- Built in 1976 — when were the roof, HVAC, electrical panel, plumbing, and water heater last replaced?
- What's the actual annual flood-insurance premium (NFIP or private), and is the property in a SFHA with mandatory coverage?
- Is there a deadline driving the sale (1031 exchange, divorce, estate, relocation)? That informs how much negotiation room exists.
- Schools are D-rated, which usually means shorter tenancies and higher turnover. Who's the typical renter profile here, and what's been the actual vacancy rate?
- Crime grade is F in this area — have there been break-ins, vandalism, or insurance claims at this property in the last 3 years? What carrier currently insures it and at what premium?
- What's the average days-on-market for RENTAL listings here right now (not sales)? A rising rental-DOM trend means longer vacancies and softer asking-rent achievability than the comps imply.
- What's the recent tenant-quality profile in this submarket — average credit score on applications, eviction rate, late-payment / NSF rate, and stable-employment percentage? A property-management company in the area should have these aggregated.
- How much new for-sale + rental construction is in the pipeline within 1–3 miles? Heavy new supply typically softens prices + rents 12–24 months out; constrained supply supports both.
Investment metrics
- 1% rule
- 4.68% ✓
- Cap rate
- 42.34%
- Cash-on-cash
- 128.73%
- DSCR
- 6.73
- GRM
- 1.8
CMA / ARV
- ARV (on-the-fly)
- $59,760
- Comps found
- 4
Show comp detail 4 sales within ~0.75 mi
| Address | Dist | Beds/Ba | Sqft | Sold | Price | $/sf | Match |
|---|---|---|---|---|---|---|---|
| 5538 Keith Ct | 0.00mi | 2/1.0 | 720 (0%) | 14mo | $40,000 | $56 | 88 |
| 5526 Keith Ct | 0.00mi | 2/1.0 | 696 (-3%) | 10mo | $57,500 | $83 | 86 |
| 5548 Keith Ct #7 | 0.00mi | 1/1.0 (-1) | 620 (-14%) | 11mo | $43,000 | $69 | 62 |
| 5061 Nunes Rd #39 | 0.59mi | 2/1.0 | 800 (+11%) | 11mo | $74,500 | $93 | 44 |
Match score weights: distance 35% · size 25% · config 20% · recency 20%. Top-matched comps best support the ARV.
Projected returns pro-forma
-3.0% appreciation · 1.96% rent growth · sell at horizon
- IRR
- —
- Equity multiple
- 6.75×
- Total profit
- $72,287
- Equity at exit
- $6,695
- IRR
- —
- Equity multiple
- 13.70×
- Total profit
- $159,658
- Equity at exit
- $3,882
Cash invested: $12,572 (down + closing). Projections, not guarantees.
Landlord ↔ Tenant lean methodology
- Overall (STATE)
- 18 Strongly Tenant-Friendly
- State California
- 18 Strongly Tenant-Friendly · D+13
- County
- — inherits STATE
- City
- — inherits STATE
ZIP-level market 95382
- Rents YoY
- 2.0%
- Active inventory
- 131
- Price-to-rent
- 1.8×
Monthly cashflow live
- Estimated rent
- $2,100 medium interval (Pro) →
- Mortgage (P&I)
- −$235
- Tax est. 1.5%
- −$56 /mo · $674/yr
- Insurance
- −$19
- Flood insurance flood zone
- −$66 /mo · $798/yr
- HOA
- −$0
- Vacancy / Maint / Mgmt
- −$441
- Net cashflow
- $1,282
Break-even live
UW: 25.0% down · 7.5% · 30yr · 1.5% tax · 5.0% vac · 8.0% maint · 8.0% mgmt
Financing live
Cash to close
- Down payment
- $11,225
- Closing costs
- $1,347
- Reserves months
- —
- Total cash needed
- —
Loan-product check · same deal, 3 products live
Conventional
25% down · 7.5% · 30yr
- Down + closing
- —
- Monthly P&I
- —
- Monthly cashflow
- —
- DSCR
- —
- Eligible?
- —
Personal DTI + credit; lowest rate.
DSCR
20% down · 8.5% · 30yr
- Down + closing
- —
- Monthly P&I
- —
- Monthly cashflow
- —
- DSCR
- —
- Eligible?
- —
No personal income docs; deal must DSCR.
Hard money
10% down · 12.0% · 12mo
- Down + closing
- —
- Monthly P&I
- —
- Monthly cashflow
- —
- DSCR
- —
- Eligible?
- —
Short-term bridge; refi at stabilization.
Rent comps 1 comps
| Address | Beds | Baths | Sqft | Rent | $/sqft | DOM | Units | Dist |
|---|---|---|---|---|---|---|---|---|
| 3025 W Christoffersen Pkwy Turlock, CA | 2.0 | 1.0–2.0 | 971 | $2,217 | $2.28 | 13d | 15 | 1.19mi |
Listing history 14 events
-
2026-06-18days on market $44,900 Active 21 DOM
-
2026-06-17days on market $44,900 Active 20 DOM
-
2026-06-16days on market $44,900 Active 19 DOM
-
2026-06-15days on market $44,900 Active 18 DOM
-
2026-06-14days on market $44,900 Active 16 DOM
-
2026-06-10days on market $44,900 Active 13 DOM
-
2026-06-09days on market $44,900 Active 12 DOM
-
2026-06-08days on market $44,900 Active 11 DOM
-
2026-06-07days on market $44,900 Active 10 DOM
-
2026-06-03days on market $44,900 Active 6 DOM
-
2026-06-02days on market $44,900 Active 5 DOM
-
2026-06-01days on market $44,900 Active 4 DOM
-
2026-05-31days on market $44,900 Active 3 DOM
-
2026-05-30days on market $44,900 Active 2 DOM
ⓘ Source: listings_history table (triggers on properties + properties_extension) + one-shot
backfill from property_details.listing_events for pre-trigger history.
Climate risk First Street
- Flood 7/10 Severe FEMA zone X (unshaded) · 96% chance over 30 yrs
- Wildfire 6/10 Major
- Heat 7/10 Severe 7 d/yr ≥102°F today · 16 d/yr by 30 yrs out
- Wind 1/10 Low
- Air quality 10/10 Extreme 33 unhealthy d/yr today · 35 by 30 yrs out
Nearby sold comps map
Loading sold comps map…
Walkable amenities ~0.75 mi
Loading nearby amenities…
Taxation est. · year 1
- Rental income
- $25,200
- − Mortgage interest
- −$2,515
- − Property taxes
- −$674
- − Insurance
- −$1,022
- − Repairs & maintenance
- −$2,016
- − Management
- −$2,016
- − Depreciation
- −$1,306
- Taxable income
- $15,651
- Est. tax owed @ 24.0%
- −$3,756
- After-tax cash flow
- $11,630/yr
For passive investors: Depreciation is non-cash, so a rental often shows a tax loss while cash-flowing — sheltering income. Rental losses are passive: they offset passive income freely, and up to $25,000/yr can offset ordinary (W-2) income if you actively participate and your MAGI is under $100k (phasing out to $0 by $150k); unused losses carry forward. On sale, claimed depreciation is recaptured at up to 25%, and gains may owe capital-gains tax (a 1031 exchange can defer both). Figures are a year-1 estimate at your 24.0% rate — not tax advice; consult a CPA.
Condition & rehab AI · 12 photos
This 2-bedroom, 1-bath mobile home in a 55+ community offers a low-maintenance lifestyle with potential for cosmetic upgrades to boost its resale and rental value.
Repairs flagged
- Minor kitchen cabinets — dated and cluttered
- Minor kitchen countertops — cluttered and dated
Value-add opportunities
- Both paint interior walls — fresh paint enhances curb appeal and interior aesthetics
- Both replace kitchen cabinets — new cabinets improve functionality and aesthetics
- Both landscaping — improved landscaping enhances curb appeal and property value
Renovation cost estimate screening
| Repair item | Severity | Est. cost |
|---|---|---|
| kitchen cabinets · dated and cluttered | Minor | $500–3,000 |
| kitchen countertops · cluttered and dated | Minor | $500–3,000 |
| Total estimated repair cost · 2 items | $1,000–6,000 |
Value-add ROI direction
- Both paint interior walls — fresh paint enhances curb appeal and interior aesthetics ↑
- Both replace kitchen cabinets — new cabinets improve functionality and aesthetics ↑
- Both landscaping — improved landscaping enhances curb appeal and property value ↑
ⓘ Cost ranges are severity-bucket heuristics (US national rule-of-thumb). Get contractor quotes + a written scope before underwriting a rehab budget.
Schools (NCES district)
No district data.
Livability — Keyes
- Score
- 46/100
- State rank
- #1280
- US rank
- #26476
Category grades
Schools grade is shown separately in the Schools card above.
Census & demographics
- County
- Stanislaus County · 445,786 people
- City population
- 3,939
- Metro
- Modesto, CA
- Population (ZIP)
- 39,083
- Household income
- $95,282
- Rent vs Own
- Severe rent burden
- 1385.0
Population outlook (Stanislaus County) Hauer SSP2
- Today (2025)
- 579,493 people
- By 2030
- 598,000 · +3.2%
- By 2040
- 630,930 · +8.9%
- By 2050
- 658,300 · +13.6%
- By 2075
- 712,363 · +22.9%
- By 2100
- 719,805 · +24.2%
Race, ethnicity, and origin ACS 2023
- Neighborhood character
- Diverse neighborhood (Simpson 0.61)
- Race & ethnicity
- White 52% Hispanic / Latino 33% Two or more races 15% Asian 7% Black 2%
- Hispanic origin (detail)
- Mexican 29%
- Common ancestry
- Russian 8% Italian 2% Lithuanian 2%
- Foreign-born
- 21% · Canada, South Korea
- Languages at home
- 63% English-only · Spanish 20% Other Indo-European 6% Korean 1%
Political lean MEDSL · Stanislaus
- 2024 margin
- R (+11.0) · D 43.2% · R 54.2% · Other 2.6%
- 2008→2024 swing
- -12.7pp toward R · 2008: 1.7pp · 2024: -11.0pp
- All cycles
- 2024: R+11.0 2020: D+0.8 2016: D+0.6 2012: D+0.7 2008: D+1.7
Not yet ingested
- Civics
- —
Market trends
- HPI YoY
- ▼ -312.66%
- Current HPI
- 279.1791
- Rent YoY
- ▲ 1.96%
- Metro
- Modesto, CA
- State GDP YoY
- ▲ 3.21%
- F500 in state
- 116
Industry mix (Fortune 500 HQ in CA)
| Industry | F500 HQs | Revenue |
|---|---|---|
| Technology | 27 | $1,492B |
|
||
| Financial Services | 3 | $174B |
|
||
| Retail | 3 | $44B |
|
||
| Insurance | 3 | $26B |
|
||
| Media / Entertainment | 2 | $115B |
|
||
| Pharmaceuticals / Biotech | 2 | $62B |
|
||
Cash-flow waterfall
monthlySold comps — $/sqft
last 12 mo · ≤1 miLoading sold comps…