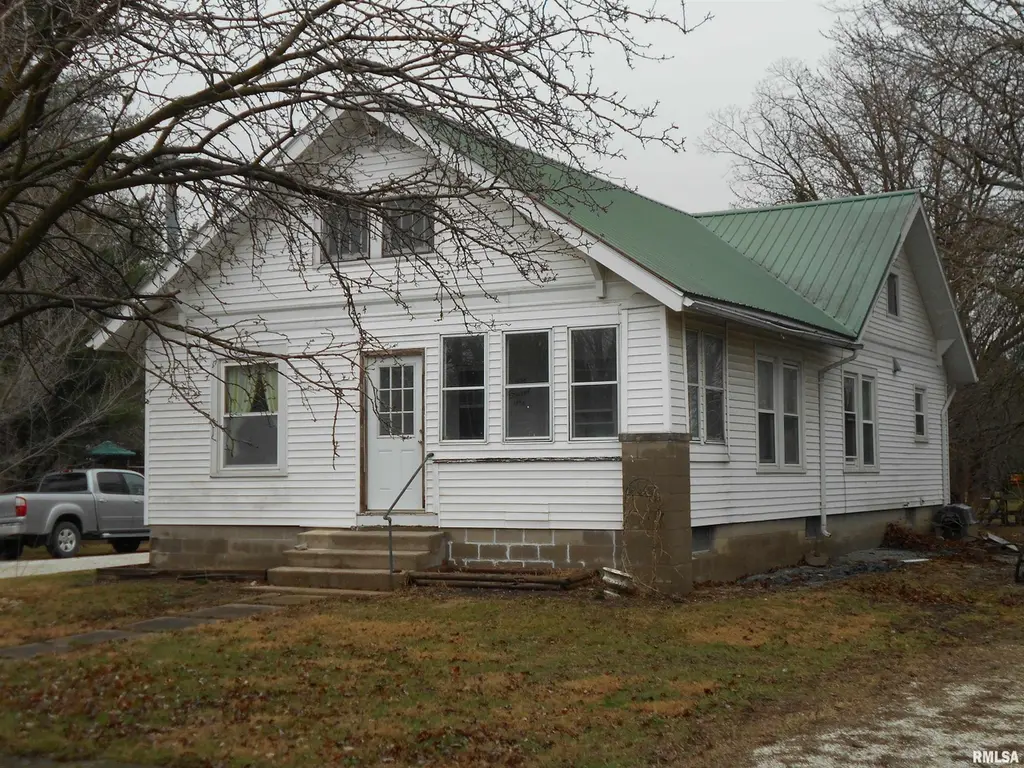
204 Maple St · Augusta, IL
Flood risk 1/10 · Minimal
- FEMA flood zone
- X (unshaded)
- Chance of flooding over 30 yrs
- 0.0%
- Est. flood insurance / yr
- $473 – $860
Fire risk 1/10 · Minimal
- Est. fire insurance / yr
- $804 – $1,492
Heat risk 3/10 · Minor
- Hot days now (above 107°F)
- 7 days/yr
- Hot days in 30 yrs
- 17 days/yr
Wind risk 2/10 · Minimal
- Chance of severe wind over 30 yrs
- 1.0%
Air-quality risk 2/10 · Minimal
- Unhealthy air days now
- 0 days/yr
- Unhealthy air days in 30 yrs
- 1 days/yr
Risk factors via First Street. Map © Google.
Why this score? — see what drove the B+ grade
The composite is a weighted blend of 9 inputs, each scored 0–100. Each bar is that input's sub-score; the figure is the points it added to the 100-point composite (weight × sub-score).
- Cash flow +30.0/30.0
- ARV discount +15.0/15.0
- 1% rule +10.0/10.0
- DSCR +10.0/10.0
- Appreciation +5.0/10.0
- Livability +3.0/5.0
- Rent growth +2.5/5.0
- Condition / age +2.5/5.0
- Schools +2.0/10.0
$65,000
🖨 Deal sheet (PDF) 📄 Offer letter ✓ Due diligence
Listing remarks MLS
If you have been looking for an affordable home in a small quiet community, then this is the one. The large sized rooms and hardwood floors will immediately catch your attention and with 3 bedrooms, there is plenty of room to spread out. Additional features include a floored attic and a full basement. Come take a look at what midwest rural America is all about.
Key facts
- Floored attic
- Full basement
- 0.34 acre lot
Tags
Neighborhood map
What this means for you Summary
Snapshot
- This is a 3-bed/1.0-bath single-family listed at $65k.
Deal economics
- At list price, monthly cash flow is $338 ($4k/yr) — positive.
- The deal already cash-flows at list — no discount required.
- Meets the 1% rule at list price ($993 rent vs $65k).
- Recommended offer: $61k (6.0% below list) — sets the bar for market timing.
Location & tenants
- Location reads 59/100 on livability (#1,037 in IL) — a working-class tenant base; expect higher turnover. Strengths: cost of living A+, housing A+; Watch: schools D, crime D-, amenities F.
- Southeastern CUSD 337 (rural): math 20% / reading 26% proficiency, ranked #375 of 620 in IL (top 60%) — low school quality limits family demand, transient renter base, plan for 1-2y turnover.
- Market conditions: 3 active listings in the ZIP.
Forward outlook
- In year one you build about $2k of equity ($449 loan paydown + $2k appreciation (3.0% local appreciation)).
- Hancock County population projected at -30% by 2050 — secular population decline; favor cash flow + early exit over multi-decade hold.
- At projected returns (3.0% appreciation + 3.0% rent growth), your $18k cash investment doubles in ~3 years — after that, you're playing with house money.
Negotiation context
- It's been on market 70 days — a 6% lower offer ($61k) is reasonable based on typical stale-listing flexibility.
Questions for the listing agent
- It's been on market 70 days. Have you received any prior offers? Is the seller open to a 6% concession, seller financing, or rate buy-down credit?
- Why hasn't it sold? Are there any deal-killer items the seller is aware of (foundation, flood, title, zoning, code violations)?
- Is there a deadline driving the sale (1031 exchange, divorce, estate, relocation)? That informs how much negotiation room exists.
- Schools are D-rated, which usually means shorter tenancies and higher turnover. Who's the typical renter profile here, and what's been the actual vacancy rate?
- Crime grade is D in this area — have there been break-ins, vandalism, or insurance claims at this property in the last 3 years? What carrier currently insures it and at what premium?
- What's the average days-on-market for RENTAL listings here right now (not sales)? A rising rental-DOM trend means longer vacancies and softer asking-rent achievability than the comps imply.
- What's the recent tenant-quality profile in this submarket — average credit score on applications, eviction rate, late-payment / NSF rate, and stable-employment percentage? A property-management company in the area should have these aggregated.
- How much new for-sale + rental construction is in the pipeline within 1–3 miles? Heavy new supply typically softens prices + rents 12–24 months out; constrained supply supports both.
Investment metrics
- 1% rule
- 1.53% ✓
- Cap rate
- 12.53%
- Cash-on-cash
- 22.29%
- DSCR
- 1.99
- GRM
- 5.5
CMA / ARV
- ARV (median comp)
- $86,368
- List price
- $65,000
- Delta
- -24.74%
- Verdict
- UNDERPRICED
- Comps
- 16 within 1.0 mi
Show comp detail 6 sales within ~0.75 mi
| Address | Dist | Beds/Ba | Sqft | Sold | Price | $/sf | Match |
|---|---|---|---|---|---|---|---|
| 204 Maple St | 0.00mi | 3/1.0 | 1,136 (0%) | 0mo | $55,000 | $48 | 100 |
| 309 Maple St | 0.13mi | 2/1.0 (-1) | 1,092 (-4%) | 24mo | $75,000 | $69 | 63 |
| 607 N Street | 0.26mi | 3/1.5 | 1,196 (+5%) | 24mo | $115,000 | $96 | 57 |
| 603 E Washington St | 0.34mi | 2/1.0 (-1) | 1,100 (-3%) | 21mo | $67,000 | $61 | 56 |
| 605 E Green St | 0.43mi | 3/1.0 | 1,036 (-9%) | 18mo | $93,000 | $90 | 50 |
| 802 Winters St | 0.46mi | 3/1.0 | 1,000 (-12%) | 18mo | $100,000 | $100 | 44 |
Match score weights: distance 35% · size 25% · config 20% · recency 20%. Top-matched comps best support the ARV.
Projected returns pro-forma
3.0% appreciation · 3.0% rent growth · sell at horizon
- IRR
- 28.5%
- Equity multiple
- 2.61×
- Total profit
- $29,374
- Equity at exit
- $29,227
- IRR
- 29.0%
- Equity multiple
- 5.09×
- Total profit
- $74,423
- Equity at exit
- $45,042
Cash invested: $18,200 (down + closing). Projections, not guarantees.
Landlord ↔ Tenant lean methodology
- Overall (STATE)
- 43 Moderately Tenant-Leaning
- State Illinois
- 43 Moderately Tenant-Leaning · D+7
- County
- — inherits STATE
- City
- — inherits STATE
ZIP-level market 62311
- Active inventory
- 3
- Price-to-rent
- 5.5×
Monthly cashflow live
- Estimated rent
- $993 medium interval (Pro) →
- Mortgage (P&I)
- −$341
- Tax from tax record
- −$78 /mo · $941/yr
- Insurance
- −$27
- HOA
- −$0
- Vacancy / Maint / Mgmt
- −$209
- Net cashflow
- $338
Break-even live
Sensitivity live
| Price | -10% $375 | -5% $356 | +0% $338 | +5% $320 | +10% $301 |
|---|---|---|---|---|---|
| Rent | -10% $260 | -5% $299 | +0% $338 | +5% $377 | +10% $416 |
| Rate | -1.0pp $371 | -0.5pp $355 | base $338 | +0.5pp $321 | +1.0pp $304 |
UW: 25.0% down · 7.5% · 30yr · 1.5% tax · 5.0% vac · 8.0% maint · 8.0% mgmt
Financing live
Cash to close
- Down payment
- $16,250
- Closing costs
- $1,950
- Reserves months
- —
- Total cash needed
- —
Loan-product check · same deal, 3 products live
Conventional
25% down · 7.5% · 30yr
- Down + closing
- —
- Monthly P&I
- —
- Monthly cashflow
- —
- DSCR
- —
- Eligible?
- —
Personal DTI + credit; lowest rate.
DSCR
20% down · 8.5% · 30yr
- Down + closing
- —
- Monthly P&I
- —
- Monthly cashflow
- —
- DSCR
- —
- Eligible?
- —
No personal income docs; deal must DSCR.
Hard money
10% down · 12.0% · 12mo
- Down + closing
- —
- Monthly P&I
- —
- Monthly cashflow
- —
- DSCR
- —
- Eligible?
- —
Short-term bridge; refi at stabilization.
Listing history 2 events
-
2026-05-18status Pending 366-char remark
Show marketing remark (366 chars)
If you have been looking for an affordable home in a small quiet community, then this is the one. The large sized rooms and hardwood floors will immediately catch your attention and with 3 bedrooms, there is plenty of room to spread out. Additional features include a floored attic and a full basement. Come take a look at what midwest rural America is all about.
-
2026-03-09$65,000 Active 366-char remark
Show marketing remark (366 chars)
If you have been looking for an affordable home in a small quiet community, then this is the one. The large sized rooms and hardwood floors will immediately catch your attention and with 3 bedrooms, there is plenty of room to spread out. Additional features include a floored attic and a full basement. Come take a look at what midwest rural America is all about.
ⓘ Source: listings_history table (triggers on properties + properties_extension) + one-shot
backfill from property_details.listing_events for pre-trigger history.
Tax reassessment forecast IL · Partial reset (capped growth)
- Current annual tax
- $941 · $78/mo
- Projected year-2 tax
- $1,208 · $101/mo
- Expected delta
- +$267/yr (+$22/mo · 28.4%)
ⓘ Screening estimate from a state-policy table — verify with the county assessor before closing.
Climate risk First Street
- Flood 1/10 Low FEMA zone X (unshaded) · 0% chance over 30 yrs
- Wildfire 1/10 Low
- Heat 3/10 Moderate 7 d/yr ≥107°F today · 17 d/yr by 30 yrs out
- Wind 2/10 Low 100% chance of damaging wind over 30 yrs
- Air quality 2/10 Low 0 unhealthy d/yr today · 1 by 30 yrs out
Nearby sold comps map
Loading sold comps map…
Walkable amenities ~0.75 mi
Loading nearby amenities…
Taxation est. · year 1
- Rental income
- $11,916
- − Mortgage interest
- −$3,641
- − Property taxes
- −$941
- − Insurance
- −$325
- − Repairs & maintenance
- −$953
- − Management
- −$953
- − Depreciation
- −$1,891
- Taxable income
- $3,211
- Est. tax owed @ 24.0%
- −$771
- After-tax cash flow
- $3,286/yr
For passive investors: Depreciation is non-cash, so a rental often shows a tax loss while cash-flowing — sheltering income. Rental losses are passive: they offset passive income freely, and up to $25,000/yr can offset ordinary (W-2) income if you actively participate and your MAGI is under $100k (phasing out to $0 by $150k); unused losses carry forward. On sale, claimed depreciation is recaptured at up to 25%, and gains may owe capital-gains tax (a 1031 exchange can defer both). Figures are a year-1 estimate at your 24.0% rate — not tax advice; consult a CPA.
Schools (NCES district)
- District
- Southeastern CUSD 337
- NCES district ID
- 1736610
- Math proficiency
- 20% ▼ -9.00%
- Reading proficiency
- 26% ▼ -17.00%
- Median HH income
- $44,674
- Composite
- 19.87/100
- National rank
- #8690
- State rank
- #375 of 620 in IL
Livability — Augusta
- Score
- 59/100
- State rank
- #1037
- US rank
- #19864
Category grades
Schools grade is shown separately in the Schools card above.
Census & demographics
- Census place
- Augusta, IL
- Population (ZIP)
- 893
Population outlook (Hancock County) Hauer SSP2
- Today (2025)
- 17,042 people
- By 2030
- 16,056 · -5.8%
- By 2040
- 13,912 · -18.4%
- By 2050
- 11,879 · -30.3%
- By 2075
- 8,302 · -51.3%
- By 2100
- 5,846 · -65.7%
Race, ethnicity, and origin ACS 2023
- Neighborhood character
- Predominantly White (93%)
- Race & ethnicity
- White 93% Two or more races 5% Hispanic / Latino 3%
- Common ancestry
- Slovak 3% Lithuanian 1% Italian 1%
- Foreign-born
- 1%
- Languages at home
- 99% English-only · Russian/Polish/Slavic 1%
Political lean MEDSL · Hancock
- 2024 margin
- Solid R (+50.0) · D 24.1% · R 74.1% · Other 1.8%
- 2008→2024 swing
- -39.2pp toward R · 2008: -10.8pp · 2024: -50.0pp
- All cycles
- 2024: R+50.0 2020: R+48.9 2016: R+50.8 2012: R+19.0 2008: R+10.8
Not yet ingested
- Civics
- —
Market trends
- HPI YoY
- —
- Current HPI
- —
- Rent YoY
- —
- Metro
- —
- State GDP YoY
- ▲ 1.59%
- F500 in state
- 60
Industry mix (Fortune 500 HQ in IL)
| Industry | F500 HQs | Revenue |
|---|---|---|
| Insurance | 4 | $201B |
|
||
| Consumer Goods | 4 | $87B |
|
||
| Industrial Machinery | 3 | $64B |
|
||
| Healthcare | 2 | $55B |
|
||
| Retail / Pharmacy | 1 | $148B |
|
||
| Agriculture / Food | 1 | $86B |
|
||
Price history
2 events — show timeline
- 2026-05-18 Pending — RMLSA as Distributed by MLS Grid
- 2026-03-09 Listed $65,000 RMLSA as Distributed by MLS Grid
Property tax history
+2.8%/yrLatest (2024): $941 · +6.6% YoY. Source: county tax records.
Cash-flow waterfall
monthlySold comps — $/sqft
last 12 mo · ≤1 miLoading sold comps…