 Duplex
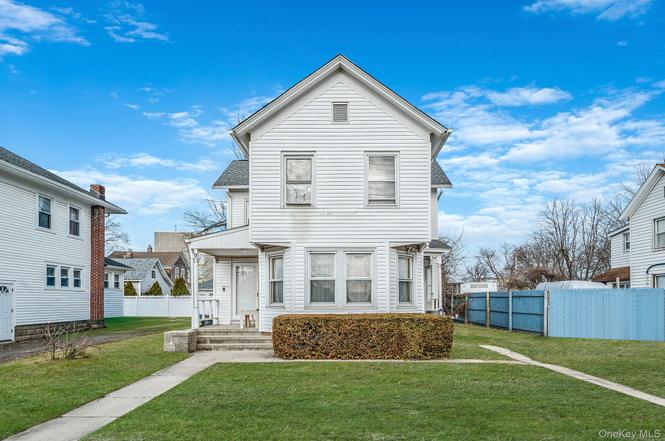
19 Academy St · Patchogue, NY
Flood risk 1/10 · Minimal
- FEMA flood zone
- X (unshaded)
- Chance of flooding over 30 yrs
- 0.0%
- Est. flood insurance / yr
- $507 – $1,088
Fire risk 1/10 · Minimal
- Est. fire insurance / yr
- $691 – $1,283
Heat risk 5/10 · Moderate
- Hot days now (above 92°F)
- 7 days/yr
- Hot days in 30 yrs
- 18 days/yr
Wind risk 8/10 · Major
- Chance of severe wind over 30 yrs
- 80.0%
Air-quality risk 3/10 · Minor
- Unhealthy air days now
- 3 days/yr
- Unhealthy air days in 30 yrs
- 4 days/yr
Risk factors via First Street. Map © Google.
Why this score? — see what drove the D- grade
The composite is a weighted blend of 9 inputs, each scored 0–100. Each bar is that input's sub-score; the figure is the points it added to the 100-point composite (weight × sub-score).
- Cash flow +11.3/30.0
- Schools +6.7/10.0
- 1% rule +4.4/10.0
- Livability +4.0/5.0
- Rent growth +3.8/5.0
- DSCR +3.3/10.0
- ARV discount +2.7/15.0
- Condition / age +2.5/5.0
- Appreciation +0.0/10.0
$625,000
🖨 Deal sheet (PDF) 📄 Offer letter ✓ Due diligence
Multi-family units
County records classify this as Multi-Family (2-4 Unit). Listing-text estimate: 2 units. confirmed
Listing remarks MLS
Legal 2 Family - Great investment opportunity
Key facts
- 7,405 sq ft lot
- Built 1910
- Listed 45 days
Neighborhood map
What this means for you Summary
Snapshot
- This is a 2 × 2-bed/1.0-bath units multifamily listed at $625k.
Deal economics
- At list price, monthly cash flow is $-227 ($-3k/yr) — negative. Per door: $-114/mo.
- To cash-flow at today's rent, offer at most $585k (6.4% below list).
- To meet the 1% rule (rent ≥ 1% of price), the offer needs to be $585k (6.4% below list).
- Recommended offer: $585k (6.4% below list) — sets the bar for cash-flow.
- Cap rate 5.9% vs local median 3.4% in Patchogue — top-decile yield for the area; either an underpriced asset or a hidden risk that comps aren't pricing in. Stress-test before assuming the spread holds.
Location & tenants
- Location reads 80/100 on livability (#108 in NY, #1,800 nationally) — a professional / high-income tenant draw. Strengths: employment A+, housing A+, health & safety A+; Watch: amenities D-, cost of living F.
- Patchogue-Medford Union Free School District (suburban): math 83% / reading 69% proficiency, ranked #73 of 590 in NY (top 12%) — strong family-tenant draw, lease renewals of 3-5y typical.
- Zoned schools: River Elementary School (math 75%, 300 students, 47% FRL); South Ocean Middle School (math 75%, 599 students, 57% FRL); Patchogue-Medford High School (math 89% / reading 67%, grade A-, #577 of 1,100 statewide, top 52%, 2,443 students, 53% FRL) — zoned schools average 52% FRL vs 35% district-wide (18 pts higher); higher-poverty schools than district average — tighter screening recommended.
- Market conditions: Rents rising fast (+5.1%/yr); 219 active listings in the ZIP; 5 comparable units currently listed for rent nearby; rentals leasing fast (median 0d on market — plan ~1-2 weeks tenant-placement turnaround); solid renter incomes; 1,366 units permitted in Suffolk County in 2024 (216 in 5+ unit buildings).
- At $5,849/mo this rent would consume 67% of the median local household income ($105k/yr) (locally 1595% of renters already pay >50% of income on rent) — very limited rent-growth headroom before tenants either downsize or default.
Forward outlook
- Local home prices are declining (-3.0%/yr); year-one equity from $4k of loan paydown is wiped out by about $19k of value loss. Plan a longer hold.
- Suffolk County population projected to shrink 5% by 2050 — rents likely to lag national; underwrite the cash flow, not the appreciation.
Negotiation context
- It's been on market 45 days — a 3% lower offer ($606k) is reasonable based on typical stale-listing flexibility.
- 3 sale attempts since 4y ago with the ask held roughly flat each time — persistent listings suggest the price (not the market) is what's stuck; bring a comps-based counter.
- Current owner paid $425k; 47% above their basis — modest negotiation headroom, anchor on the comps not their cost.
Risks & watch-outs
- Watch-outs: property tax is 2.5% of price; built in 1910 — expect roof / HVAC / electrical / plumbing capex.
- Climate carrying-cost: severe wind risk, 80% chance of damaging wind over 30y; extreme-heat days projected 7→18/yr by 2055 (HVAC capex compounding) — expect insurance premiums to compound above CPI over the hold.
Questions for the listing agent
- What do current leases actually rent for vs. the listed asking? Can we see a recent rent roll and the last 12 months of T-12 income?
- It's been on market 45 days. Have you received any prior offers? Is the seller open to a 6% concession, seller financing, or rate buy-down credit?
- Can we see the unit-by-unit rent roll, current vacancy, and any below-market leases? What's the average tenancy length?
- What capital expenditures (roof, boiler, parking lot, exteriors) have been made in the last 5 years, and what's planned in the next 2?
- Built in 1910 — when were the roof, HVAC, electrical panel, plumbing, and water heater last replaced?
- Property tax is high relative to price — has the assessment been appealed recently, and will the sale trigger a re-assessment?
- Is there a deadline driving the sale (1031 exchange, divorce, estate, relocation)? That informs how much negotiation room exists.
- Schools are F-rated, which usually means shorter tenancies and higher turnover. Who's the typical renter profile here, and what's been the actual vacancy rate?
- The area grade is low — what's the realistic commute time and amenity access for the typical tenant pool here? Any planned neighborhood developments (good or bad) we should know about?
- What's the average days-on-market for RENTAL listings here right now (not sales)? A rising rental-DOM trend means longer vacancies and softer asking-rent achievability than the comps imply.
- What's the recent tenant-quality profile in this submarket — average credit score on applications, eviction rate, late-payment / NSF rate, and stable-employment percentage? A property-management company in the area should have these aggregated.
- How much new apartment / multifamily construction is in the pipeline within 1–3 miles? Heavy new supply (>2% of stock underway) typically softens rents 12–24 months out; light construction supports rent growth.
Investment metrics
- 1% rule
- 0.94% ✗
- Cap rate
- 5.86%
- Cash-on-cash
- -1.56%
- DSCR
- 0.93
- GRM
- 8.9
CMA / ARV
- ARV (on-the-fly)
- $565,308
- Comps found
- 2
Show comp detail 2 sales within ~0.75 mi
| Address | Dist | Beds/Ba | Sqft | Sold | Price | $/sf | Match |
|---|---|---|---|---|---|---|---|
| 19 Academy St | 0.00mi | 4/2.0 | 1,532 (0%) | 1mo | $565,000 | $369 | 99 |
| 13 Academy St | 0.02mi | 3/2.0 (-1) | 1,639 (+7%) | 2mo | $510,000 | $311 | 81 |
Match score weights: distance 35% · size 25% · config 20% · recency 20%. Top-matched comps best support the ARV.
Projected returns pro-forma
-3.0% appreciation · 5.07% rent growth · sell at horizon
- IRR
- -16.2%
- Equity multiple
- 0.41×
- Total profit
- $-102,895
- Equity at exit
- $93,190
- IRR
- -4.2%
- Equity multiple
- 0.70×
- Total profit
- $-53,319
- Equity at exit
- $54,039
Cash invested: $175,000 (down + closing). Projections, not guarantees.
Landlord ↔ Tenant lean methodology
- Overall (STATE)
- 15 Strongly Tenant-Friendly
- State New York
- 15 Strongly Tenant-Friendly · D+10
- County
- — inherits STATE
- City
- — inherits STATE
ZIP-level market 11772
- Rents YoY
- 5.1%
- Active inventory
- 219
- Price-to-rent
- 17.8×
Monthly cashflow live
- Estimated rent
- $5,849 high interval (Pro) →
- Mortgage (P&I)
- −$3,278
- Tax from tax record
- −$1,310 /mo · $15,718/yr
- Insurance
- −$260
- HOA
- −$0
- Vacancy / Maint / Mgmt
- −$1,228
- Net cashflow
- $-227
Break-even live
Sensitivity live
| Price | -10% $127 | -5% $-50 | +0% $-227 | +5% $-404 | +10% $-581 |
|---|---|---|---|---|---|
| Rent | -10% $-689 | -5% $-458 | +0% $-227 | +5% $4 | +10% $235 |
| Rate | -1.0pp $88 | -0.5pp $-68 | base $-227 | +0.5pp $-389 | +1.0pp $-554 |
2-unit breakdown (identical units grouped — click to expand)
| Units | Beds | Baths | Est. rent |
|---|---|---|---|
| 2× units | 2 | 1 | $5,848 |
| #1 | 2 | 1 | $2,924 |
| #2 | 2 | 1 | $2,924 |
| Total (2 units) | $5,849 | ||
UW: 25.0% down · 7.5% · 30yr · 1.5% tax · 5.0% vac · 8.0% maint · 8.0% mgmt
Financing live
Cash to close
- Down payment
- $156,250
- Closing costs
- $18,750
- Reserves months
- —
- Total cash needed
- —
Loan-product check · same deal, 3 products live
Conventional
25% down · 7.5% · 30yr
- Down + closing
- —
- Monthly P&I
- —
- Monthly cashflow
- —
- DSCR
- —
- Eligible?
- —
Personal DTI + credit; lowest rate.
DSCR
20% down · 8.5% · 30yr
- Down + closing
- —
- Monthly P&I
- —
- Monthly cashflow
- —
- DSCR
- —
- Eligible?
- —
No personal income docs; deal must DSCR.
Hard money
10% down · 12.0% · 12mo
- Down + closing
- —
- Monthly P&I
- —
- Monthly cashflow
- —
- DSCR
- —
- Eligible?
- —
Short-term bridge; refi at stabilization.
Rent comps 5 comps
| Address | Beds | Baths | Sqft | Rent | $/sqft | DOM | Units | Dist |
|---|---|---|---|---|---|---|---|---|
| 39 Laurel St Patchogue, NY | 3.0 | 2.0 | 1100 | $3,400 | $3.09 | 26d | 1 | 0.51mi |
| 104 River Ave Patchogue, NY | 3.0 | 1.0 | 1100 | $3,100 | $2.82 | 1d | 1 | 0.52mi |
| 96 River Ave Patchogue, NY | 3.0 | 1.0 | 2102 | $3,100 | $1.47 | 0d | 1 | 0.52mi |
| 17 Mott St Patchogue, NY | 3.0 | 2.0 | 1326 | $3,850 | $2.90 | 0d | 1 | 0.69mi |
| 143 N Summit Ave Patchogue, NY | 3.0 | 1.0 | 1400 | $4,800 | $3.43 | 0d | 1 | 1.00mi |
Listing history 12 events
-
2026-03-14status Pending
-
2026-01-29$625,000 Active
-
2026-01-17historical $625,000
-
2022-08-18soldstatus $425,150
-
2022-06-06soldstatus $425,150 Closed 45-char remark
Show marketing remark (45 chars)
Legal 2 Family - Great investment opportunity
-
2022-04-01status Pending 45-char remark
Show marketing remark (45 chars)
Legal 2 Family - Great investment opportunity
-
2022-02-23status Active 45-char remark
Show marketing remark (45 chars)
Legal 2 Family - Great investment opportunity
-
2022-02-22historical 45-char remark
Show marketing remark (45 chars)
Legal 2 Family - Great investment opportunity
-
2022-02-15$450,000 Active 45-char remark
Show marketing remark (45 chars)
Legal 2 Family - Great investment opportunity
-
2005-10-04soldstatus $330,000
-
1996-02-28soldstatus $74,000
-
1989-12-14soldstatus $100,000
ⓘ Source: listings_history table (triggers on properties + properties_extension) + one-shot
backfill from property_details.listing_events for pre-trigger history.
Tax reassessment forecast NY · Partial reset (capped growth)
- Current annual tax
- $15,718 · $1,310/mo
- Projected year-2 tax
- $15,718 · $1,310/mo
- Expected delta
- $0/yr ($0/mo · 0.0%)
ⓘ Screening estimate from a state-policy table — verify with the county assessor before closing.
Climate risk First Street
- Flood 1/10 Low FEMA zone X (unshaded) · 0% chance over 30 yrs
- Wildfire 1/10 Low
- Heat 5/10 Major 7 d/yr ≥92°F today · 18 d/yr by 30 yrs out
- Wind 8/10 Severe 80% chance of damaging wind over 30 yrs
- Air quality 3/10 Moderate 3 unhealthy d/yr today · 4 by 30 yrs out
Nearby sold comps map
Loading sold comps map…
Walkable amenities ~0.75 mi
Loading nearby amenities…
Taxation est. · year 1
- Rental income
- $70,188
- − Mortgage interest
- −$35,010
- − Property taxes
- −$15,718
- − Insurance
- −$3,125
- − Repairs & maintenance
- −$5,615
- − Management
- −$5,615
- − Depreciation
- −$18,182
- Taxable loss
- −$13,077
- Est. tax savings @ 24.0%
- +$3,138
- After-tax cash flow
- $413/yr
For passive investors: Depreciation is non-cash, so a rental often shows a tax loss while cash-flowing — sheltering income. Rental losses are passive: they offset passive income freely, and up to $25,000/yr can offset ordinary (W-2) income if you actively participate and your MAGI is under $100k (phasing out to $0 by $150k); unused losses carry forward. On sale, claimed depreciation is recaptured at up to 25%, and gains may owe capital-gains tax (a 1031 exchange can defer both). Figures are a year-1 estimate at your 24.0% rate — not tax advice; consult a CPA.
Schools (NCES district)
- District
- Patchogue-Medford Union Free School District
- NCES district ID
- 3622470
- Math proficiency
- 83% ▲ 27.00%
- Reading proficiency
- 69% ▲ 15.00%
- Median HH income
- $75,120
- Composite
- 66.81/100
- National rank
- #405
- State rank
- #73 of 590 in NY
Livability — Patchogue
- Score
- 80/100
- State rank
- #108
- US rank
- #1800
Category grades
Schools grade is shown separately in the Schools card above.
Census & demographics
- Census place
- Patchogue, NY
- County
- Suffolk County · 679,920 people
- City population
- 45,023
- Metro
- New York-Newark-Jersey City, NY-NJ-PA
- Population (ZIP)
- 45,023
- Household income
- $105,245
- Rent vs Own
- Severe rent burden
- 1595.0
Population outlook (Suffolk County) Hauer SSP2
- Today (2025)
- 1,505,262 people
- By 2030
- 1,498,318 · -0.5%
- By 2040
- 1,471,101 · -2.3%
- By 2050
- 1,424,848 · -5.3%
- By 2075
- 1,337,157 · -11.2%
- By 2100
- 1,217,720 · -19.1%
Race, ethnicity, and origin ACS 2023
- Neighborhood character
- Predominantly White (66%)
- Race & ethnicity
- White 66% Hispanic / Latino 24% Two or more races 8% Black 4% Asian 3%
- Hispanic origin (detail)
- Mexican 1% Puerto Rican 5% Dominican 2%
- Common ancestry
- Romanian 4% Lithuanian 2% Scotch-Irish 2%
- Foreign-born
- 15% · Canada, Jamaica, China
- Languages at home
- 78% English-only · Spanish 15% Other Asian/Pacific 2% Other Indo-European 1%
Political lean MEDSL · Suffolk
- 2024 margin
- Lean R (+10.0) · D 45.0% · R 55.0%
- 2008→2024 swing
- -16.0pp toward R · 2008: 6.0pp · 2024: -10.0pp
- All cycles
- 2024: R+10.0 2020: R+0.0 2016: R+8.2 2012: D+2.9 2008: D+6.0
Not yet ingested
- Civics
- —
Market trends
- HPI YoY
- ▼ -578.02%
- Current HPI
- 375.1174
- Rent YoY
- ▲ 5.07%
- Metro
- New York-Newark-Jersey City, NY-NJ-PA
- State GDP YoY
- ▲ 2.60%
- F500 in state
- 92
Industry mix (Fortune 500 HQ in NY)
| Industry | F500 HQs | Revenue |
|---|---|---|
| Financial Services | 10 | $950B |
|
||
| Consumer Goods | 9 | $162B |
|
||
| Insurance | 4 | $225B |
|
||
| Telecommunications | 2 | $144B |
|
||
| Pharmaceuticals | 2 | $112B |
|
||
| Media / Entertainment | 2 | $69B |
|
||
Price history
+525.0% since first listed12 events — show timeline
- 2026-03-14 Pending — OneKey® MLS as Distributed by MLS Grid
- 2026-01-29 Listed $625,000 OneKey® MLS as Distributed by MLS Grid
- 2026-01-17 Coming Soon $625,000 OneKey® MLS as Distributed by MLS Grid
- 2022-08-18 Sold (Public Records) $425,150 Public Records
- 2022-06-06 Sold (MLS) $425,150 OneKey® MLS as Distributed by MLS Grid
- 2022-04-01 Pending — OneKey® MLS as Distributed by MLS Grid
- 2022-02-23 Relisted — OneKey® MLS as Distributed by MLS Grid
- 2022-02-22 Listing Removed — OneKey® MLS as Distributed by MLS Grid
- 2022-02-15 Listed $450,000 OneKey® MLS as Distributed by MLS Grid
- 2005-10-04 Sold (Public Records) $330,000 Public Records
- 1996-02-28 Sold (Public Records) $74,000 Public Records
- 1989-12-14 Sold (Public Records) $100,000 Public Records
Property tax history
+4.2%/yrLatest (2025): $15,718 · +0.2% YoY. Source: county tax records.
Cash-flow waterfall
monthlySold comps — $/sqft
last 12 mo · ≤1 miLoading sold comps…